

Global Research Editor’s note
The following article initially published in 2008 represents an alternative view and analysis of global climate change, which challenges the dominant Global Warming Consensus.
Global Research does not necessarily endorse the proposition of “Global Cooling” presented by Prof. Easterbrook, nor does it accept at face value the Consensus on Global Warming put forth by the Intergovernmental Panel on Climatic Change (IPCC). Our purpose is to encourage a more balanced debate on the topic of global climate change.
[Article originally published by Global Research in November 2008]
INTRODUCTION
Despite no global warming in 10 years and recording setting cold in 2007-2008, the Intergovernmental Panel on Climatic Change (IPCC) and computer modelers who believe that CO2 is the cause of global warming still predict the Earth is in store for catastrophic warming in this century. IPCC computer models have predicted global warming of 1° F per decade and 5-6° C (10-11° F) by 2100 (Fig. 1), which would cause global catastrophe with ramifications for human life, natural habitat, energy and water resources, and food production. All of this is predicated on the assumption that global warming is caused by increasing atmospheric CO2 and that CO2 will continue to rise rapidly.
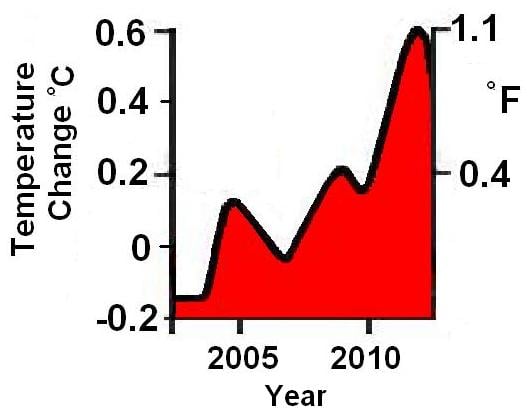
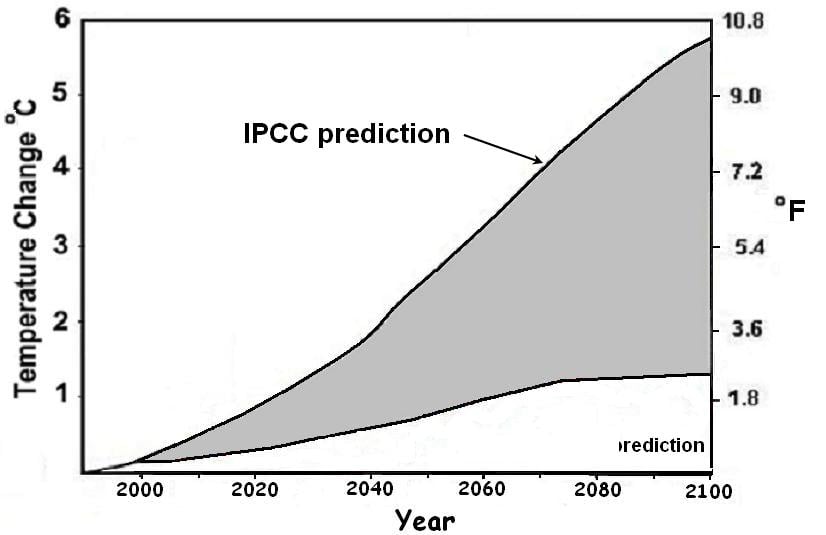
Figure 1. A. IPCC prediction of global warming early in the 21st century. B. IPCC prediction of global warming to 2100. (Sources: IPCC website)
However, records of past climate changes suggest an altogether different scenario for the 21st century. Rather than drastic global warming at a rate of 0.5 ° C (1° F) per decade, historic records of past natural cycles suggest global cooling for the first several decades of the 21st century to about 2030, followed by global warming from about 2030 to about 2060, and renewed global cooling from 2060 to 2090 (Easterbrook, D.J., 2005, 2006a, b, 2007, 2008a, b); Easterbrook and Kovanen, 2000, 2001). Climatic fluctuations over the past several hundred years suggest ~30 year climatic cycles of global warming and cooling, on a general rising trend from the Little Ice Age.
PREDICTIONS BASED ON PAST CLIMATE PATTERNS
Global climate changes have been far more intense (12 to 20 times as intense in some cases) than the global warming of the past century, and they took place in as little as 20–100 years. Global warming of the past century (0.8° C) is virtually insignificant when compared to the magnitude of at least 10 global climate changes in the past 15,000 years. None of these sudden global climate changes could possibly have been caused by human CO2 input to the atmosphere because they all took place long before anthropogenic CO2 emissions began. The cause of the ten earlier ‘natural’ climate changes was most likely the same as the cause of global warming from 1977 to 1998.

Figure 2. Climate changes in the past 17,000 years from the GISP2 Greenland ice core. Red = warming, blue = cooling. (Modified from Cuffy and Clow, 1997)
Climatic fluctuations over the past several hundred years suggest ~30 year climatic cycles of global warming and cooling (Figure 3) on a generally rising trend from the Little Ice Age about 500 years ago.
Figure 3. Alternating warm and cool cycles since 1470 AD. Blue = cool, red = warm. Based on oxygen isotope ratios from the GISP2 Greenland ice core.
Relationships between glacial fluctuations, the Pacific Decadal Oscillation, and global climate change.
After several decades of studying alpine glacier fluctuations in the North Cascade Range, my research showed a distinct pattern of glacial advances and retreats (the Glacial Decadal Oscillation, GDO) that correlated well with climate records. In 1992, Mantua published the Pacific Decadal Oscillation curve showing warming and cooling of the Pacific Ocean that correlated remarkably well with glacial fluctuations. Both the GDA and the PDO matched global temperature records and were obviously related (Fig. 4). All but the latest 30 years of changes occurred prior to significant CO2 emissions so they were clearly unrelated to atmospheric CO2.
Figure 4. Correspondence of the GDO, PDO, and global temperature variations.
The significance of the correlation between the GDO, PDO, and global temperature is that once this connection has been made, climatic changes during the past century can be understood, and the pattern of glacial and climatic fluctuations over the past millennia can be reconstructed. These patterns can then be used to project climatic changes in the future. Using the pattern established for the past several hundred years, in 1998 I projected the temperature curve for the past century into the next century and came up with curve ‘A’ in Figure 5 as an approximation of what might be in store for the world if the pattern of past climate changes continued. Ironically, that prediction was made in the warmest year of the past three decades and at the acme of the 1977-1998 warm period. At that time, the projected curved indicated global cooling beginning about 2005 ± 3-5 years until about 2030, then renewed warming from about 2030 to about 2060 (unrelated to CO2—just continuation of the natural cycle), then another cool period from about 2060 to about 2090. This was admittedly an approximation, but it was radically different from the 1° F per decade warming called for by the IPCC. Because the prediction was so different from the IPCC prediction, time would obviously show which projection was ultimately correct.
Now a decade later, the global climate has not warmed 1° F as forecast by the IPCC but has cooled slightly until 2007-08 when global temperatures turned sharply downward. In 2008, NASA satellite imagery (Figure 6) confirmed that the Pacific Ocean had switched from the warm mode it had been in since 1977 to its cool mode, similar to that of the 1945-1977 global cooling period. The shift strongly suggests that the next several decades will be cooler, not warmer as predicted by the IPCC.
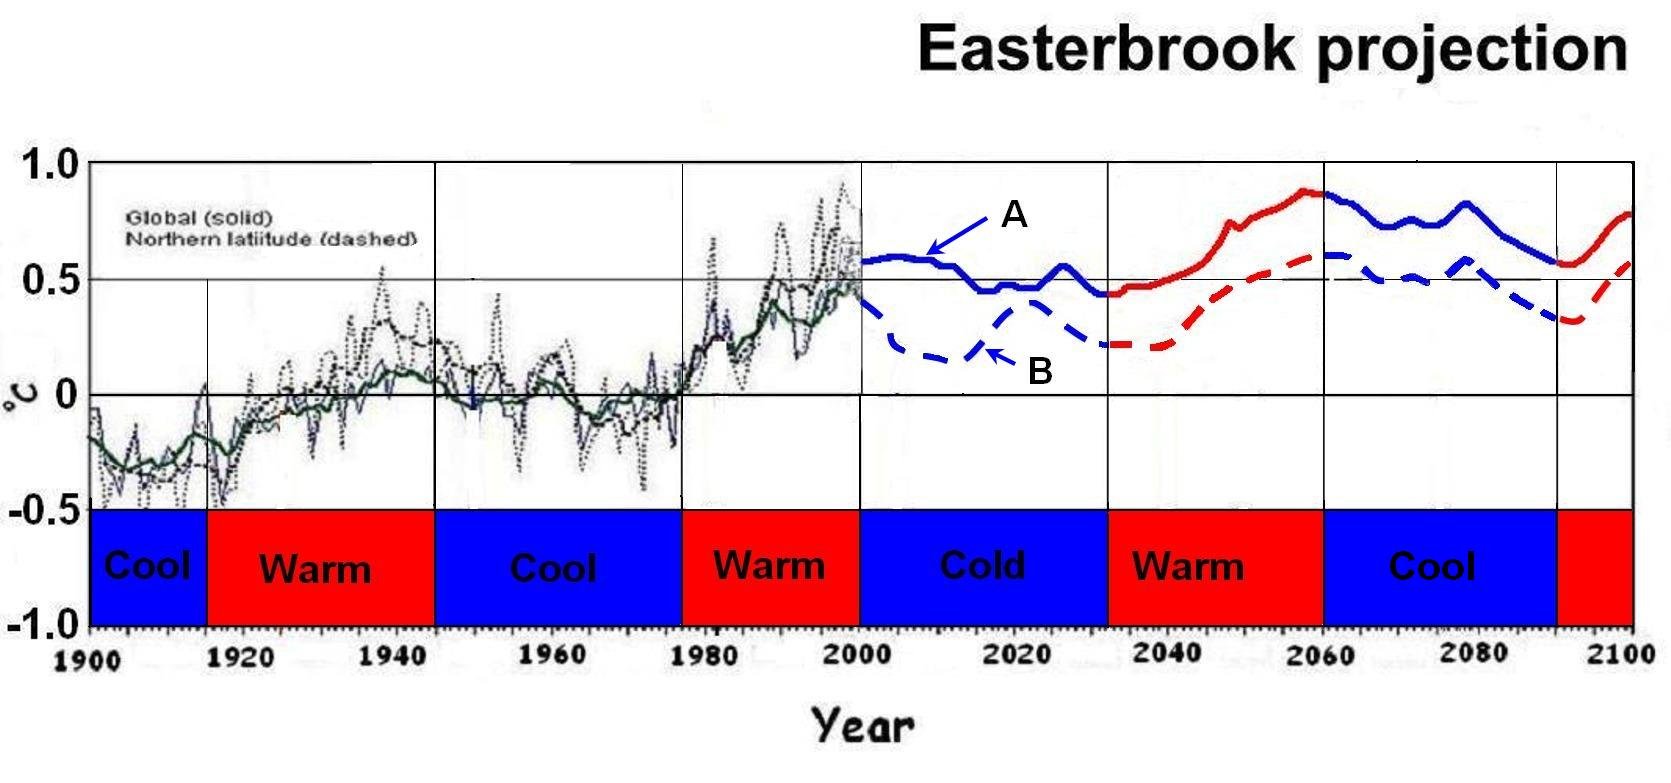
Figure 5.Global temperature projection for the coming century, based on warming/cooling cycles of the past several centuries. ‘A’ projection based on assuming next cool phase will be similar to the 1945-1977 cool phase. ‘B’ projection based on assuming next cool phase will be similar to the 1880-1915 cool phase. The predicted warm cycle from 2030 to 2060 is based on projection of the 1977 to 1998 warm phase and the cooling phase from 2060 to 2090 is based on projection of the 1945 to 1977 cool cycle.
Implications of PDO, NAO, GDO, and sun spot cycles for global climate in coming decades
The IPCC prediction of global temperatures, 1° F warmer by 2011 and 2° F by 2038 (Fig. 1), stand little chance of being correct. NASA’s imagery showing that the Pacific Decadal Oscillation (PDO) has shifted to its cool phase is right on schedule as predicted by past climate and PDO changes (Easterbrook, 2001, 2006, 2007). The PDO typically lasts 25-30 years and assures North America of cool, wetter climates during its cool phases and warmer, drier climates during its warm phases. The establishment of the cool PDO, together with similar cooling of the North Atlantic Oscillation (NAO), virtually assures several decades of global cooling and the end of the past 30-year warm phase. It also means that the IPCC predictions of catastrophic global warming this century were highly inaccurate.
The switch of PDO cool mode to warm mode in 1977 initiated several decades of global warming. The PDO has now switched from its warm mode (where it had been since 1977) into its cool mode. As shown on the graph above, each time this had happened in the past century, global temperature has followed. The upper map shows cool ocean temperatures in blue (note the North American west coast). The lower diagram shows how the PDO has switched back and forth from warm to cool modes in the past century, each time causing global temperature to follow. Comparisons of historic global climate warming and cooling over the past century with PDO and NAO oscillations, glacial fluctuations, and sun spot activity show strong correlations and provide a solid data base for future climate change projections.
The Pacific Ocean has a warm temperature mode and a cool temperature mode, and in the past century, has switched back forth between these two modes every 25-30 years (known as the Pacific Decadal Oscillation or PDO). In 1977 the Pacific abruptly shifted from its cool mode (where it had been since about 1945) into its warm mode, and this initiated global warming from 1977 to 1998. The correlation between the PDO and global climate is well established. The announcement by NASA’s Jet Propulsion Laboratory that the Pacific Decadal Oscillation (PDO) had shifted to its cool phase is right on schedule as predicted by past climate and PDO changes (Easterbrook, 2001, 2006, 2007). The PDO typically lasts 25-30 years and assures North America of cool, wetter climates during its cool phases and warmer, drier climates during its warm phases. The establishment of the cool PDO, together with similar cooling of the North Atlantic Oscillation (NAO), virtually assures several decades of global cooling and the end of the past 30-year warm phase.
Figure 6. Switch of PDO cool mode to warm mode in 1977 initiated several decades of global warming. The PDO has now switched from its warm mode (where it had been since 1977) into its cool mode. As shown on the graph above, each time this has happened in the past century, global temperature has followed. The upper map shows cool ocean temperatures in blue (note the North American west coast). The lower diagram shows how the PDO has switched back and forth from warm to cool modes in the past century, each time causing global temperature to follow. Projection of the past pattern (right end of graph) assures 30 yrs of global cooling
Comparisons of historic global climate warming and cooling over the past century with PDO and NAO oscillations, glacial fluctuations, and sun spot activity show strong correlations and provide a solid data base for future climate change projections. As shown by the historic pattern of GDOs and PDOs over the past century and by corresponding global warming and cooling, the pattern is part of ongoing warm/cool cycles that last 25-30 years. The global cooling phase from 1880 to 1910, characterized by advance of glaciers worldwide, was followed by a shift to the warm-phase PDO for 30 years, global warming and rapid glacier recession. The cool-phase PDO returned in ~1945 accompanied by global cooling and glacial advance for 30 years. Shift to the warm-phase PDO in 1977 initiated global warming and recession of glaciers that persisted until 1998. Recent establishment of the PDO cool phase appeared right on target and assuming that its effect will be similar to past history, global climates can be expected to cool over the next 25-30 years. The global warming of this century is exactly in phase with the normal climatic pattern of cyclic warming and cooling and we have now switched from a warm phase to a cool phase right at the predicted time (Fig. 5)
The ramifications of the global cooling cycle for the next 30 years are far reaching―e.g., failure of crops in critical agricultural areas (it’s already happening this year), increasing energy demands, transportation difficulties, and habitat change. All this during which global population will increase from six billion to about nine billion. The real danger in spending trillions of dollars trying to reduce atmospheric CO2 is that little will be left to deal with the very real problems engendered by global cooling.
CONCLUSIONS
Global warming (i.e, the warming since 1977) is over. The minute increase of anthropogenic CO2 in the atmosphere (0.008%) was not the cause of the warming—it was a continuation of natural cycles that occurred over the past 500 years.
The PDO cool mode has replaced the warm mode in the Pacific Ocean, virtually assuring us of about 30 years of global cooling, perhaps much deeper than the global cooling from about 1945 to 1977. Just how much cooler the global climate will be during this cool cycle is uncertain. Recent solar changes suggest that it could be fairly severe, perhaps more like the 1880 to 1915 cool cycle than the more moderate 1945-1977 cool cycle. A more drastic cooling, similar to that during the Dalton and Maunder minimums, could plunge the Earth into another Little Ice Age, but only time will tell if that is likely.
Don J. Easterbrook is Professor Emeritus of Geology at Western Washington University. Bellingham, WA. He has published extensively on issues pertaining to global climate change. For further details see his list of publications