Probable Causal Association Between Australia’s New Regime of High All-cause Mortality and Its COVID-19 Vaccine Rollout


All Global Research articles can be read in 51 languages by activating the Translate Website button below the author’s name.
To receive Global Research’s Daily Newsletter (selected articles), click here.
Follow us on Instagram and Twitter and subscribe to our Telegram Channel. Feel free to repost and share widely Global Research articles.
***
Abstract
All-cause mortality by week in Australia shows that there was no detectable excess mortality 13 months into the declared pandemic, followed by a step-wise increase in mortality in mid-April 2021, synchronous with the rollout of the COVID-19 vaccine prioritizing elderly, disabled and aboriginal residents.
The excess mortality in the vaccination period (mid-April 2021 through August 2022; 14 % larger all-cause mortality than in recent pre-vaccination periods of same time duration;
62 million administered vaccine doses) was 31±1 thousand deaths, which is more than twice the deaths registered as from or with COVID‑19.
In addition, a sharp peak in all-cause mortality (mid-January to mid-February 2022; 2,600 deaths) is synchronous with the rapid rollout of the booster (9.4 million booster doses, same time period), and is not due to a climatic heatwave.
We give thirteen numbered arguments as to why we conclude that the excess mortality in Australia is causally associated with the COVID-19 vaccine.
The corresponding vaccine injection fatality ratio (vIFR) is approximately 0.05 %, which we compare to estimated vIFR values from the USA Vaccine Adverse Event Reporting System (VAERS) and from all-cause mortality data for India, Southern states of the USA, Michigan (USA) and Ontario (Canada).
*
Australia experienced a significant and sustained increase in all-cause mortality, starting with its COVID-19 vaccine rollout aimed at high-risk residents in mid-April 2021, whereas it saw no detectable excess all-cause mortality up to that point during 13 months of a pandemic that was declared by the World Health Organization (WHO) on 11 March 2020.
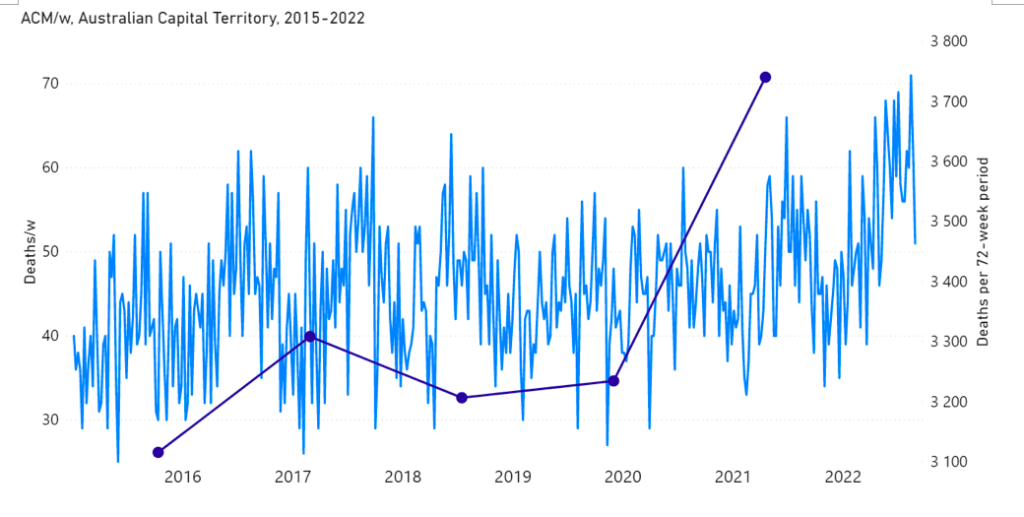
Starting in mid-April 2021, the all-cause mortality per week in Australia shows a sustained increase of >10 %, during which it never returns to its seasonal low value (of approximately 3,000 deaths/week) and attains highs of >4,000 deaths/week in June-July-August 2022. The step-wise increase in all-cause mortality remains large up to the final date of presently consolidated official government statistics (week-34 of 2022, week ending 28 August 2022) (Australian Bureau of Statistics, 2022a).
Over the measured period of the step-wise increase in all-cause mortality (mid‑April 2021 through August 2022; 14 % larger all-cause mortality than in recent pre-vaccination periods of same time duration; 62 million administered vaccine doses) there are 31±1 thousand excess deaths of all causes in Australia, whereas no excess deaths are detected in the prior 13-month period since a pandemic was declared (mid-March 2020 through mid-April 2021).
The excess all‑cause mortality following the COVID-19 vaccine rollout (31,000 deaths, mid‑April 2021 through August 2022) is more than twice the total number of deaths registered as being from or with COVID-19 (14,014 deaths, 1 January 2020 through 29 August 2022; WHO, consulted 20 December 2022, https://covid19.who.int/region/wpro/country/au).
The above points are corroborated and illustrated in the following figures.
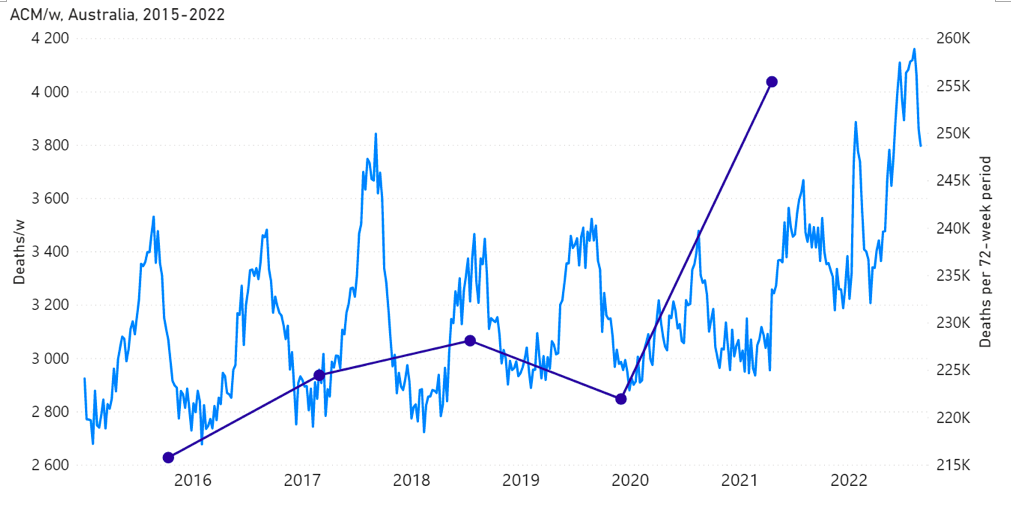
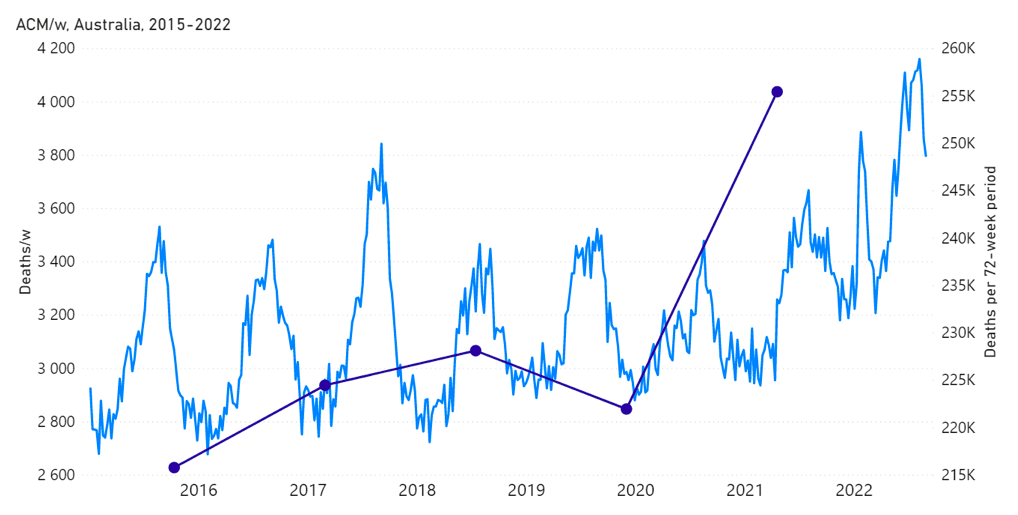
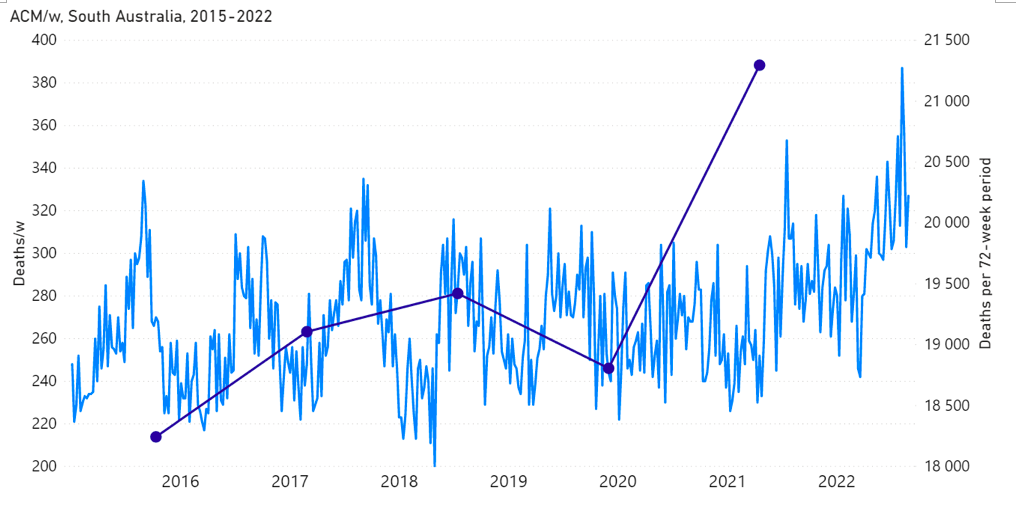
Figure 1A: All-cause mortality in Australia, all ages, from week-1 2015 (week ending 4 January 2015) through week-34 2022 (week ending 28 August 2022). Light-blue: All-cause mortality by week, left y-scale. Dark-blue: Integrated all-cause mortality over successive and non-overlapping 72-week periods (week-15 2021 through week-34 2022, for most recent period), right y-scale. Each point is positioned on the x-axis at the 1st week of its 72-week integration period. (Data source: Australian Bureau of Statistics, 2022a.)
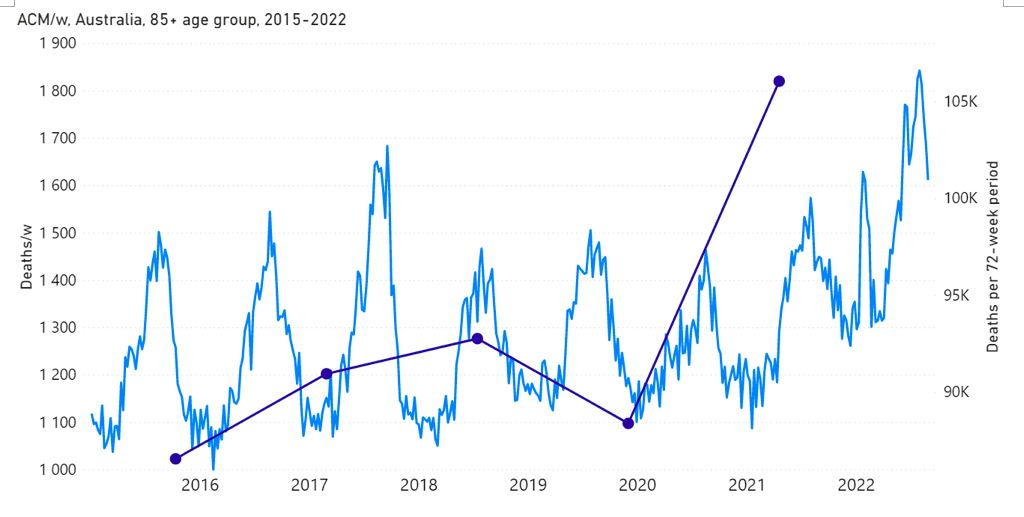
Figure 1B: All-cause mortality in Australia, ages 85+ years, from week-1 2015 (week ending 4 January 2015) through week-34 2022 (week ending 28 August 2022). Light-blue: All-cause mortality by week, left y-scale. Dark-blue: Integrated all-cause mortality over successive and non-overlapping 72-week periods (week-15 2021 through week-34 2022, for most recent period), right y-scale. Each point is positioned on the x-axis at the 1st week of its 72-week integration period. (Data source: Australian Bureau of Statistics, 2022a.)
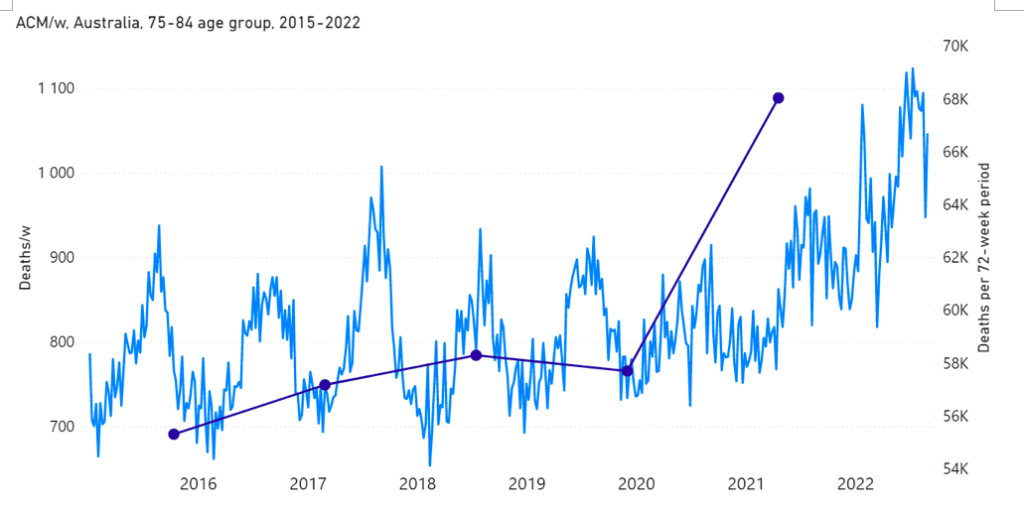
Figure 1C: All-cause mortality in Australia, ages 75-84 years, from week-1 2015 (week ending 4 January 2015) through week-34 2022 (week ending 28 August 2022). Light-blue: All-cause mortality by week, left y-scale. Dark-blue: Integrated all-cause mortality over successive and non-overlapping 72-week periods (week-15 2021 through week-34 2022, for most recent period), right y-scale. Each point is positioned on the x-axis at the 1st week of its 72-week integration period. (Data source: Australian Bureau of Statistics, 2022a.)
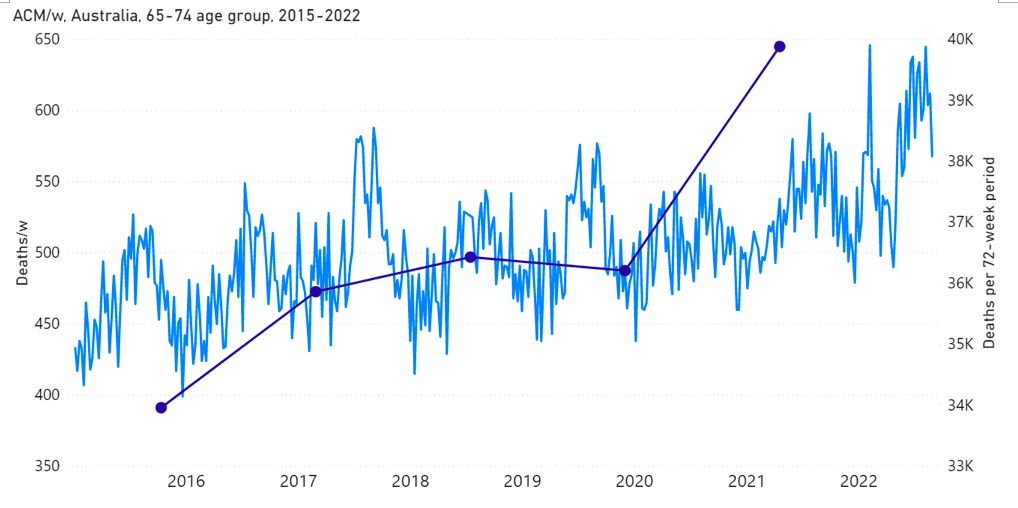
Figure 1D: All-cause mortality in Australia, ages 65-74 years, from week-1 2015 (week ending 4 January 2015) through week-34 2022 (week ending 28 August 2022). Light-blue: All-cause mortality by week, left y-scale. Dark-blue: Integrated all-cause mortality over successive and non-overlapping 72-week periods (week-15 2021 through week-34 2022, for most recent period), right y-scale. Each point is positioned on the x-axis at the 1st week of its 72-week integration period. (Data source: Australian Bureau of Statistics, 2022a.)
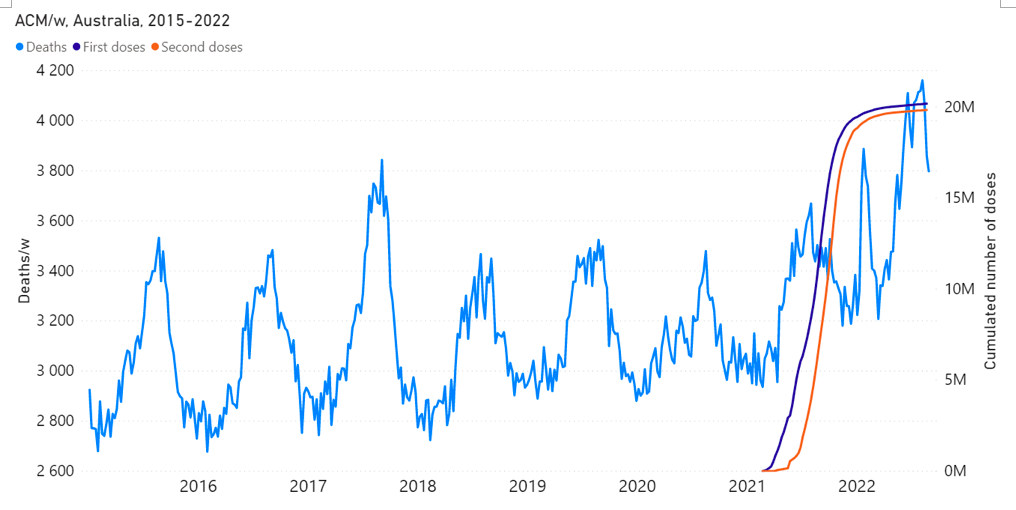
Figure 2: All-cause mortality in Australia, all ages, from week-1 2015 (week ending 4 January 2015) through week-34 2022 (week ending 28 August 2022), compared to the COVID-19 vaccine rollout. Light-blue: All-cause mortality by week, left y-scale. Dark-blue: Cumulative 1st doses of the vaccine. Orange: Cumulative 2nd doses of the vaccine. (Data sources: Australian Bureau of Statistics (2022a); and https://www.covid19data.com.au/vaccines, consulted on 14 December 2022.)
The vaccine rollout is shown in more detail as follows.
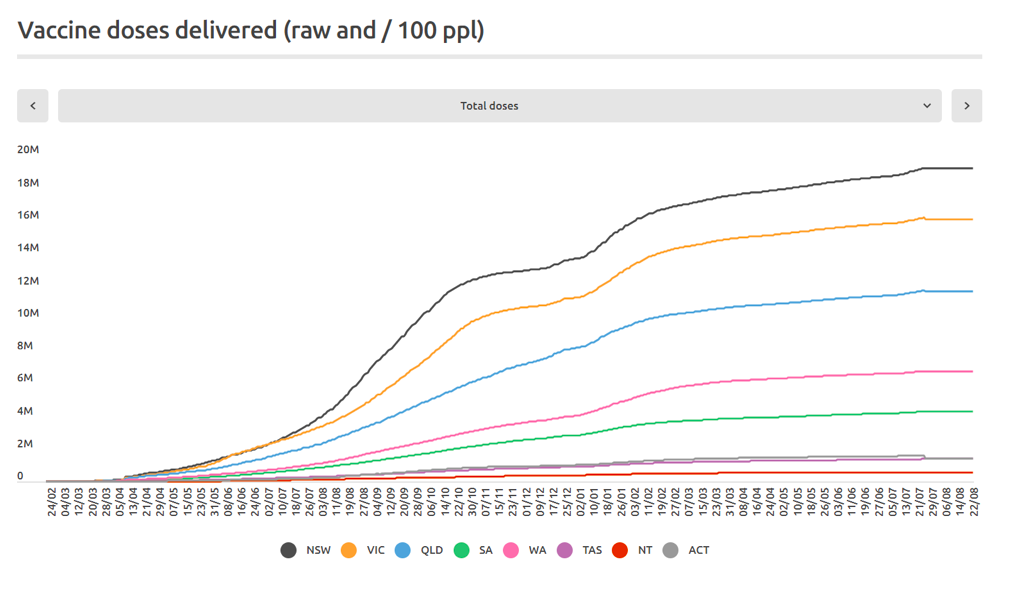
Figure 3A: Cumulative COVID-19 vaccine doses administered (all dose types) by time (24 February 2021 through 22 August 2022) by state in Australia (as indicated, in the sequence NSW, VIC, QLD, SA, WA, TAS, NT, ACT). (Source: https://www.covid19data.com.au/vaccines, accessed 20 December 2022.)
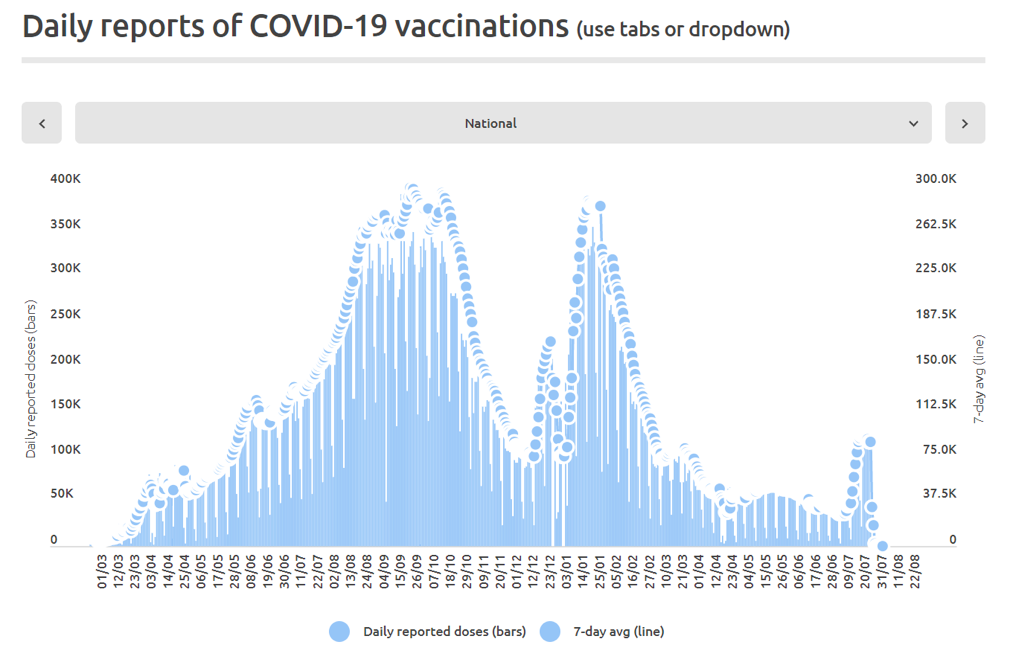
Figure 3B: Daily and 7-day average daily reported COVID-19 vaccine doses (all dose types) administered by time (1 March 2021 through 22 August 2022) in Australia. (Source: https://www.covid19data.com.au/vaccines, accessed 20 December 2022.)
Mortality and vaccination data specifically for the state of Victoria (VIC), Australia, is shown, for example, as follows.
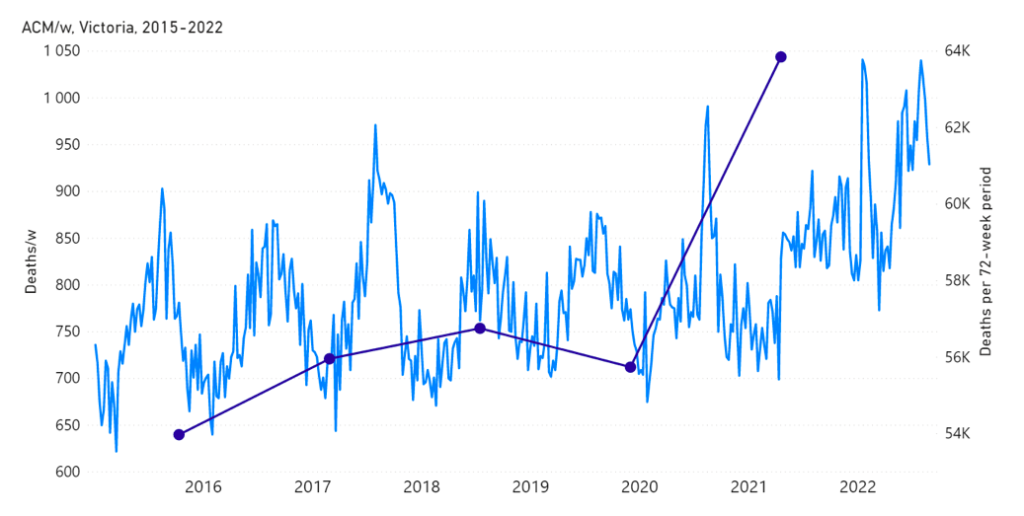
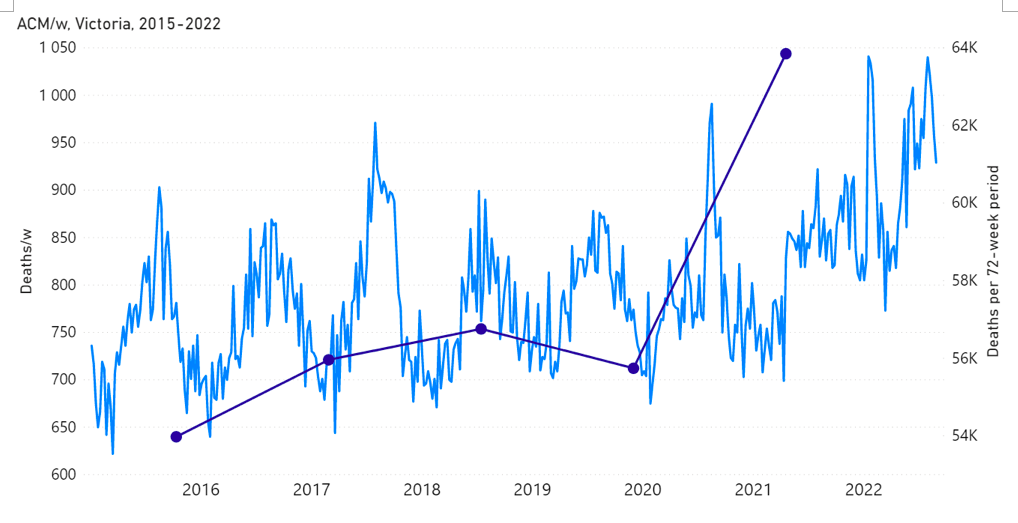
Figure 4A: All-cause mortality in the state of Victoria (VIC), Australia, all ages, from week‑1 2015 (week ending 4 January 2015) through week-34 2022 (week ending 28 August 2022). Light-blue: All-cause mortality by week, left y-scale. Dark-blue: Integrated all-cause mortality over successive and non-overlapping 72-week periods (week-15 2021 through week-34 2022, for most recent period), right y-scale. Each point is positioned on the x-axis at the 1st week of its 72-week integration period. (Data source: Australian Bureau of Statistics, 2022a.)
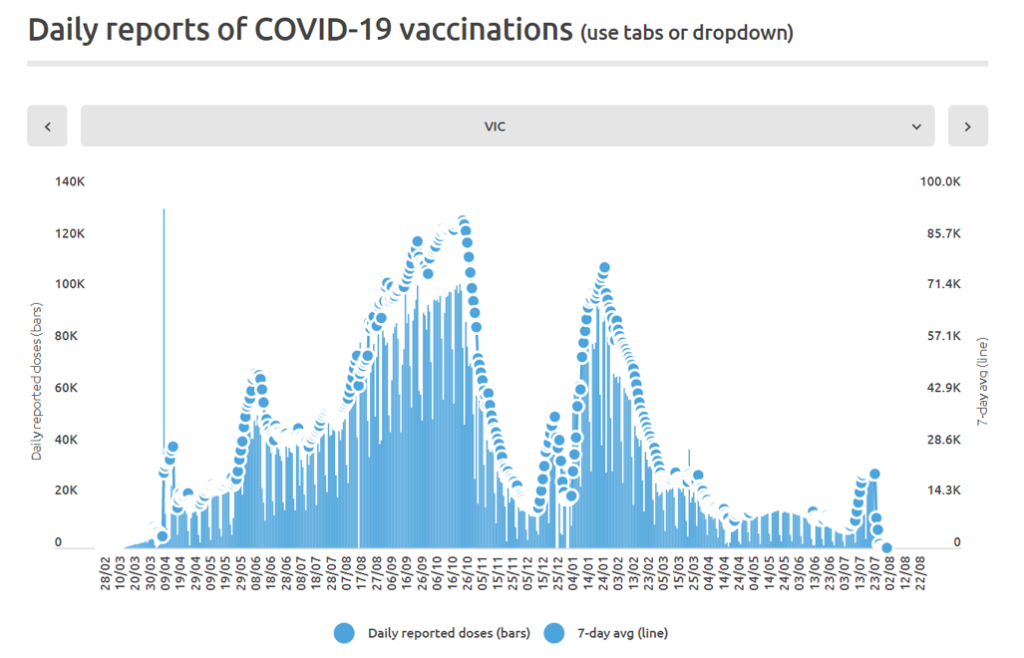
Figure 4B: Daily and 7-day average daily reported COVID-19 vaccine doses (all dose types) administered by time (28 February 2021 through 22 August 2022) in the state of Victoria (VIC), Australia. (Source: https://www.covid19data.com.au/vaccines, accessed 20 December 2022.)
The step-wise increase in mortality is evident in Figure 1 (A through C), and it is synchronous with the COVID-19 vaccine rollout (Figures 2, 3 and 4).
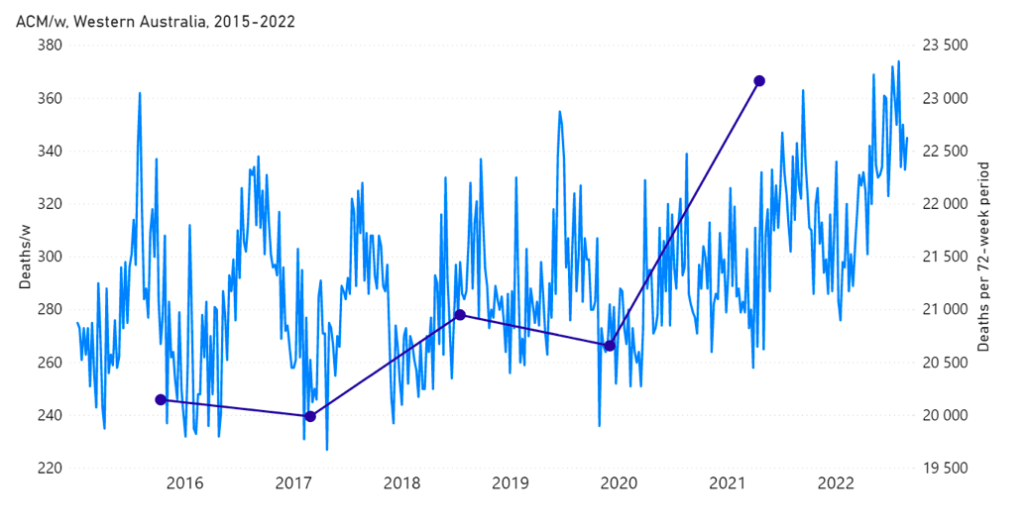
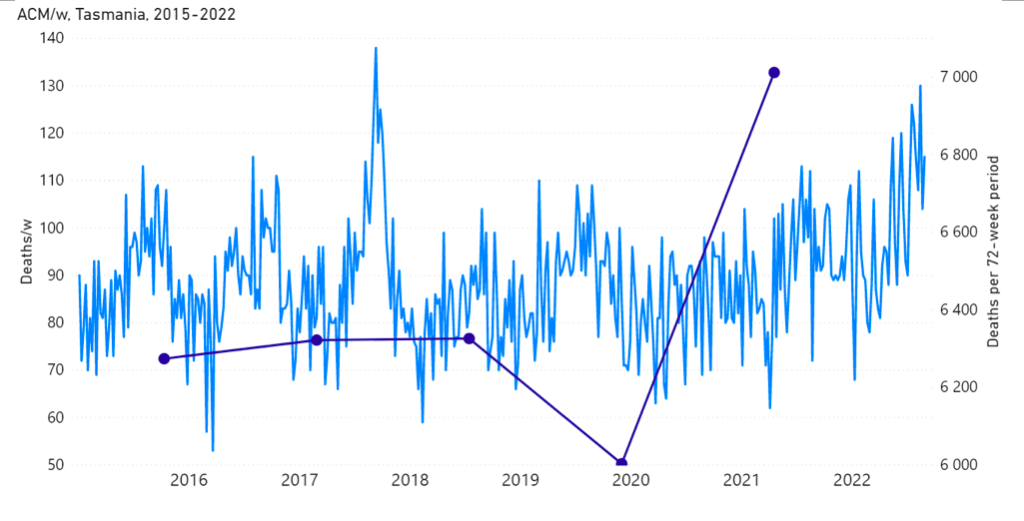
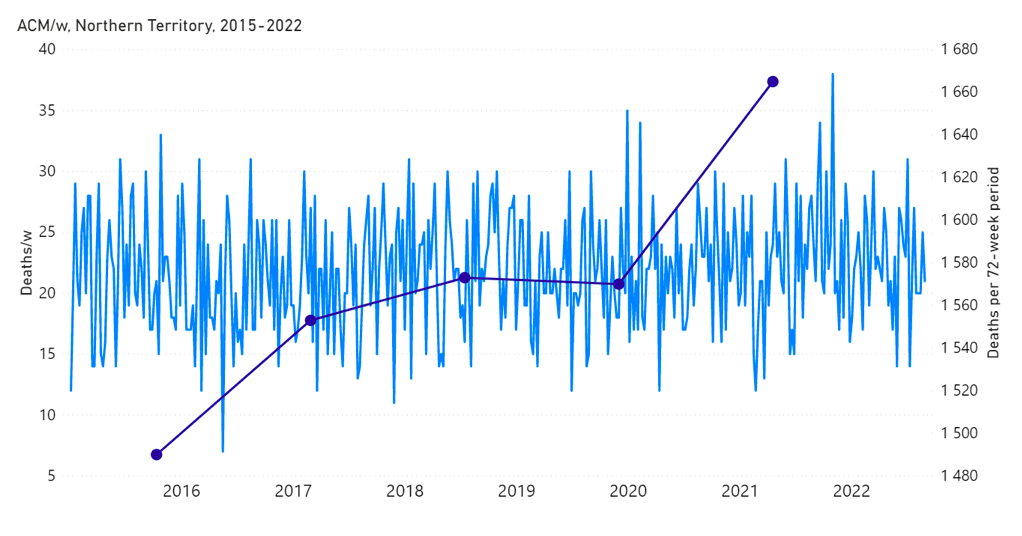
The step-wise transition to a regime of larger all-cause mortality is also seen in the different states of Australia. The example of Victoria is shown in Figure 4. The same phenomenon occurs in the all-cause mortality of all the eight states of Australia, although not clearly in NT (Northern Territory) (Appendix 1).
In addition to the above-described step-wise change in regime of all-cause mortality, there is a prominent peak in all-cause mortality, having a full duration of seven weeks, from mid-January to mid-February 2022. It is not consistent with a seasonal feature and it is synchronous with a large burst in COVID-19 vaccine dose delivery (Figures 1, 3B and 4), which was the rollout of the booster (3rd doses) in Australia. The said 7-week-duration peak in all-cause mortality is prominent in the states NSW, QLD and VIC, but is essentially not present in the other states (Appendix 1). The booster rollout is shown in the following Figures 5 and 6.
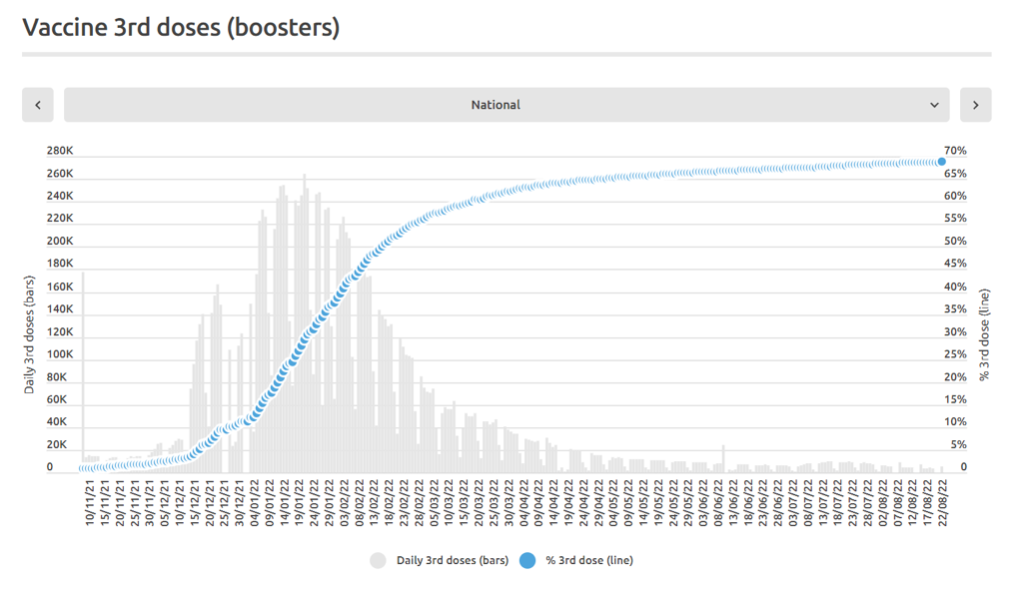
Figure 5: Daily and cumulative booster (3rd doses) rollout in Australia. The time axis is from 10 November 2021 through 22 August 2022. (Source: https://www.covid19data.com.au/vaccines, accessed 20 December 2022.)
Direct comparisons between all-cause mortality by week for the mid-January to mid‑February 2022 peak and booster delivery by week are shown below, for Australia and for the states NSW, VIC and QLD (Figures 6A through 6D).
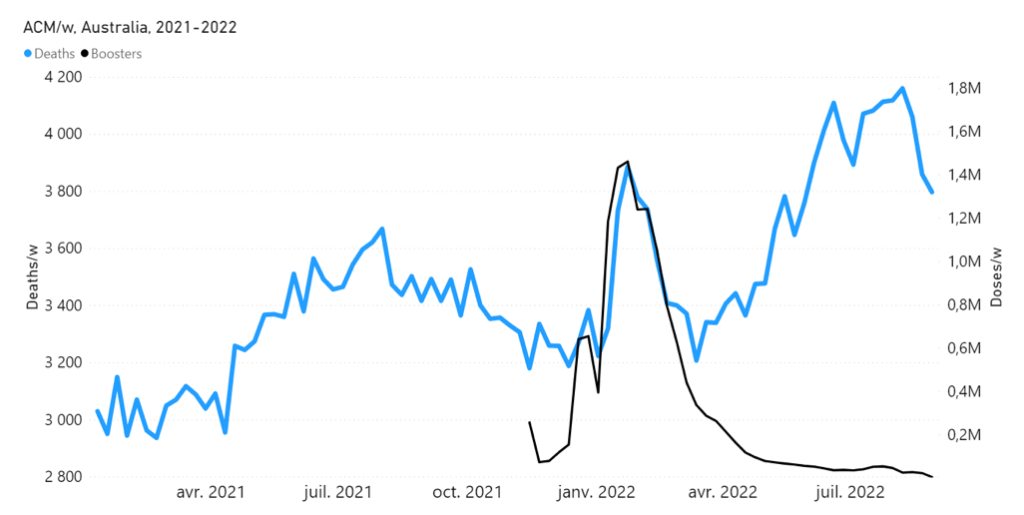
Figure 6A: Highlight of the mid-January to mid-February 2022 mortality peak, in relation to booster (3rd doses) delivery, in Australia. All-cause mortality by week (light-blue) and booster doses delivered by week (black) from 2021 to 2022. (Data sources: Australian Bureau of Statistics (2022a); and https://www.covid19data.com.au/vaccines, consulted on 14 December 2022.)
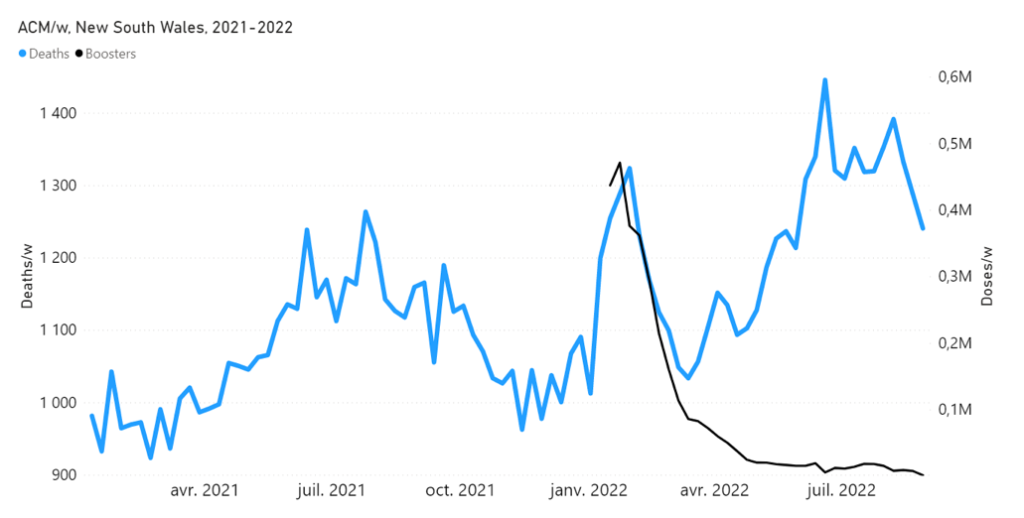
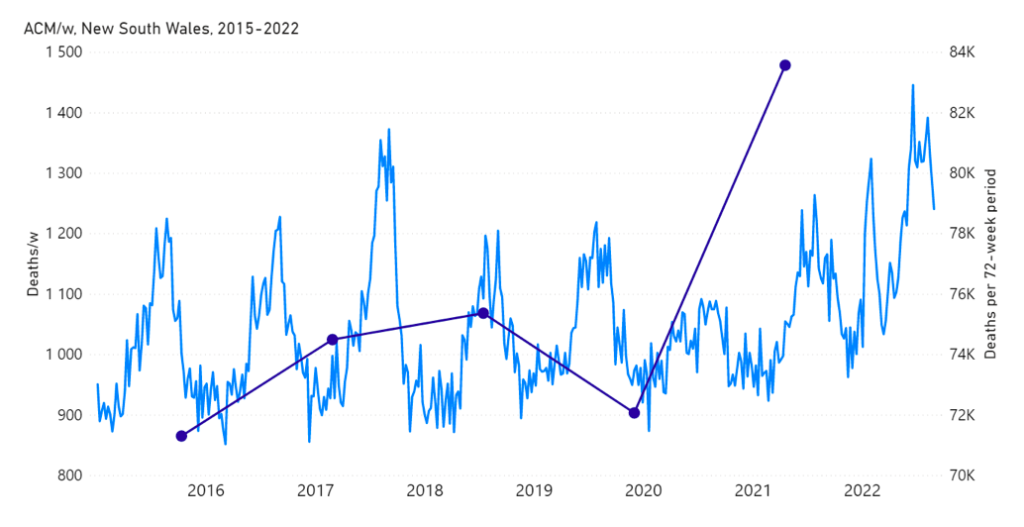
Figure 6B: Highlight of the mid-January to mid-February 2022 mortality peak, in relation to booster (3rd doses) delivery, in NSW (Australia). All-cause mortality by week (light-blue) and booster doses delivered by week (black) from 2021 to 2022. Both mortality and booster delivery are for NSW. (Data sources: Australian Bureau of Statistics (2022a); and https://www.covid19data.com.au/vaccines, consulted on 14 December 2022.)
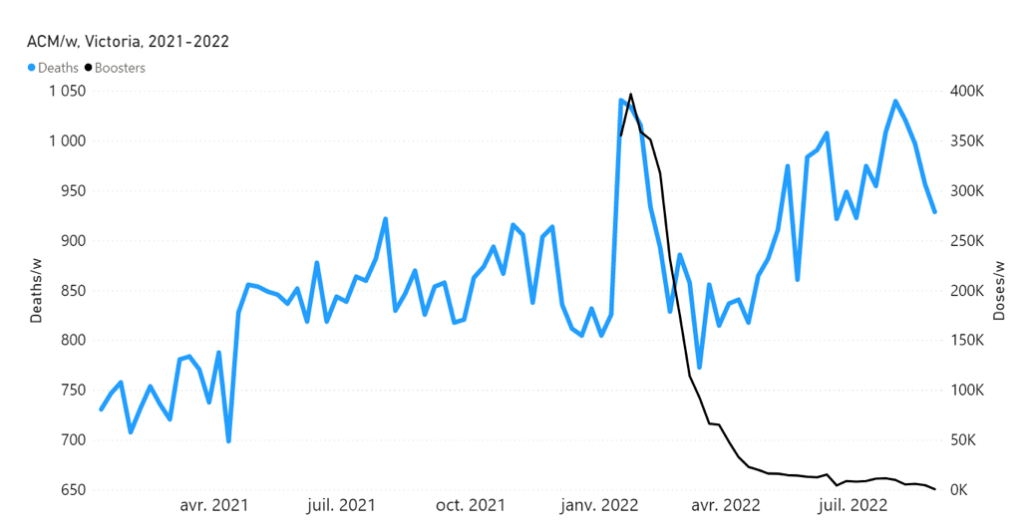
Figure 6C: Highlight of the mid-January to mid-February 2022 mortality peak, in relation to booster (3rd doses) delivery, in VIC (Australia). All-cause mortality by week (light-blue) and booster doses delivered by week (black) from 2021 to 2022. Both mortality and booster delivery are for VIC. (Data sources: Australian Bureau of Statistics (2022a); and https://www.covid19data.com.au/vaccines, consulted on 14 December 2022.)
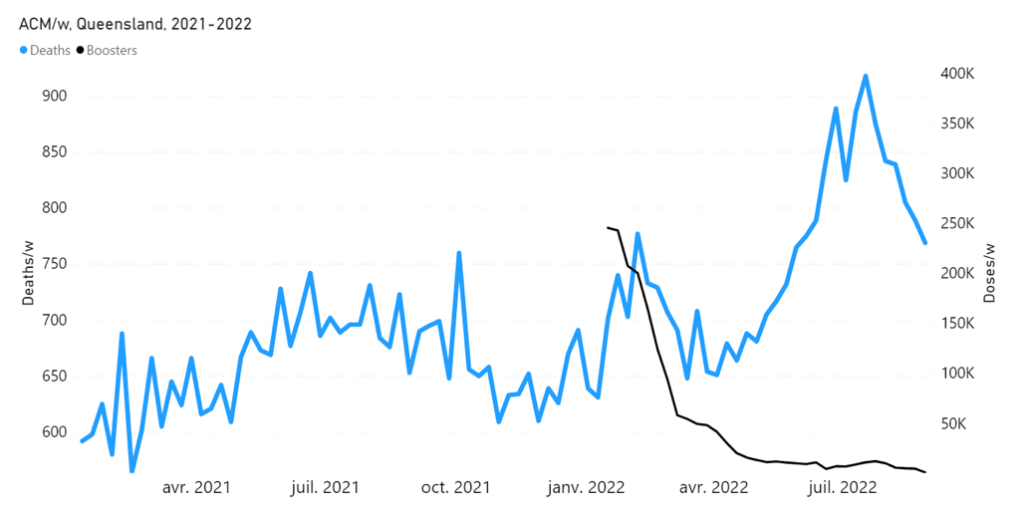
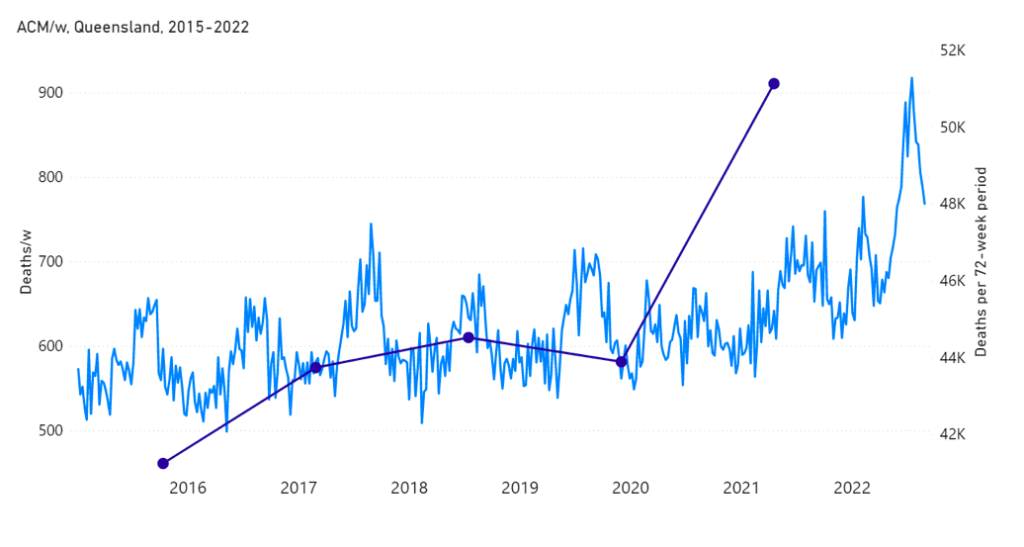
Figure 6D: Highlight of the mid-January to mid-February 2022 mortality peak, in relation to booster (3rd doses) delivery, in QLD (Australia). All-cause mortality by week (light-blue) and booster doses delivered by week (black) from 2021 to 2022. Both mortality and booster delivery are for QLD. (Data sources: Australian Bureau of Statistics (2022a); and https://www.covid19data.com.au/vaccines, consulted on 14 December 2022.)
The integrated excess mortality in the 7-week-duration peak, relative to its baseline, is approximately 2,600 deaths, compared to approximately 9.4 million booster doses delivered over the duration of the mortality peak. This corresponds to a vaccine injection fatality ratio (vIFR) of approximately 0.03 %, which in turn is not too different from the vIFR of 0.008 % for 65+ year old USA subjects injected with the Janssen vaccine, calculated from the Vaccine Adverse Event Reporting System (VAERS) data by Hickey and Rancourt (2022) (their Table 1).
An alternative hypothesis for the 7-week-duration mortality peak would be that it was caused by an Australian summer heatwave affecting Eastern Australia. This hypothesis is not tenable with the climatic and mortality data, which we demonstrate in Appendix 2.
For the following reasons (presented as numbered points), taken together, we conclude that the 16-month (mid-April 2021 through August 2022) sustained regime of large excess all-cause mortality in Australia may largely or predominantly be caused by its vaccine rollout, including the booster (3rd doses).
1 – There is a clear temporal association between the new regime of heightened all‑cause mortality and the vaccine rollout, whereas Australia did not have detectable excess mortality up to the start of the rollout, during 13 months of a pandemic that was declared by the WHO on 11 March 2020. (Figures 1, 2, 4 and 6; and Appendix 1)
2 – The excess mortality in the vaccination period (mid-April 2021 through August 2022) for Australia (all ages) is 31,000 (±1,000) deaths (Figure 1A), which is more than twice the total number of deaths registered as being from or with COVID-19 (14,014 deaths, 1 January 2020 through week ending 29 August 2022; WHO, consulted 15 December 2022, https://covid19.who.int/region/wpro/country/au).
Note that the percentage of total COVID-19-assigned deaths that are “with COVID-19” (rather than “from COVID-19”) varies between approximately 10 % and 30 %, in the period January 2022 through August 2022 (Australian Bureau of Statistics, 2022b; their figure entitled “Proportion of deaths from and with COVID-19 during the Omicron wave”, and see “Proportion of deaths from and with COVID-19 during the Omicron wave by state of registration”). Here, death “from COVID-19” means that COVID-19 is assigned as “the underlying cause of death as the disease or condition that initiated the train of morbid events leading to death”, whereas other diseases and conditions reported as contributing to death are “referred to as associated causes” (Australian Bureau of Statistics, 2022c). In fact, 95.4 % of deaths “from COVID-19” in Australian death certificates had non-COVID-19 “causal sequences of events” and/or “pre-existing chronic conditions” (Australian Bureau of Statistics, 2022c; their table entitled “Number of deaths due to COVID-19 that has associated conditions”).
The question is unavoidable: Why would Australians suddenly (at the start of the vaccine rollout) start dying in excess of something mostly if not entirely other than COVID-19, after 13 months of a declared pandemic during which there was no detectable excess all-cause mortality?
3 – The mean vIFR in the vaccination period (mid-April 2021 through August 2022) for Australia, therefore, would be:
31 K deaths / 62 M vaccine doses[1] = 0.05 %
which is larger than the vIFR of 0.008 % for 65+ year old USA subjects injected with the Janssen vaccine, calculated from the VAERS data (Hickey and Rancourt, 2022; their Table 1), and smaller than the estimated 1 % calculated for the excess mortality event in India (Rancourt, 2022), and for excess mortality peaks for several Southern states of the USA (Rancourt et al., 2022). As such, the 0.05 % estimated mean vIFR for Australia is within an expected range for real‑world circumstances.
4 – In addition to the above-described vaccination-period regime of all-cause mortality (mid-April 2021 through August 2022), there is a prominent peak in all-cause mortality from mid-January to mid-February 2022, having a full duration of seven weeks, which is synchronous with a large burst in COVID-19 vaccine dose delivery (Figures 1, 3B, 4 and 6). The said large burst in vaccine dose delivery was the rollout of the booster (3rd doses) in Australia (Figures 5 and 6).
We stress that Figure 6, showing a high degree of synchronicity (in both position and width) between the mid‑January to mid-February 2022 all-cause mortality peak and the booster (3rd doses) delivery pattern, with the booster delivery surge generally leading the mortality surge by approximately 1 week, represents strong evidence for a causal relation; the strongest we have seen in all-cause mortality data.
5 – The said prominent peak in all-cause mortality from mid-January to mid-February 2022 has an integrated excess mortality in its 7-week duration, relative to its baseline, of approximately 2,600 deaths, compared to approximately 9.4 million booster doses delivered over the duration of the mortality peak. This corresponds to a calculated vIFR for the specific mortality peak:
2.6 K deaths / 9.4 M vaccine doses[2] = 0.03 %
which is comparable in value to that obtained (0.05 %) for the mean vIFR in the vaccination period (mid-April 2021 through August 2022) for Australia.
6 – The impact of the rollout would be sudden, as observed (Figures 1, 2, 4A and 6; and Appendix 1), because Australia prioritized elderly, disabled and aboriginal residents (Australian Government – Department of Health and Aged Care, 2021).
7 – The step-wise increase in all-cause mortality, into the regime of excess all-cause mortality (mid‑April 2021 through August 2022) occurs simultaneously in mid‑April 2021 across all of Australia, in the eight states (see Appendix 1), rather than showing any distribution of starting times, which would be compatible with a spreading infectious disease seeding different regions at different times and spreading at different rates depending on regional differences of social and health conditions.
In this regard, theoretical models of spreading and emerging pandemics show high sensitivity of dynamic outcomes to seeding, societal population size, and inferred social and health conditions (Parham and Michael, 2011; Hasegawa and Nemoto, 2016; Ma et al., 2022).
8 – The VAERS data of the USA unambiguously shows excess all-cause deaths immediately following injections with each of the three types of COVID-19 vaccines used in the USA, with a prominent peak within 5 days of injection and an exponentially decaying excess mortality extending 2 months following injection (Hickey and Rancourt, 2022; see their Figs. S3 through S5). The integrated mortality by number of injections following injection (injection toxicity or vIFR) increases exponentially with age, as does the batch to batch variability of toxic effect (Hickey and Rancourt, 2022; see their Fig. S6). The latter observations of exponential increases with age mean that the injections represent fatal challenges in proportion to frailty of the subject.
9 – Detailed histopathological and immunohistochemical autopsy studies have demonstrated that the COVID-19 vaccines are causes of death, both in otherwise healthy subjects and in elderly subjects with comorbidities (Choi et al., 2021; Schneider et al., 2021; Sessa et al., 2021; Gill et al., 2022; Mörz, 2022; Schwab et al., 2022; Yoshimura et al., 2022).
10 – The Australian Government interprets both test results (cases) and the mortality as occurring in four “waves”, which it describes by time period as follows (Australian Bureau of Statistics, 2022b):
- “Wave 1: as occurring between March and May 2020. The predominant variant during Wave 1 was the original virus strain.
- Wave 2: as occurring between June and November 2020. Wave 2 predominantly occurred in Victoria. The variant during Wave 2 was the original virus strain.
- Delta wave: as occurring between July and December 2021.
- Omicron wave: as occurring during 2022 (until the end of September 2022). Due to the length of this wave and the higher number of deaths […].”
We have not found any study establishing a scientific basis for the Australian Government’s assignation of these waves. Furthermore, the said Government’s assignation is irreconcilable with:
- the absence of detected excess mortality in March-May 2020 (Figure 1; and Appendix 1),
- the absence of detected excess mortality in Australia (Figure 1A) and in Victoria (Figure 4A) in the period June-November 2020 (and see Appendix 1),
- a Delta-variant wave (July-December 2021) that would have missed both the mid-April 2021 step-wise surge in excess all-cause mortality and the 7-week-duration mid-January to mid-February 2022 peak in excess all-cause mortality, and
- an Omicron-variant wave (2022) that would have caused two distinct and prominent features in excess all-cause mortality, namely the mid-January to mid‑February 2022 7-week-duration peak and the large surge that followed starting in May 2022 (Figure 1A).
The official interpretive situation is similar, although less sophisticated, to that employed by Dhar et al. (2021) who postulated that the April-July 2021 “second wave” event in Delhi (the capital city of India) was due to the Delta variant, which would have quickly swept Delhi to become predominant because it would have higher transmissibility and larger immune escape than concomitantly circulating variants. However, Dhar et al. estimate the needed characteristics of Delta by fitting a model to the epidemiological data and to the variant predominance estimated by genomic measurements from small non-randomized cohorts. Leaving aside the large known and unknown uncertainties throughout their exercise, basically, the inferred characteristics of Delta are obtained by fitting to the data, rather than being independently measured in a controlled clinical trial. Under such circumstances, the mortality event creates an illusion of the needed Delta for Delhi, but an actual Delta cannot be concluded to have caused the mortality event.
Likewise, the Australian Government’s assignation of COVID-19 waves for Australia is merely a naming exercise of reported test results (case statistics), coupled to sparse and unreliable genomic measurements (Australian Government – Department of Health and Aged Care, 2022). The Australian Government’s assignation is contradicted by hard data of all-cause mortality by time.
11 – A similar synchronicity between vaccine dose delivery and excess all-cause mortality is observed in connection with the so-called “vaccine equity” campaigns in the USA. An anomalous fall-2021 peak was interpreted as being caused by the vaccines, and is prominent in the 25-64 years age group in 21 states of the USA, most notably including Alabama, Mississippi, Georgia, Florida and Louisiana (Rancourt et al., 2022). The data for Mississippi is shown below (Figure 7).
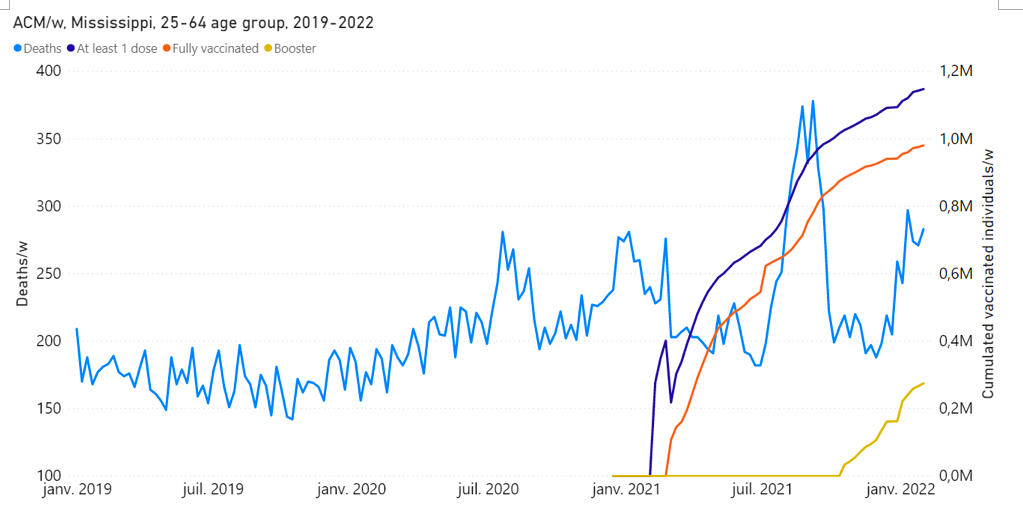
Figure 7: Rancourt et al. (2022), their Fig. 11B. All-cause mortality by week (light-blue), cumulated number of people with at least one dose of vaccine (dark-blue), cumulated number of fully vaccinated people (orange) and cumulated number of people with a booster dose (yellow) by week from 2019 to 2022, for 25-64 years age group in Mississippi. Data are displayed from week-1 of 2019 to week-5 of 2022.
In the study by Rancourt et al. (2022), it was concluded that significant (detectable by all-cause mortality) vaccine-induced mortality occurred primarily among fragile groups, characterized by high degrees of poverty, disability, obesity, diabetes, and high medication rates. The vaccine injection was seen as an additional challenge, often accelerating and causing death in residents with comorbidities.
12 – Another example of probably causal synchronicity between a rapid COVID-19 vaccine rollout prioritizing elderly, frail and disabled residents and large excess all‑cause mortality is that of India (Rancourt, 2022). In that case, the early rollout of the vaccine in April-July 2021 was devastating, causing the deaths of approximately 3.7 million residents, on administering approximately 350 million doses of the vaccine (in a population of 1.39 billion). This corresponds to an effective vIFR (per-dose toxicity) of approximately 1 %. It is also approximately the same vIFR (1 %) as is consistent with the anomalous fall-2021 peak in excess all-cause mortality occurring in high‑poverty states of the USA, which was interpreted as being caused by the vaccine (Rancourt et al., 2022; and see the data for Mississippi shown in Figure 7).
Clearly, frail residents are susceptible to being fatally harmed by the injection and should be protected against state-run injection campaigns implemented without stringent individual clinical risk assessment. It appears that the population-wide COVID-19 vIFR can be as large as 1 % (India, Southern USA states), and is approximately 0.05 % in Australia.
Both India and Australia had virtually no detectable excess all-cause mortality after a pandemic was declared by the WHO, until their respective COVID-19 vaccine rollouts, which makes the synchronicity association relatively easy to assign.
13 – Two more examples of synchronicity between a rapid COVID-19 vaccine rollout prioritizing elderly and vulnerable residents and large excess all‑cause mortality occur for Michigan, USA (Rancourt et al., 2022) and Ontario, Canada.
Key figures for Michigan, USA are as follows (Figure 8). The COVID-19 vIFR in the main rollout of the vaccine in Michigan is comparable in value to that for the vaccination period for Australia (0.05 %).
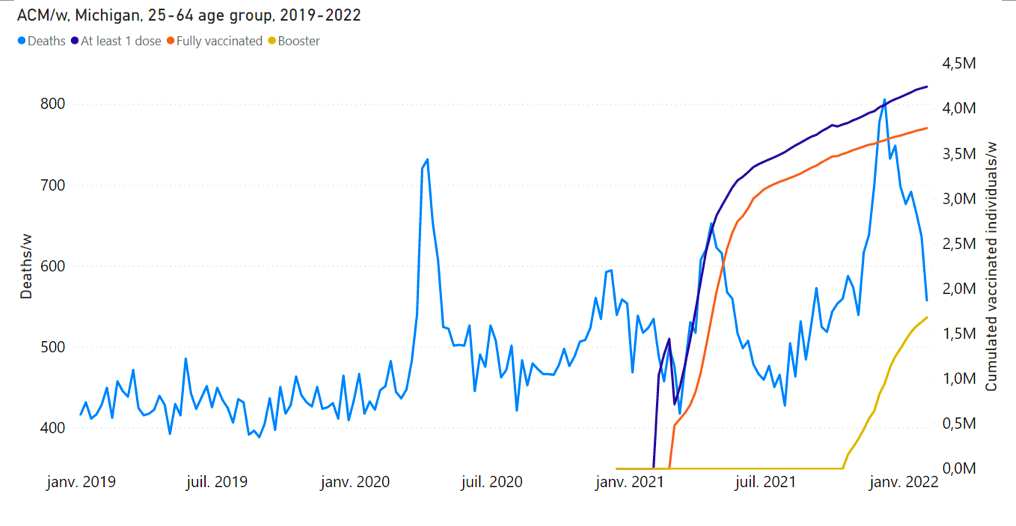
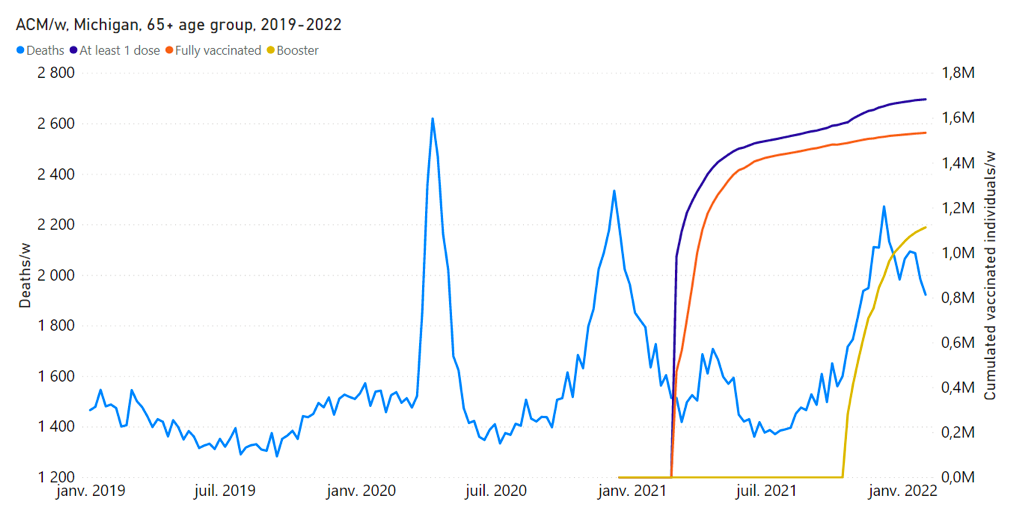
Figure 8: All-cause mortality by week (light-blue), cumulative number of people with at least one dose of vaccine (dark-blue), cumulative number of fully vaccinated people (orange) and cumulative number of people with a booster dose (yellow) by week from 2019 to 2022, and by age group for Michigan, USA. Data are displayed from week-1 of 2019 to week-5 of 2022. Upper panel: (Rancourt et al., 2022; their Figure 11G) Michigan, 25-64 years age group. For the 25-64 years age group, the vaccination data is for the 18-64 years age group. Lower panel: (Rancourt et al., 2022; their Figure 11H) Michigan, 65+ years age group. The discontinuous breaks in cumulative number of vaccinated individuals are artifacts.
A key figure for Ontario, Canada is as follows (Figure 9).
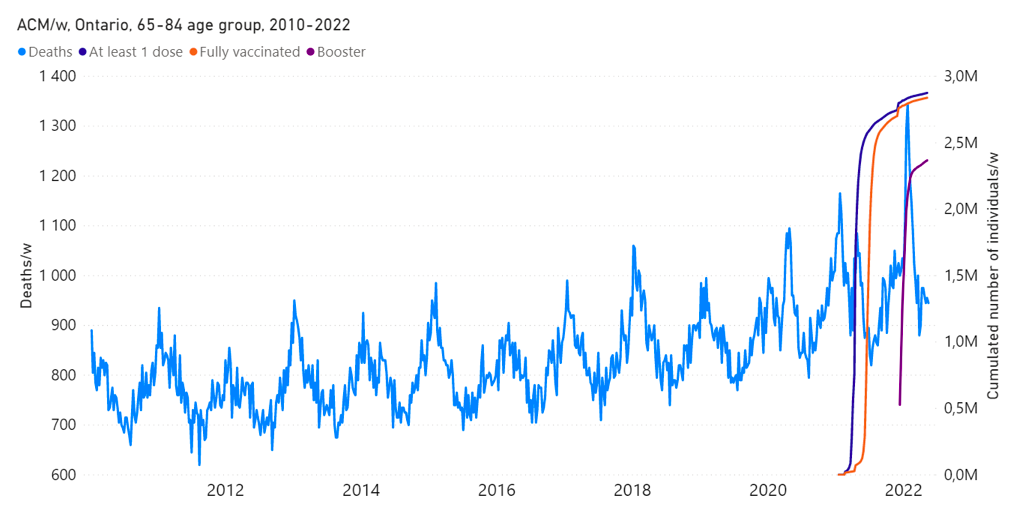
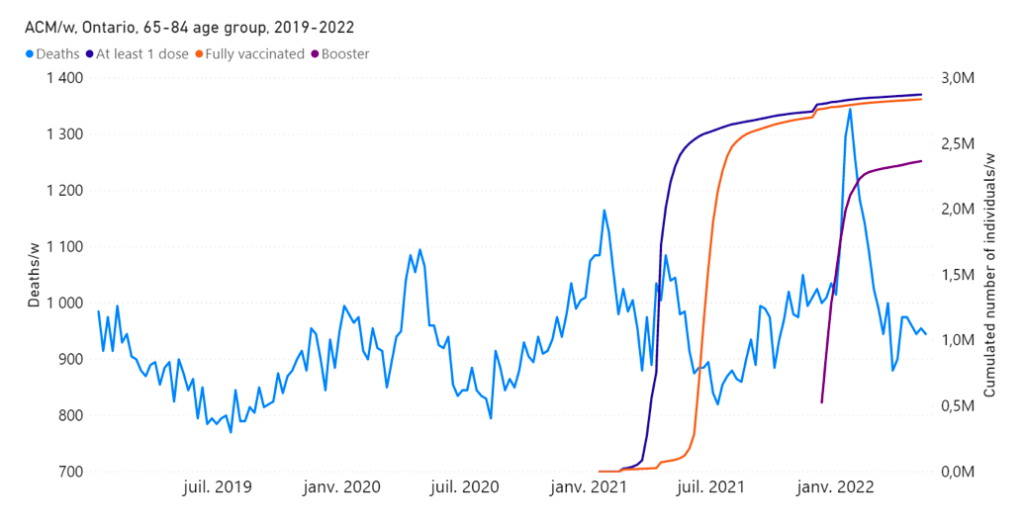
Figure 9: All-cause mortality by week (light-blue), cumulative number of people with at least one dose of vaccine (dark-blue), cumulative number of fully vaccinated people (orange) and cumulative number of people with a booster dose (purple) by week from 2010 to 2022 (upper panel), and from 2019 to 2022 (lower panel), in the province of Ontario, Canada. Both mortality and vaccination are for the age group 65-84 years. (Rancourt et al., manuscript in preparation)
A clear non-seasonal peak is seen in this age group (65-84 years) in Ontario, which is synchronous with the COVID-19 vaccine rollout to this age group (Figure 9); and a particularly large and sharp mortality peak is synchronous with the booster rollout to this age group the following winter season (Figure 9). Here, again, the corresponding COVID-19 vIFRs are comparable in value to that for the vaccination period for Australia (0.05 %).
As further discussion, we make the following observations and comments.
As outlined above, less than and approximately half of the excess deaths of all causes in the vaccination period are deaths registered as COVID-19 deaths. The COVID-19-registered deaths have the following properties (Australian Bureau of Statistics, 2022c):
- Attribution of death “from COVID-19” versus “with COVID-19” is based on a qualitative evaluation susceptible to bias
- 4 % of deaths “from COVID-19” in Australian death certificates had non-COVID-19 “causal sequences of events” and/or “pre-existing chronic conditions”
- The deaths statistics by age and sex are typical of all-cause old-age deaths statistics in Western societies
- The three “most commonly certified acute disease outcomes of COVID-19” were: pneumonia (61.4 %), respiratory failure (15 %), and other infections (11.2 %)
- The three most common pre-existing conditions in certified “with COVID-19” deaths were: chronic cardiac conditions (39.0 %), dementia (30.5 %), and chronic respiratory conditions (17.8 %)
Therefore, it is reasonable to infer that the vaccine injections caused death by providing an additional and significant challenge to already chronically frail or vulnerable subjects, and that COVID-19 itself may not have provided a significant contribution, as we already demonstrated for the Southern states of the USA (Rancourt et al., 2022), and as is apparent for India (Rancourt, 2022).
In this context, and given the “most commonly certified acute disease outcomes of COVID-19”, it is important to note that Australia, like virtually all Western jurisdictions, dramatically reduced its antibiotic prescriptions after a pandemic was declared by the WHO (Gillies et al., 2021; Rancourt et al., 2022). This would mean that, not only were chronically frail residents challenged with the toxic injections, but they may also not have been provided the normal treatments against respiratory bacterial infections.
Finally, we note that there is starting to be some acknowledgement in the mainstream media suggesting that vaccine harm in Australia may be much larger than generally admitted by the medical establishment. The recent public testimony and submission to Parliament of former federal MP and former Australian Medical Association (AMA) president Dr. Kerryn Phelps stands out in this regard (Chung, 2022).
In conclusion, the declared pandemic would have had to entirely spare Australia any detectable deaths for more than a year, while it raged in many other places around the world, before it showed any virulence, suddenly in mid-April 2021, when vaccines coincidentally were being rolled out to the elderly and most vulnerable. In addition, a sharp peak in all-cause mortality (mid-January to mid-February 2022) would be synchronous with the rapid deployment of the vaccine booster (3rd doses) purely by coincidence, without any explanation (plausible or not) being provided.
On the contrary, our analysis leads us to conclude that the excess mortality in the vaccination period (31±1 thousand deaths, mid-April 2021 through August 2022; 14 % larger all-cause mortality than in recent pre-vaccination periods of same time duration; 62 million administered vaccine doses), which is more than twice the deaths registered as from or with COVID‑19, and the sharp peak in all-cause mortality (mid-January to mid-February 2022; 2,600 deaths), which is synchronous with the rapid rollout of the booster (9.4 million booster doses, same time period) are causally associated with the COVID-19 vaccine. We give thirteen numbered arguments as to why we make this conclusion.
The corresponding vaccine injection fatality ratio (vIFR) is approximately 0.05 %, which is intermediate between the value from VAERS for ages 65+ years with the Janssen vaccine in the USA (0.008 %) and the value for India’s vaccine rollout and for Southern states of the USA subjected to “vaccine equity” campaigns (1 %).
Of course, this is diametrically opposite to the proposal that the COVID-19 vaccine would have saved any lives; a proposal that is not substantiated by extensive study of all-cause mortality data (Rancourt et al., 2022).
*
Sources
Australian Bureau of Statistics (2022a): Australian Bureau of Statistics /// “Provisional Mortality Statistics” /// ABS (25 November 2022), accessed 12 December 2022, https://www.abs.gov.au/statistics/health/causes-death/provisional-mortality-statistics/latest-release
Australian Bureau of Statistics (2022b): Australian Bureau of Statistics /// “COVID-19 Mortality by wave” /// ABS (25 November 2022), accessed 16 December 2022, https://www.abs.gov.au/articles/covid-19-mortality-wave.
Australian Bureau of Statistics (2022c): Australian Bureau of Statistics /// “COVID-19 Mortality in Australia: Deaths registered until 31 October 2022” /// ABS (16 November 2022), accessed 16 December 2022, https://www.abs.gov.au/articles/covid-19-mortality-australia-deaths-registered-until-31-october-2022
Australian Government – Department of Health and Aged Care (2021): Department of Health and Aged Care (26 March 2021) /// “COVID-19 vaccination – Disability Priority groups for COVID-19 Vaccination Program: Phase 1b” /// accessed 15 December 2022, https://www.health.gov.au/resources/publications/covid-19-vaccination-disability-priority-groups-for-covid-19-vaccination-program-phase-1b , PDF.
Australian Government – Department of Health and Aged Care (2022): COVID-19 National Incident Centre Surveillance Team /// “Communicable Diseases Intelligence – COVID-19 Australia: Epidemiology Report 65 – Reporting period ending 28 August 2022” /// Department of Health and Aged Care, 2022, Volume 46 (19 September 2022), http://health.gov.au/cdi, https://doi.org/10.33321/cdi.2022.46.57 /// accessed 18 December 2022
Choi et al. (2021): Sangjoon Choi, SangHan Lee, Jeong-Wook Seo, Min-ju Kim, Yo Han Jeon, Ji Hyun Park, Jong Kyu Lee, Nam Seok Yeo /// Myocarditis-induced Sudden Death after BNT162b2 mRNA COVID-19 Vaccination in Korea: Case Report Focusing on Histopathological Findings /// Journal of Korean Medical Science 2021; 36(40): e286.
DOI: https://doi.org/10.3346/jkms.2021.36.e286
Chung (2022): Frank Chung /// Dr Kerryn Phelps reveals ‘devastating’ Covid vaccine injury, says doctors have been ‘censored’: Dr Kerryn Phelps has broken her silence about a “devastating” Covid vaccine injury, slamming regulators for “censoring” public discussion with “threats” to doctors. /// news.com.au (20 December 2022 – 5:59PM),https://www.news.com.au/technology/science/human-body/dr-kerryn-phelps-reveals-devastating-covid-vaccine-injury-says-doctors-have-been-censored/news-story/0c1fa02818c99a5ff65f5bf852a382cf /// Archived: https://archive.vn/svsir
Dhar et al. (2021): Dhar MS, Marwal R, Vs R, Ponnusamy K, Jolly B, Bhoyar RC, Sardana V, Naushin S, Rophina M, Mellan TA, Mishra S, Whittaker C, Fatihi S, Datta M, Singh P, Sharma U, Ujjainiya R, Bhatheja N, Divakar MK, Singh MK, Imran M, Senthivel V, Maurya R, Jha N, Mehta P, A V, Sharma P, Vr A, Chaudhary U, Soni N, Thukral L, Flaxman S, Bhatt S, Pandey R, Dash D, Faruq M, Lall H, Gogia H, Madan P, Kulkarni S, Chauhan H, Sengupta S, Kabra S; Indian SARS-CoV-2 Genomics Consortium (INSACOG)‡, Gupta RK, Singh SK, Agrawal A, Rakshit P, Nandicoori V, Tallapaka KB, Sowpati DT, Thangaraj K, Bashyam MD, Dalal A, Sivasubbu S, Scaria V, Parida A, Raghav SK, Prasad P, Sarin A, Mayor S, Ramakrishnan U, Palakodeti D, Seshasayee ASN, Bhat M, Shouche Y, Pillai A, Dikid T, Das S, Maitra A, Chinnaswamy S, Biswas NK, Desai AS, Pattabiraman C, Manjunatha MV, Mani RS, Arunachal Udupi G, Abraham P, Atul PV, Cherian SS. /// Genomic characterization and epidemiology of an emerging SARS-CoV-2 variant in Delhi, India. /// Science. 2021 Nov 19;374(6570):995-999. doi: 10.1126/science.abj9932. Epub 2021 Oct 14. PMID: 34648303; PMCID: PMC7612010. https://doi.org/10.1126/science.abj9932
Gill et al. (2022): James R. Gill, Randy Tashjian, Emily Duncanson /// Autopsy Histopathologic Cardiac Findings in 2 Adolescents Following the Second COVID-19 Vaccine Dose. /// Arch Pathol Lab Med 1 August 2022; 146 (8): 925–929. doi: https://doi.org/10.5858/arpa.2021-0435-SA
Gillies et al. (2021): Gillies, MB, Burgner, DP, Ivancic, L, et al. /// Changes in antibiotic prescribing following COVID-19 restrictions: Lessons for post-pandemic antibiotic stewardship. /// Br J Clin Pharmacol. 2022; 88( 3): 1143- 1151. https://doi.org/10.1111/bcp.15000
Hasegawa and Nemoto (2016): Hasegawa, Takehisa and Nemoto, Koji /// Outbreaks in susceptible-infected-removed epidemics with multiple seeds /// Phys. Rev. E, 93(3), pages = {032324}, numpages = {10}, year = {2016}, month = {Mar}, publisher = {American Physical Society}, doi = {10.1103/PhysRevE.93.032324}, https://link.aps.org/doi/10.1103/PhysRevE.93.032324
Hickey and Rancourt (2022): Hickey, J. and Rancourt, D.G. /// Nature of the toxicity of the COVID-19 vaccines in the USA /// ResearchGate [Preprint] (9 February 2022). Available at: https://www.researchgate.net/publication/358489777_Nature_of_the_toxicity_of_the_COVID-19_vaccines_in_the_USA /// Archived at: https://archive.ph/LZpRj
Ma et al. (2022): Ma C, Li X, Zhao Z, Liu F, Zhang K, Wu A, Nie X. /// Understanding Dynamics of Pandemic Models to Support Predictions of COVID-19 Transmission: Parameter Sensitivity Analysis of SIR-Type Models /// IEEE J Biomed Health Inform., 2022, Jun; 26(6): 2458-2468. doi: 10.1109/JBHI.2022.3168825. Epub 2022 Jun 3. PMID: 35452393; PMCID: PMC9328724. https://doi.org/10.1109/jbhi.2022.3168825
Mörz (2022): Mörz, M. A /// Case Report: Multifocal Necrotizing Encephalitis and Myocarditis after BNT162b2 mRNA Vaccination against COVID-19. /// Vaccines 2022, 10, 1651. https://doi.org/10.3390/vaccines10101651
Parham and Michael (2011): Paul E. Parham, Edwin Michael /// Outbreak properties of epidemic models: The roles of temporal forcing and stochasticity on pathogen invasion dynamics /// Journal of Theoretical Biology, Volume 271, Issue 1, 2011, Pages 1-9, ISSN 0022-5193, https://doi.org/10.1016/j.jtbi.2010.11.015 .
Rancourt (2022): Rancourt, DG /// Probable causal association between India’s extraordinary April-July 2021 excess-mortality event and the vaccine rollout /// Correlation Research in the Public Interest, 5 December 2022 /// https://correlation-canada.org/report-probable-causal-association-between-indias-extraordinary-april-july-2021-excess-mortality-event-and-the-vaccine-rollout/
Rancourt et al. (2022): Rancourt, D.G., Baudin, M. and Mercier, J. /// COVID-Period Mass Vaccination Campaign and Public Health Disaster in the USA: From age/state-resolved all-cause mortality by time, age-resolved vaccine delivery by time, and socio-geo-economic data /// Research Gate (2 August 2022) /// https://www.researchgate.net/publication/362427136_COVID-Period_Mass_Vaccination_Campaign_and_Public_Health_Disaster_in_the_USA_From_agestate-resolved_all-cause_mortality_by_time_age-resolved_vaccine_delivery_by_time_and_socio-geo-economic_data /// Also available at: https://vixra.org/abs/2208.0023
Schneider et al. (2021): Schneider, J., Sottmann, L., Greinacher, A. et al. /// Postmortem investigation of fatalities following vaccination with COVID-19 vaccines. /// Int J Legal Med 135, 2335–2345 (2021). https://doi.org/10.1007/s00414-021-02706-9
Schwab et al. (2022): Schwab, C., Domke, L.M., Hartmann, L. et al. /// Autopsy-based histopathological characterization of myocarditis after anti-SARS-CoV-2-vaccination. /// Clin Res Cardiol (2022). https://doi.org/10.1007/s00392-022-02129-5
Sessa et al. (2021): Sessa, F.; Salerno, M.; Esposito, M.; Di Nunno, N.; Zamboni, P.; Pomara, C. /// Autopsy Findings and Causality Relationship between Death and COVID‑19 Vaccination: A Systematic Review. /// J. Clin. Med. 2021, 10, 5876. https://doi.org/10.3390/jcm10245876
United Nations (2022): United Nations data /// “Deaths by month of death” /// UN (11 August 2022), accessed 2 December 2022, https://data.un.org/Data.aspx?d=POP&f=tableCode%3A65
Yoshimura et al. (2022): Yukihiro Yoshimura, Hiroaki Sasaki, Nobuyuki Miyata, Kazuhito Miyazaki, Koji Okudela, Yoko Tateishi, Hiroyuki Hayashi, Ai Kawana-Tachikawa, Hiromichi Iwashita, Kazuho Maeda, Yoko Ihama, Yasuyoshi Hatayama, Akihide Ryo, Natsuo Tachikawa /// An autopsy case of COVID-19-like acute respiratory distress syndrome after mRNA-1273 SARS-CoV-2 vaccination /// International Journal of Infectious Diseases 121 (2022) 98–101, https://doi.org/10.1016/j.ijid.2022.04.057
Notes
[1] Cumulative COVID-19 vaccine doses administered: All doses, including boosters, are counted individually; administered 14 April 2021 through 25 August 2022, 63.01M – 1.36M = 62M. Our World in Data, accessed 16 December 2022: https://ourworldindata.org/explorers/coronavirus-data-explorer?facet=none&Interval=Cumulative&Relative+to+Population=false&Color+by+test+positivity=false&country=~AUS&Metric=Vaccine+doses
[2] Estimated using cumulative COVID-19 vaccine doses administered: All doses, including boosters, are counted individually; administered 8 January 2022 through 21 February 2022, 53.4M – 44.0M = 9.4M. Our World in Data, accessed 16 December 2022: https://ourworldindata.org/explorers/coronavirus-data-explorer?facet=none&Interval=Cumulative&Relative+to+Population=false&Color+by+test+positivity=false&country=~AUS&Metric=Vaccine+doses
Featured image is from Children’s Health Defense
Appendix 1: Step-wise increase in all-cause mortality occurs in mid-April 2021 in all the states in Australia
Here, we show the all-cause mortality data for Australia and for each state of Australia (as labelled in the panels of Figure A1-F1), and including the 72-week vaccination period integrations, described in the present article.
We also provide the following table of corresponding vaccine-period excess mortalities.
Table A1-T1: Integrated all-cause mortality (72 weeks), differences and ratios
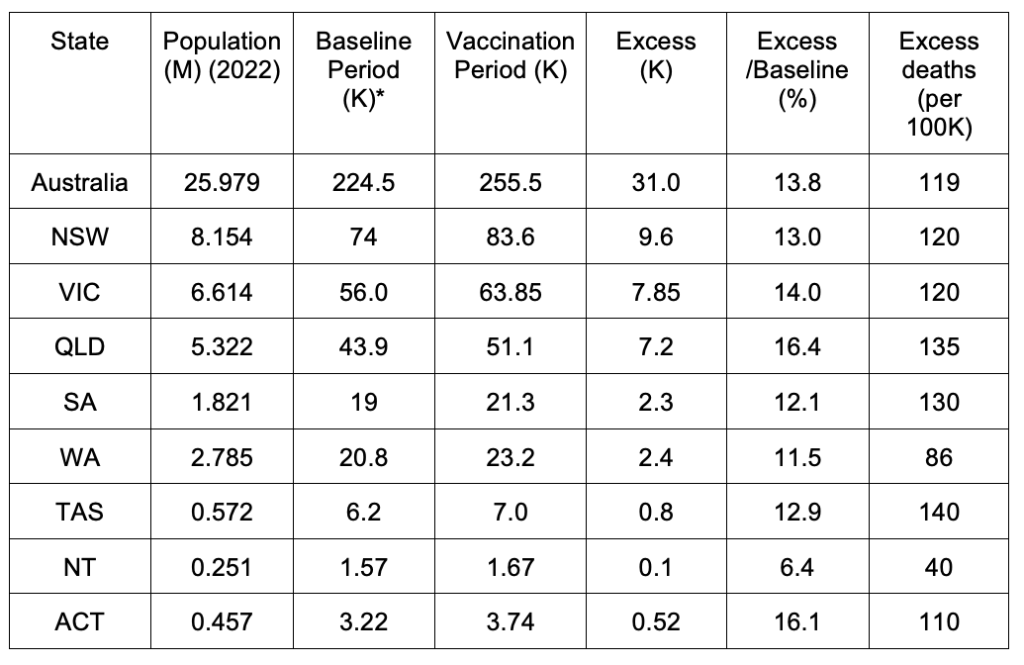
*The baseline-period 72-week-integrated mortality was estimated from an inspection of the values on the graphs (Figure A1-F1) for periods prior to the vaccination period, in such a way as to be representative of the value that would be predicted in the absence of the vaccination campaign and its effects.
Figure A1-F1 (containing 9 panels) follows.
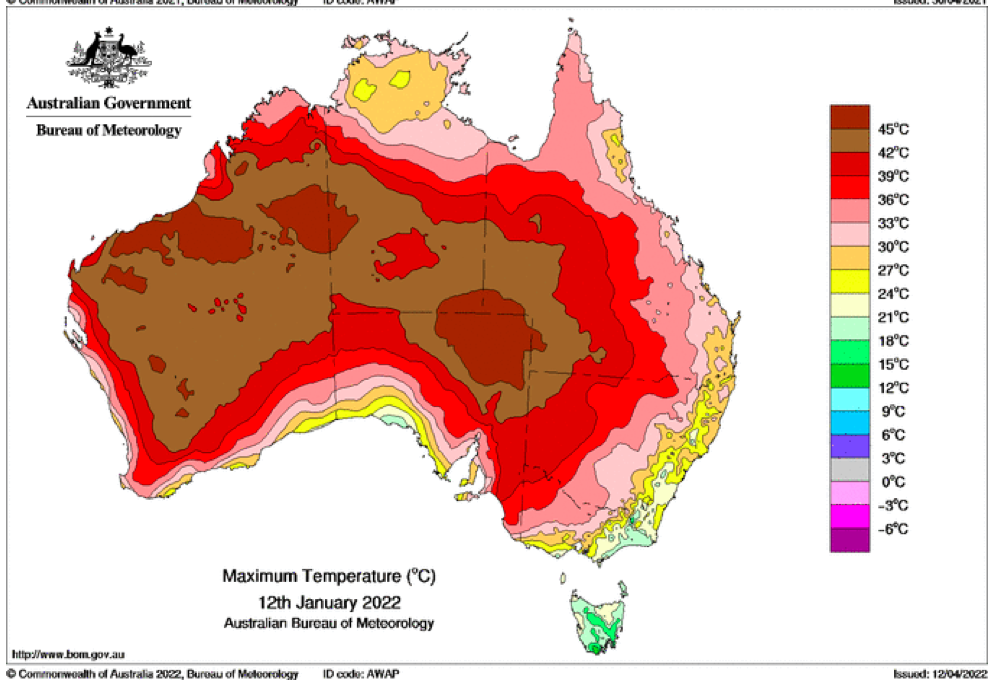
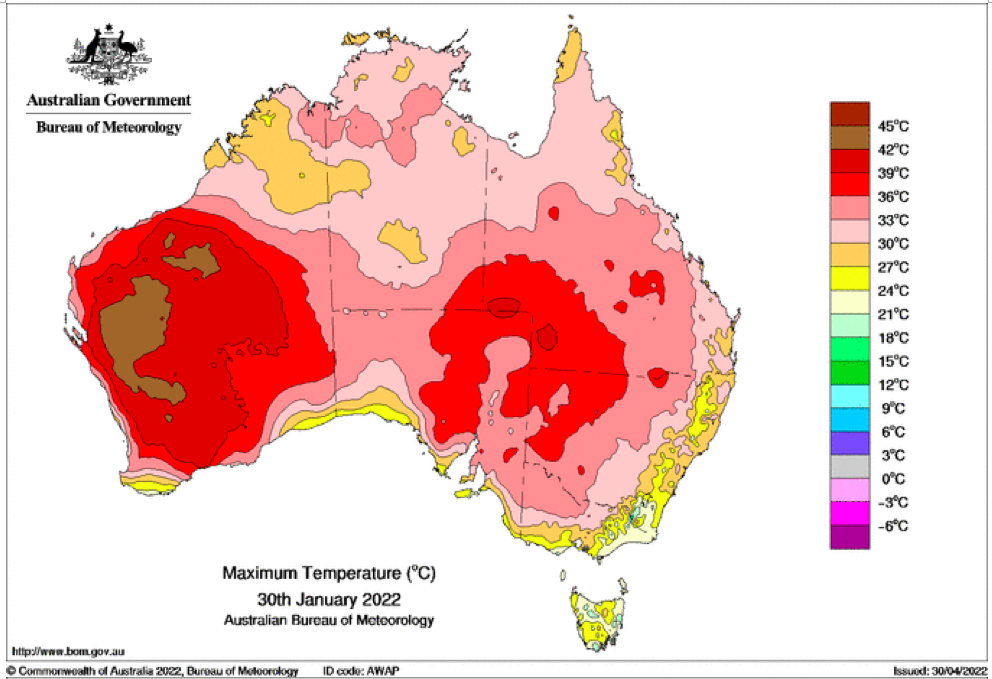
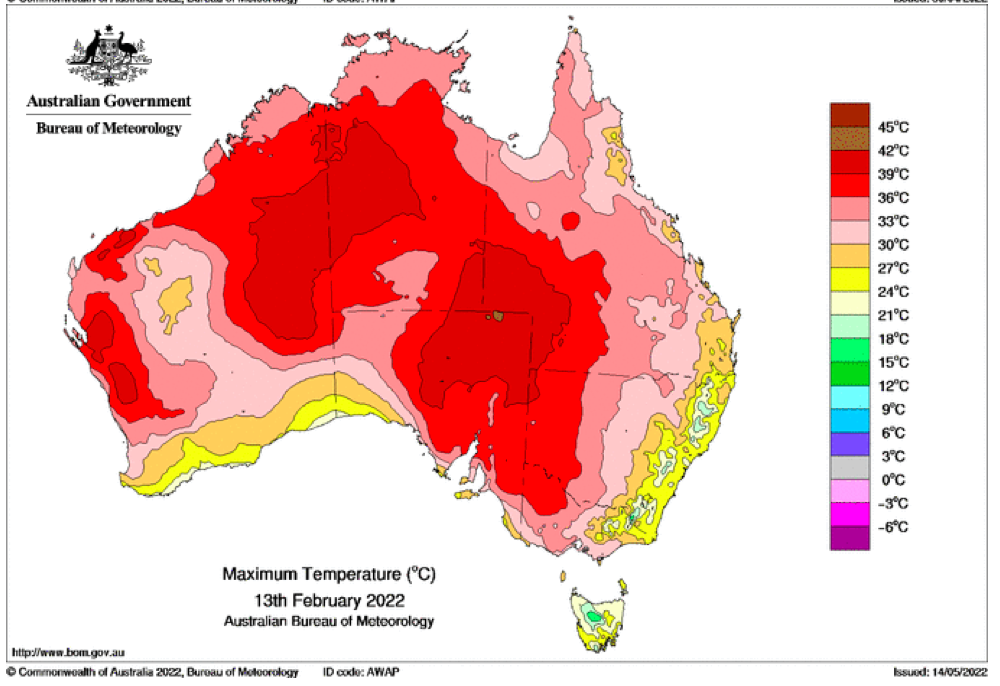
APPENDIX 2: Mid-January to mid-February 2022 mortality peak not caused by a heatwave
This appendix is concerned with the question of whether the mid-January to mid‑February 2022 prominent peak in all-cause mortality in Australia (occurring in NSW, VIC and QLD; see Appendix 1) can be due to a climatic heatwave.
It is important to address this question because sharp all-cause mortality peaks are often associated with exceptional summer heatwaves in mid-latitude countries (e.g. Rancourt et al., 2022, cited in the present article).
The most important heatwave to affect Eastern Australia over more than the last three decades was in 2009. The government report [Australian Government – Bureau of Meteorology, Special Climate Statement 17: The exceptional January-February 2009 heatwave in south-eastern Australia (issued 4 February 2009, updated 12 February 2009), http://www.bom.gov.au/climate/current/statements/scs17d.pdf , accessed 18 December 2022] describes it this way:
“An exceptional heatwave affected south-eastern Australia during late January and early February 2009. The most extreme conditions occurred in northern and eastern Tasmania, most of Victoria and adjacent border areas of New South Wales, and southern South Australia, with many records set both for high day and night time temperatures as well as for the duration of extreme heat.
There were two major episodes of exceptional high temperatures, from 28-31 January and 6-8 February, with slightly lower but still very high temperatures persisting in many inland areas through the period in between.”
This exceptional 2009 heatwave did not cause any significant peak in all-cause mortality, as shown in Figure A2-F1, below. In fact, heatwaves essentially do not cause peaks in all-cause mortality in Australia, presumably because it’s always hot in the summers. Figure A2-F1 does not show any peaks, 1980-2022, which could be interpreted as summer heatwave peaks.
Also, there are no Australian Government, Bureau of Meteorology, Special Climate Statements (SCSs) 2006-2022, which can be interpreted to be associated with or similarly associated to the mid-January to mid‑February 2022 prominent peak in all‑cause mortality occurring in Eastern Australia (NSW, VIC, QLD) (see Appendix 1). See the list of SCSs here: http://www.bom.gov.au/climate/current/statements/ . Archived on 18 December 2022 here: https://archive.vn/WDlPA
And the Australian Government, Bureau of Meteorology, “Monthly Weather Review, Australia, January 2022” report [Product code IDCKGC1AR1. Prepared on 27 April 2022. http://www.bom.gov.au/climate/mwr/aus/mwr-aus-202201.pdf ] makes no mention of any climate or weather event that could be associated with the mid-January to mid‑February 2022 prominent peak in all-cause mortality occurring in Eastern Australia (NSW, VIC, QLD).
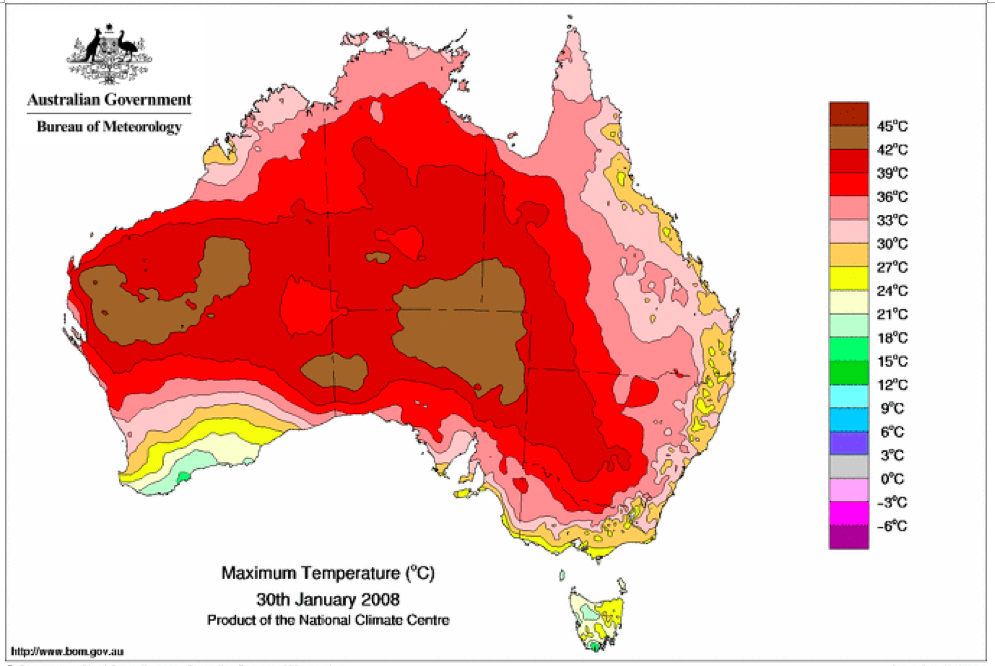
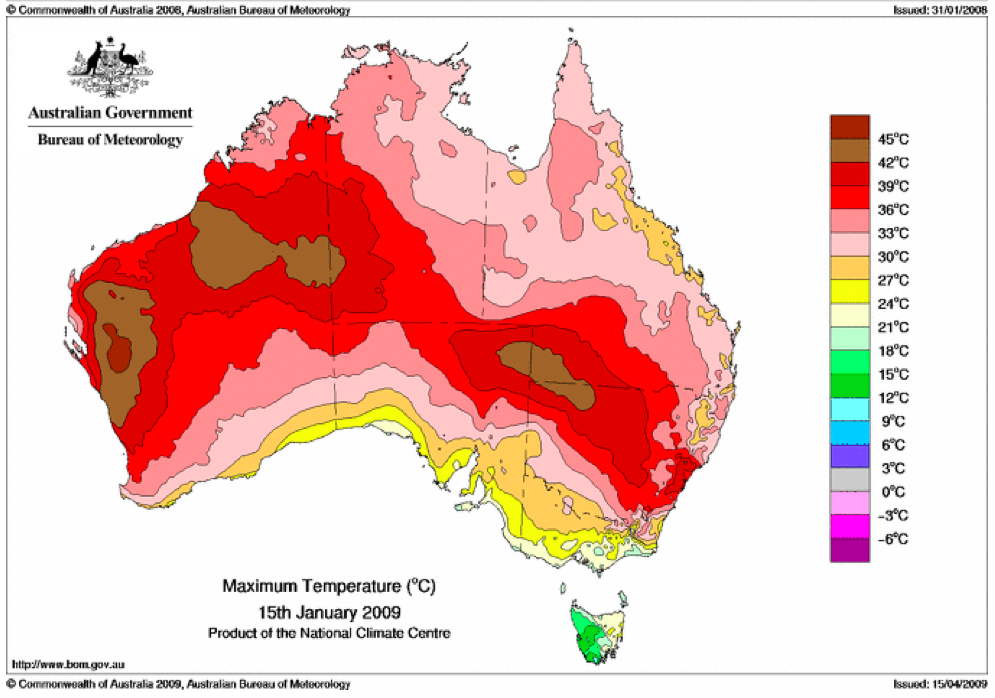
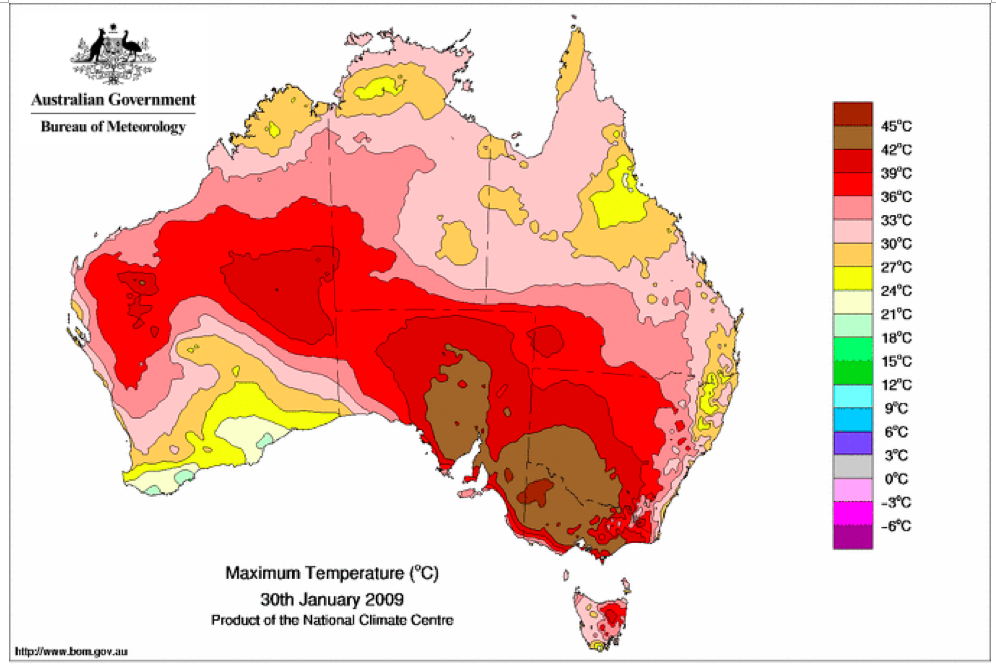
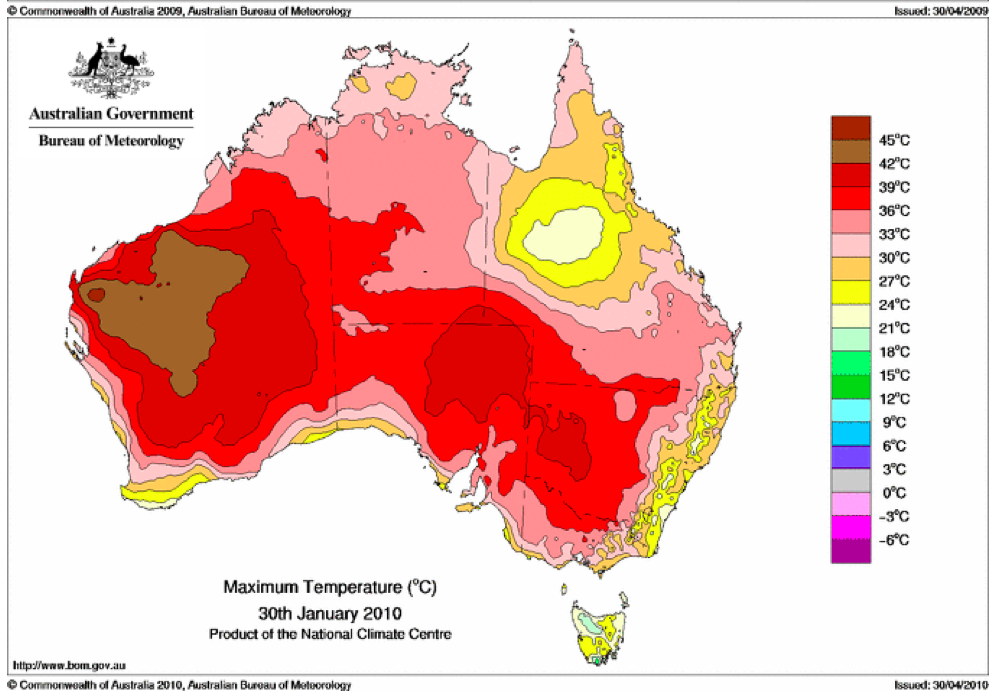
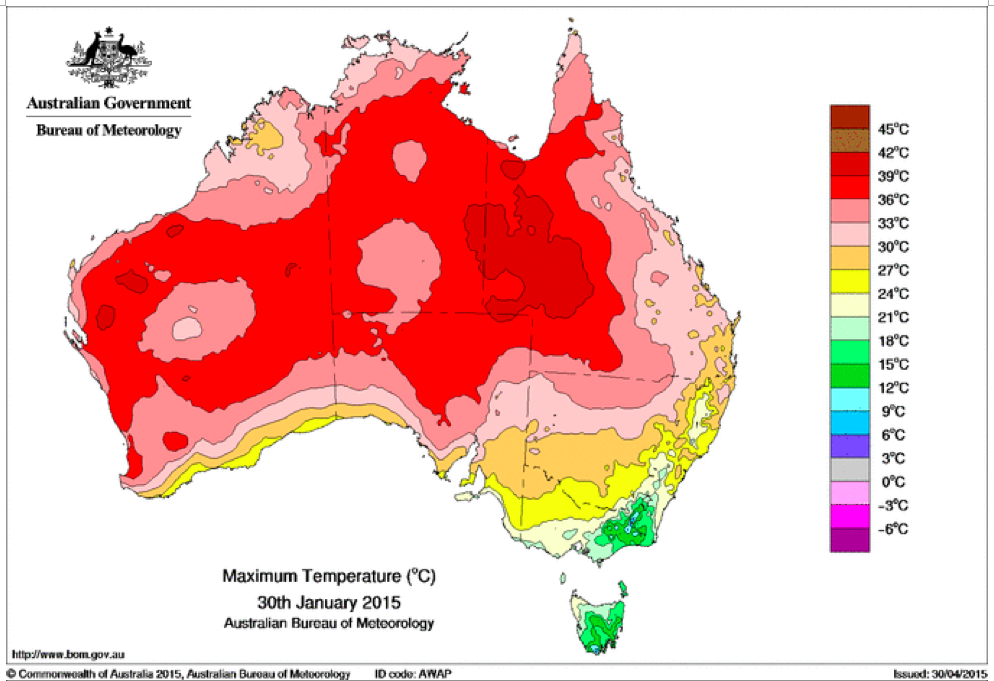
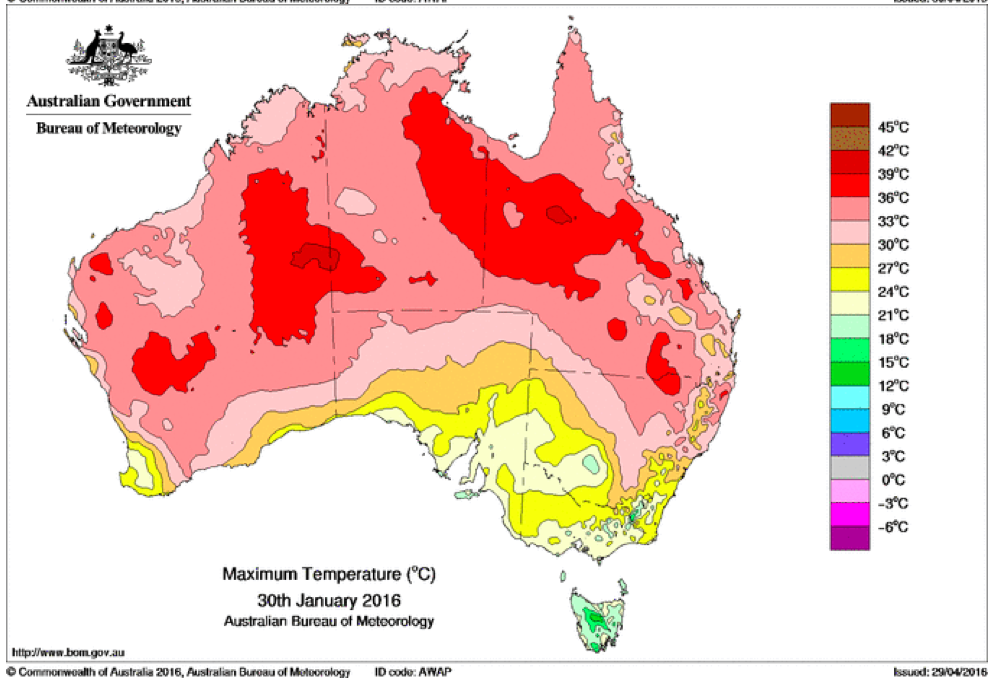
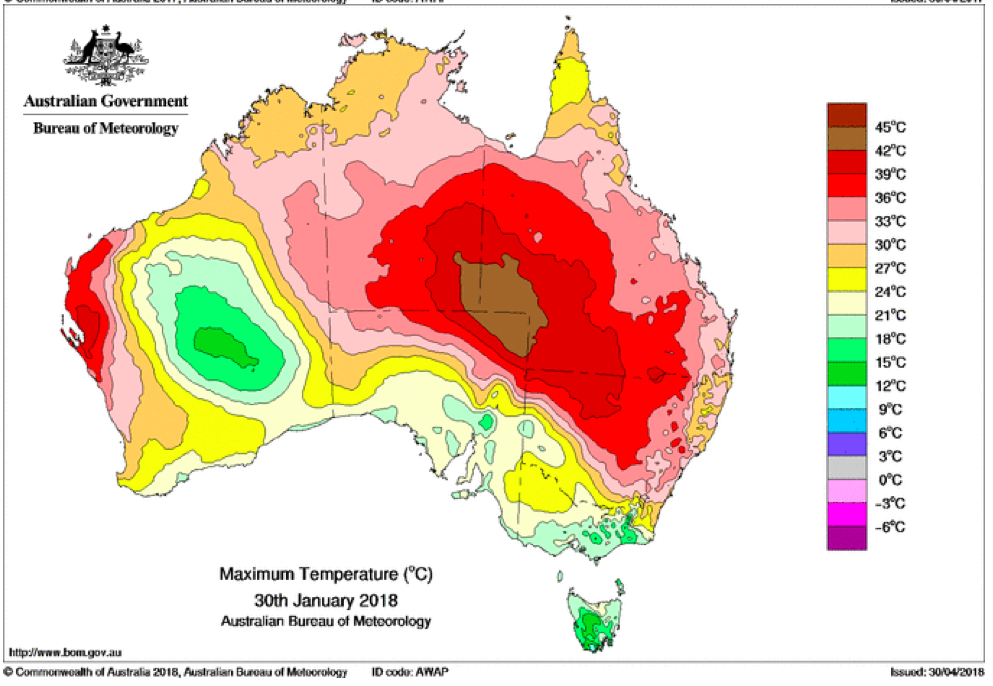
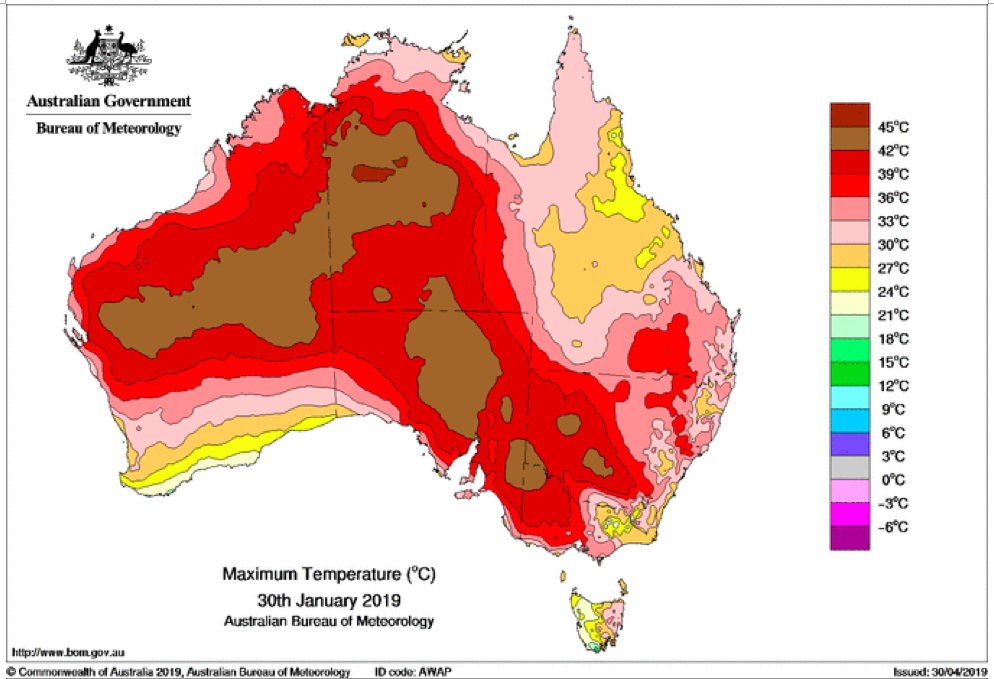
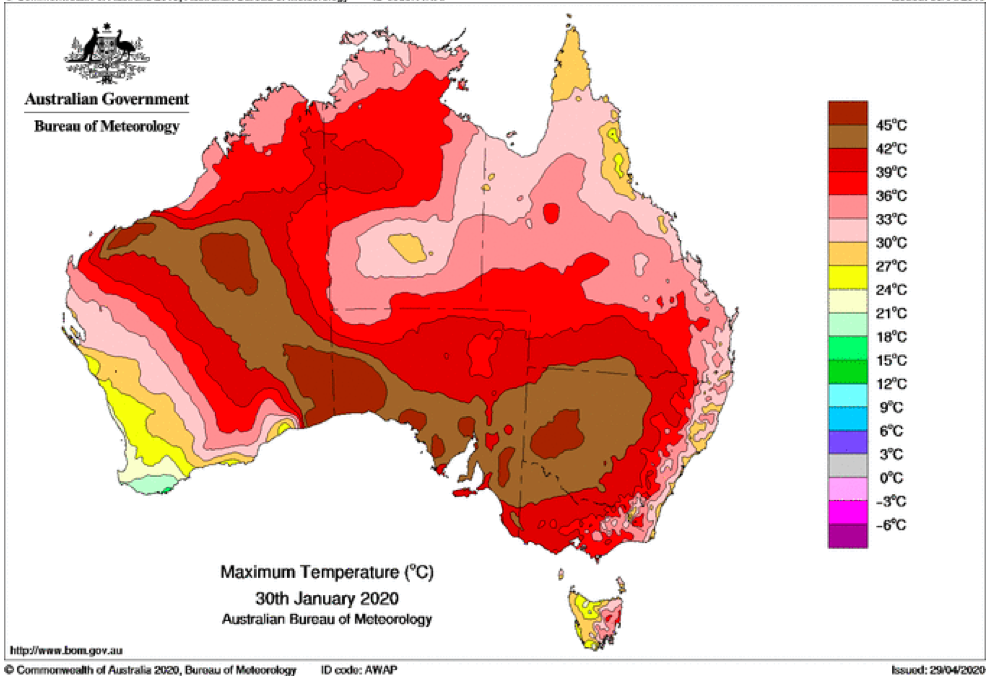
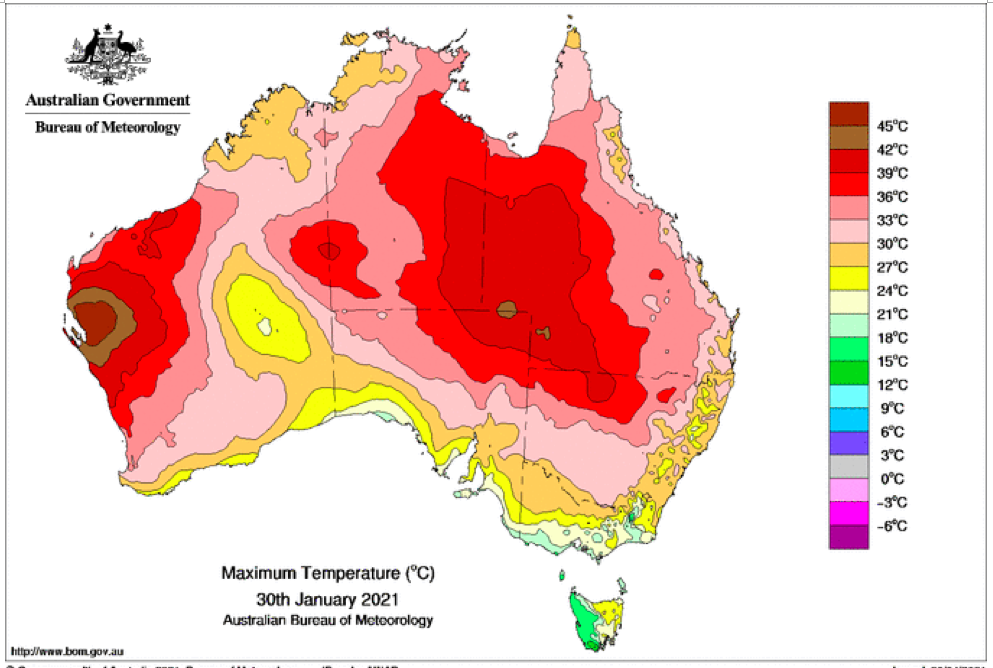
That the 2022 all-cause mortality peak of concern is not due to a heatwave is again corroborated by the fourteen maximum daily temperature maps for Australia shown below, for the years and dates as indicated on the maps.
[Source: http://www.bom.gov.au/climate/ . Specifically: http://www.bom.gov.au/jsp/awap/temp/rmse_archive.jsp?map=maxave&period=daily&year=2022&month=1&day=12 ]
The mid-January to mid‑February 2022 prominent peak in all-cause mortality occurring in Eastern Australia (NSW, VIC, QLD) (see Appendix 1) — seen in Figure A2-F1 and in Figures 1, 2, 4A and 6 of the present article — is not due to any climate, weather or temperature event or anomaly.
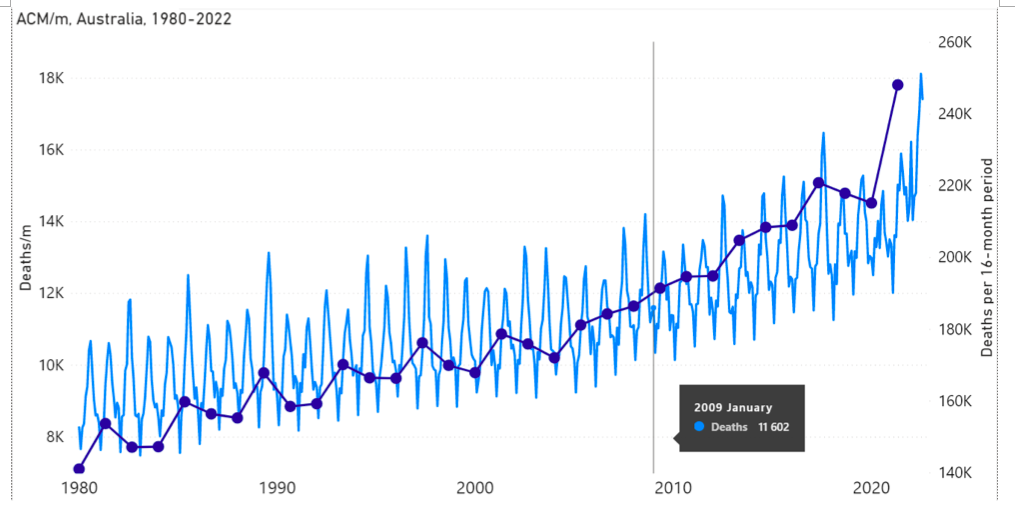
Figure A2-F1: All-cause mortality in Australia, all ages, from January 1980 through August 2022. Light-blue: All-cause mortality by month, left y-scale. Dark-blue: Integrated all-cause mortality over successive and non-overlapping 16-month periods (May 2021 through August 2022, for most recent period), right y-scale. Each point is positioned on the x-axis at the 1st month of its 16-month integration period. The labelled vertical line shows January 2009, which had a record-breaking heatwave and virtually no associated increase in mortality. February has lower mortality because it generally has only 28 days. (Data source: Australian Bureau of Statistics (2022a) for 2015-2022; United Nations (2022) for 1980-2014.)
 The Worldwide Corona Crisis, Global Coup d’Etat Against Humanity
by Michel Chossudovsky
Michel Chossudovsky reviews in detail how this insidious project “destroys people’s lives”. He provides a comprehensive analysis of everything you need to know about the “pandemic” — from the medical dimensions to the economic and social repercussions, political underpinnings, and mental and psychological impacts.
“My objective as an author is to inform people worldwide and refute the official narrative which has been used as a justification to destabilize the economic and social fabric of entire countries, followed by the imposition of the “deadly” COVID-19 “vaccine”. This crisis affects humanity in its entirety: almost 8 billion people. We stand in solidarity with our fellow human beings and our children worldwide. Truth is a powerful instrument.”
ISBN: 978-0-9879389-3-0, Year: 2022, PDF Ebook, Pages: 164, 15 Chapters
Price: $11.50 Get yours for FREE! Click here to download.
We encourage you to support the eBook project by making a donation through Global Research’s DonorBox “Worldwide Corona Crisis” Campaign Page.