Inflation is Increasing in America. Latest Consumer Price Index (CPI) Report: The ‘Soft Landing’ Plane Is Still Circling.


All Global Research articles can be read in 51 languages by activating the Translate Website button below the author’s name (only available in desktop version).
To receive Global Research’s Daily Newsletter (selected articles), click here.
Click the share button above to email/forward this article to your friends and colleagues. Follow us on Instagram and Twitter and subscribe to our Telegram Channel. Feel free to repost and share widely Global Research articles.
Big Tech’s Effort to Silence Truth-tellers: Global Research Online Referral Campaign
***
For months the mainstream media and Washington Pols have been pushing the metaphor that the US economy is a plane on its final approach to a ‘soft landing’. Soft landing is defined as inflation steadily coming down to the Federal Reserve’s goal of a 2% price level AND does so without provoking a recession.
However, as revealed by the inflation statistics in the US Labor Department’s latest Consumer Price Index (CPI), the ‘soft landing’ plane is clearly stuck circling the airport!
The government’s just released January 2024 Consumer Price Index report shows not only that prices are stuck at a level (i.e. ‘circling’?) where they’ve been since last summer 2023, but January’s CPI report shows signs of prices even beginning to rise once again.
Moreover, if one lifts some of the questionable assumptions and methodologies used to estimate inflation in the CPI, inflation may be even higher than officially reported. Perpetually circling for months, the soft landing plane may even be running out of gas.
The CPI is one of several government price indices. The other two are the Personal Consumption Expenditures (PCE) index and the GDP Deflator Index. These latter are produced by the Commerce Department. The PCE typically estimates inflation only two thirds to three fourths the price level provided by the CPI, using different assumptions and methodologies than the CPI.
Having said that, let’s look at the January CPI report (after which Part 2 of this article will show why even the CPI undershoots inflation and why the PCE and GDP Deflator undershoot even more).
January 2024 Consumer Price Index
The CPI slices and dices inflation in many ways. Its aggregate number is called the All Items CPI-U. It’s the summary of price changes for all the goods and services estimated by the CPI. All means around 450 or so of the most often purchased by households. There are literally millions of goods and services in the US economy but households’ budgets are almost totally spent on the CPI’s 450 or so ‘basket of goods and services’ that are mostly purchased by households.
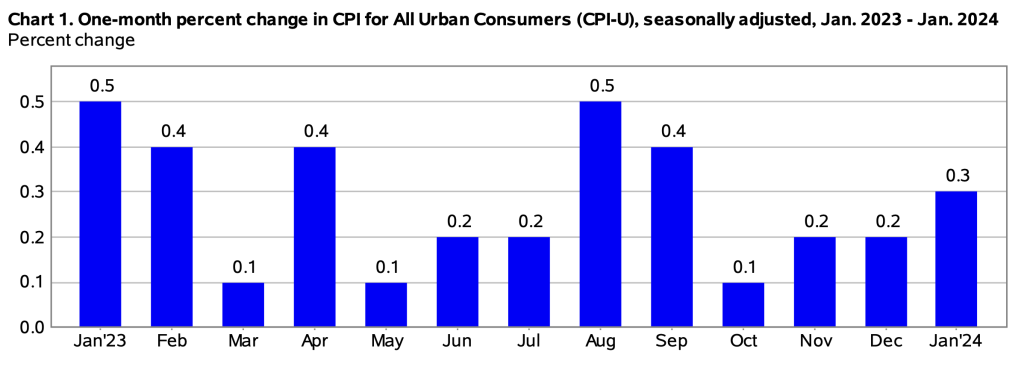
Source: Bureau of Labor Statistics
The All Items category is then broken down into what’s called ‘Headline’ inflation and ‘Core’ inflation. Since food and energy (i.e. gasoline, natural gas, electricity, fuel oil, groceries, food at home, food away from home, etc.) are goods that tend to fluctuate a lot, subtracting food and energy from All Items results in what’s called ‘Core’ inflation. Add back in food and energy goods and that’s ‘Headline’ inflation.
Another important break down of ‘All Items’ is Goods vs. Services inflation. The Goods sector of the economy is roughly 20% of GDP (Construction—residential and commercial—is about 8% of GDP and Manufactured goods about 12%). All the rest (80%) of the US economy is Services. So Services contributes a bigger part of the overall CPI and inflation.
So what does the latest January 2024 CPI report show us for ‘All Items’, ‘Headline’, ‘Core’ and the important sub-categories of Goods vs. Services inflation?
The most important takeaway from the January CPI is the ‘All Items’ rate of inflation last month is at the same level that it was seven months ago in June 2023—that is, inflation continued to rise at the same 3% annual rate of change in January 2023 that it was in June 2023!
To continue the ‘soft landing’ metaphor, what that means is the Inflation plane had entered its ‘downward leg’ from January 2022 to January 2023, slowing from a 7.5% annual rate increase at the start of 2022 to 6.4% a year later in January 2023. It then slowed further the following six months from January 2023 to June 2023, from the 6.4% to 3%.
Thereafter, since last June 2023, it has plateaued at a 5,000 foot level above the US economy airport, where it’s been circling ever since.
Peeling the onion of the ‘All Items’ aggregate indicator, and considering just ‘Core’ inflation—i.e. ‘All Items’ minus energy and food prices—It’s a similar picture: Core inflation has also been stuck, at around 3.9%-4% since October 2023.
Slicing ‘All Items’ yet another way, into Goods vs. Services inflation what the latest January CPI stats further reveal is that since October 2023 Services inflation has also been stuck, in this case in roughly the 5% range.
In other words, except for gasoline and some food prices, the CPI has not slowed in the last seven months. The plane has not landed but just keeps circling!
And it may be running out of gas as well. The latest CPI stats, on a month to month change basis, suggest the rate of inflation may now have started to rise again last month. Unadjusted for seasonality (i.e. the actual price changes), January’s CPI stats show a month to month rising trend for the CPI as follows:
- October 2023: 0.0%
- November 2023: -0.2%
- December 2023: -.0.1%
- January 2024: +0.5%
Within the January numbers were some worrisome trends: Services inflation nearly doubled in January compared to December (0.7% vs 0.4%); food prices did double (0.4% vs 0.2%) with grocery prices rising the fastest in the entire previous twelve months. Meanwhile shelter costs rose from 0.4% to 0.6% for January with its biggest component, Rent, rising the fastest in nine months. And other services like hospital and airlines, the prices of which had slowed in 2023, surged again in January.
Forces pointing to higher gasoline and energy Goods inflation in the coming months are appearing as well. The business media in US and abroad report that global crude oil supply problems are mounting—at a time when typically in the spring oil refineries also shut down for maintenance and consumers begin to drive more.
The Goods vs. Services Inflation Conundrum
To sum up thus far: if CPI reports for the past seven months show Services prices are stuck at 5%, Core prices at around 4%, and All Items stuck at 3%. Those numbers suggests Goods prices—gasoline and some food prices—have indeed come down. The January CPI report shows that Goods prices have been either flat or slightly negative over the past twelve months.
But Services inflation remains stuck at around 5% for months now. The main culprits in continuing Services inflation have been Rent services which have consistently been responsible more than half of all the CPI services price increases for several months; Day Care services; Sporting and Entertainment events prices; Auto Repairs; and Auto Insurance services which have risen by 20.6% over the past year. In addition, hospital services costs are now surging anew and rising at the fastest rate since 2015.
So why have Goods (especially gas and food) inflation significantly abated over the past year while the Services price level has barely done so?
There are several explanations. Here’s a couple:
Fed Interest Rates Are Increasingly Inefficient
Federal Reserve interest rate hikes since 2022 have clearly had an effect on Goods inflation—i.e. on energy and food and some other commodities. But so may have other economic forces.
The US economy has slowed due to rate hikes. But so has the global economy slowed. Which has had more impact on dampening demand for oil, commodities and thus US energy related goods prices in general? US rate hikes or slowing global economy? And what about food/grocery prices? Prices for milk and eggs surged in 2021-22 but have since come down. However, processed foods like bakery goods and other processed items like juice and beverages have not. They’re still rising at more than 20% annual rate? The difference likely lies in the fact that milk and eggs are produced locally and are not monopolistic; processed foods are monopolistic and dominated by a handful of companies. That strongly suggests corporate price gouging is going on in the processed foods sector of food prices. Recent media and government are now also talking about ‘shrinkflation’ (a hidden price hike by lowering content) which suggests evidence of processed food corporations’ price gouging as well.
2021-22: Supply Driven Inflation
The big problem in Goods inflation that emerged initially back in 2021 was domestic US and global ‘supply chains’. As this writer discussed back then (see my ‘The Anatomy of Inflation’ Counterpunch article of June 23, 2022), what drove inflation to its 9.1% peak were mostly Supply side forces—i.e. supply chains exacerbated by price gouging by monopolistic US corporations jacking up prices as the US economy reopened in the summer of 2021 from the Covid shutdowns. That’s a topic to which mainstream economists and politicians have paid too little attention of late.
Productivity also collapsed in 2021-22 falling to the worse levels since 1947, which in turn raised business unit labor costs that many companies simply passed on to consumers in higher prices. Like supply chains and price gouging, that too was basically a supply matter.
Inflation at the time in 2021-22, in other words, was thus largely supply—not demand—driven.
The Covid shutdown of 2020-21 was a major shock to much of the US economy, especially supply. Workers laid off did not immediately return. Some businesses like railroad companies found it convenient and profitable not to brink all their workers back but to run on more profitable skeleton crews. Other businesses did not immediately or fully ramp up production once the economy began to reopen in the summer of 2021. They at first waited to see if the reopening could be sustained. But once the economy began to successfully reopen by late summer 2021 many services businesses tried to recoup lost revenue by rapidly raising prices (a typical example was the Airlines companies and Hotels which clearly price-gouged consumers with record prices for travel in 2021-22).
The Covid shutdowns restructured labor, product and financial markets in ways still not fully understood by economists or policy makers. Fiscal and monetary stimulus measures in particular did not work very well or efficiently (a topic for another article). A given amount of monetary and fiscal stimulus simply did not produced an expected magnitude of real economic recovery.
A dramatic fact of the past two years US economic recovery has been its tepid growth rate. In 2020-21 the Federal Reserve pumped $5 trillion into the US banking system and directly to investors via its QE program. Congress provided an additional $4 trillion in government spending and tax cuts. That’s $9 trillion in combined stimulus! About twice that provided in 2008-10 What has resulted, in the first two years 2022-23 after the economy reopened in 2021 was a growth rate in GDP terms of a mere 2.1% in 2022 and unimpressive 2.5% in 2023.
In short, a mountain of $9T fiscal-monetary stimulus resulted in a molehill of GDP recovery!
Overlaid on the supply problems that emerged in 2021 and which lingered into 2022 was global commodity prices surging in 2022-23 as a consequence of the Ukraine war and US Russian (and China to lesser extent) sanctions policies and the Ukraine War.
All these factors contributed to the primarily supply side driven inflation of 2021-22. Those supply forces were only partially abated by the demand depressing policies of the Federal Reserve after it began raising rates.
And now since mid-2023 Fed rate hikes have stopped. And with it so too have Services inflation decline. Fed rate hikes to 5.5% appear to have little effect on Services inflation. So how high might interest rates have to go to have an effect? A little history as follows might give some idea.
Volcker’s 1980-82 Solution vs. Powell’s 2022-23
Despite US inflation’s largely supply side character, in 2022 US politicians and the Federal Reserve decided the strategy to address supply side inflation would be to depress consumer demand in the US economy. The Federal Reserve set out to attack consumer demand to dampen inflation. Its main tool was raising interest rates and the Fed commenced in 2022 to raise rates at the rapidest pace in decades. The idea was to create enough unemployment that would reduce wage incomes and thus consumption spending to bring down demand and theoretically prices in turn. In other words: even if the main drivers were Supply side (which the Fed can do nothing about) the strategy was to make households pay the price to abate inflation by depressing household wage incomes and consumption demand. So the Fed raised interest rates to 5.5% over the course of 2022-2023.
After all, the same rate hike to compress demand strategy worked under Reagan in 1981-83 when Paul Volcker was Fed chair. 10%+ annual CPI inflation at the time was lowered via Fed rate hikes that attacked the Goods sector, raised unemployment, and subsequently depressed wage incomes and consumption. It was a demand side approach to price reduction—employed to address a Supply side inflation problem back then as well. Nevertheless it worked. Prices came down, but only after the Fed raised rate to more than 15%! A deep recession in 1982-83 followed the Fed rate hikes of 1980. But that was then. The US economy has changed dramatically since. It doesn’t work that way anymore. Indeed, monetary policy hardly works at all.
As in 1980-82, Powell’s Fed rate hikes in 2022-23 have succeeded in dampening goods prices but have NOT succeeded this time around in bringing down services prices very much, as the CPI data for the past seven months clearly shows. Goods inflation has indeed come down, but services prices remain stuck at levels of last summer 2023 now for months and may be rising once again. So why is it that four decades later monetary policy (rate hikes) has not succeeded as it did in 1980-82 in reducing the price level very much?
In his December 2022 press conference following the Fed’s commencing to raise rates, Fed Chairman Jerome Powell indicated the Fed’s strategy in 2023 would be to continue raising rates. He specifically cited his main goal of bringing Services prices down, adding for that more unemployment was needed in Services in order to lower Services consumption. That was the Fed’s inflation strategy for 2023. But that strategy—and lower Services prices—didn’t happen.
Contradictions of Fed Monetary Policy
Halfway into 2023 Powell stopped raising rates. But why? Why didn’t he continue raising rates and stopped halfway through 2023? There are several possible answers, but as this writer has argued before, perhaps the main reason was the crisis that emerged concurrently in the US regional banking system in March 2023. Raising interest rates even higher would have exacerbated that regional banking crisis. So Powell raised rates for the last time in May-June 2023 after the Regional Bank Crisis erupted that March 2023.
By doing so the Fed decided to trade off reducing Services and Core inflation further in 2023 in order to prevent further exacerbating regional bank instability. Powell apparently has placed his bet on assuming the already 5.5% interest rate level will prove sufficient over time to eventually, if albeit slowly, bring down Services. Thus far it hasn’t. Services sector unemployment and Services consumption has not abated. Powell has lost his bet. Services prices are ‘stuck’ at 5% and Core at around 4% now.
What this scenario suggests is that the US and global economy has changed in fundamental ways since the early 1980s. The US is a much more Services centric economy today compared to forty years ago. Services don’t respond as efficiently to rate hikes. In fact, nor does the economy in general, it appears. To put that in economists’ parlance: Services inflation has become ‘interest rate inelastic’.
That lack of real economy response to interest rates (i.e. the inelasticity) may be due in part to the US economy becoming more ‘financialized’ today compared to 1981-83. What that means is Fed periodic liquidity (aka money) injections into the economy get redirected from going into real investment and flow relatively more into financial asset markets instead of the real economy. That makes Fed rate policy ‘inefficient’—i.e. more monetary injection is required to get an equivalent stimulus ‘bang for the buck’.
The converse is also true: Fed rate hikes have less effect on dampening inflation and slowing the real economy because it has become more financialized. Rate hikes simply don’t retract as much liquidity (money) from the economy as they used to. And even if they did it wouldn’t matter. Businesses (and consumers) today, fort years later, have access to alternative sources of funds besides bank lending, in the US and worldwide. Or perhaps businesses and investors cut back on investing in the real economy first, before they consider reducing their investing in financial markets. After all, didn’t financial markets and profits boom during Covid while opportunities for investing in the real economy collapse?
The preceding paragraph suggests globalization may also be resulting in less effective Federal Reserve interest rate policy when it comes to rate hikes dampening inflation. Here financialization and globalization of the 21st century capitalist economy overlap.
Multinational corporations in particular aren’t limited by Fed interest rate hikes or levels when they need money capital to invest. They can go anywhere in the world for lower rates. That’s presuming they even bother to borrow from banks at all any more. Multinationals raise far more money by issuing corporate bond debt of their own. And they loaded up on bond issuance in the years of near zero Fed rates from 2009-2018 and then during 2020-21 when the Fed injected $5T more of virtually free money into the banks and directly to investors via QE. Corporations just issued mountains of bond debt prior to Covid that they didn’t even need and then just hoarded the cash throughout the pandemic. Or else redistributed the virtually free Fed money to their stockholders in buybacks and dividends and hoarded their own cash earnings. Once the Fed started raising rates in 2022 those rate hikes were irrelevant for many big businesses. They were flush with unspent cash from issuing bonds or new stock. Only the smallest businesses are impacted any more by Fed rate hikes, or rate cuts for that matter.
Some Conclusions
In conclusion, in terms of inflation, what all this means is Fed chair Powell will have to raise rates much higher than 5.5% if he wants to reduce Services and Core inflation sigsnificantly further. Maybe not as high as Paul Volcker’s 15% in 1981. But higher than the current 5.5% for sure.
However Powell won’t do either so long as Services inflation levels remain stuck at current levels. He’s decided he can live with that level of Services inflation, while betting perhaps rates kept at current levels may yet reduce inflation further over the longer run.
Powell won’t risk higher rates that will certainly exacerbate a regional bank crisis again, which by the way continues to deteriorate slowly and which now faces the threat of commercial property defaults coming in 2025-26, to which already unstable regional banks remain highly exposed.
He also won’t raise rates because the US economy is teetering on the brink of recession already. The US construction sector has fallen one-third and appears stuck at that level while the manufacturing sector has been contracting for the last nine months, according to the Purchasing Managers’ Index (PMI). A deeper recession in 2024 would certainly not help the politicians. And regardless what apologists for the Fed say, Fed policies are politically a-tuned in election years.
So expect CPI and inflation to remain at levels largely similar to what they have for the past half year. Goods inflation will likely stay low (subject to uncertain oil prices). Companies that can, will continue to price gouge. Rents and home prices, Insurance services, processed food items, select services will remain at current levels or even drift up further. So therefore will the CPI, fluctuating perhaps marginally around its January levels month to month.
However, as will be explained in a Part 2 sequel to this article, even reported CPI is a low- balled estimate of the price level, due to the many questionable assumptions and methodologies that go into its estimation of inflation.
So if the US economy plane does decide eventually to descend, its landing may be anything but ‘soft’.
*
Note to readers: Please click the share button above. Follow us on Instagram and Twitter and subscribe to our Telegram Channel. Feel free to repost and share widely Global Research articles.
Dr. Rasmus is author of the books, ‘Central Bankers at the End of Their Ropes’, Clarity Press, 2017 and ‘Alexander Hamilton and the Origins of the Fed’, Lexington Books, 2020. Follow his commentary on the emerging banking crisis on his blog, https://jackrasmus.com; on twitter daily @drjackrasmus; and his weekly radio show, Alternative Visions on the Progressive Radio Network every Friday at 2pm eastern and at https://alternativevisions.podbean.com.
Featured image is from Shutterstock