


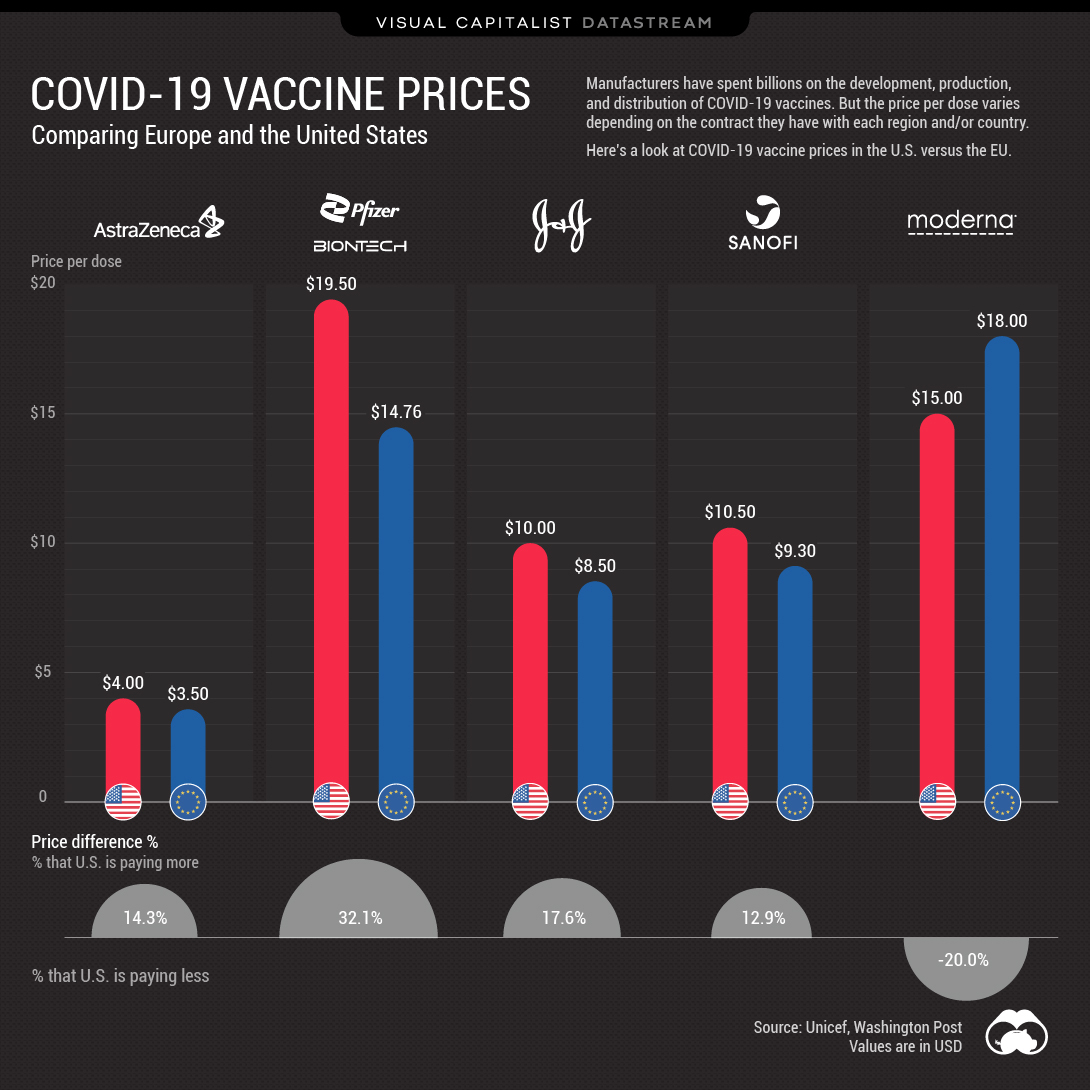
The U.S. paid 32.1% more per dose for the Pfizer vaccine, compared to the EU
Between the two areas, the Sanofi vaccine has one of the smallest prices gaps of only 12.9%
.
.
Comparing COVID Vaccine Prices between the U.S. and EU
Over two billion COVID-19 vaccine doses have been administered around the world.
But the price governments have paid for the vaccine varies, depending on the region or country. Here’s a look at five major vaccine manufacturers, and their price per dose in the U.S. compared to the EU.
COVID-19 Vaccine Prices: Cost Per Dose
Generally speaking, the EU has paid significantly less than America for a range of COVID-19 vaccines. Pfizer has the biggest price gap, with the U.S. paying 32.1% more per dose.
| Manufacturer | U.S. Price (per dose) | EU Price (per dose) | % Difference U.S. is paying |
|---|---|---|---|
| Pfizer/BioNTech | $19.50 | $14.76 | 32.1% |
| Moderna | $15.00 | $18.00 | -20.0% |
| Sanofi | $10.50 | $9.30 | 12.9% |
| Johnson & Johnson | $10.00 | $8.50 | 17.6% |
| AstraZeneca | $4.00 | $3.50 | 14.3% |
There are a few factors that might explain the price difference. One is early funding—Germany donated millions towards Pfizer’s development.
And while the U.S. did commit to purchasing hundreds of millions of doses of the Pfizer vaccine, the country didn’t provide any funding for the vaccine’s actual development.
Moderna is the only vaccine on the list that is actually cheaper in the U.S., at $15.00 per dose. However, considering that Moderna’s CEO had initially predicted governments would be charged $25-$37 per dose, it looks like both the U.S. and EU managed to negotiate a good deal.
Immunity is the Biggest Cost Saver
At the end of the day, the cost of the vaccine itself is pretty insignificant compared to the economic and emotional toll of an ongoing pandemic.
For instance, a study out of Harvard University estimated the total economic cost of COVID-19 in the U.S. to be in the $16.1 trillion range.
»Want to learn more? Check out our COVID-19 information hub to help put the past year into perspective
Where does this data come from?
Source: Unicef
Notes: Values are in $USD