Beyond Climate Tipping Points: Greenhouse Gas Levels Exceed the Stability Limit of the Greenland and Antarctic Ice Sheets


The pace of global warming has been grossly underestimated. As the world keeps increasing its carbon emissions rising in 2018 to a record 33.1 billion ton CO2 per year, the atmospheric greenhouse gas level has now exceeded 560 ppm (parts per million) CO2–equivalent, namely when methane and nitric oxide are included. This level surpasses the stability threshold of the Greenland and Antarctic ice sheets. The term “climate change“ is thus no longer appropriate, since what is happening in the atmosphere-ocean system, accelerating over the last 70 years or so, is an abrupt calamity on a geological dimension threatening nature and civilization. Ignoring what the science says, the powers-that-be are presiding over the sixth mass extinction of species, including humanity.
As conveyed by leading scientists “Climate change is now reaching the end-game, where very soon humanity must choose between taking unprecedented action or accepting that it has been left too late and bear the consequences” (Prof. Hans Joachim Schellnhuber)…
“We’ve reached a point where we have a crisis, an emergency, but people don’t know that … There’s a big gap between what’s understood about global warming by the scientific community and what is known by the public and policymakers” Prof. James Hansen.
Rising greenhouse gases and temperatures
By May 2019 the level of CO2(measured at Mouna Loa, Hawaii) has reached 414.66ppm, growing at a rate of 3.42ppm/year, well above the highest growth rate recorded for the last 56 million years. The total of CO2, methane (CH4) and Nitric oxide (N2O), expressed as CO2-equivalents, has reached at least 563 ppm (Table 1) (depending on the greenhouse forcing value of methane), the highest concentration since 34 – 23 million years ago, when atmospheric CO2 ranged between 300-530 ppm.
Table 1. Total atmospheric CO2e from CO2, CH4and N2O
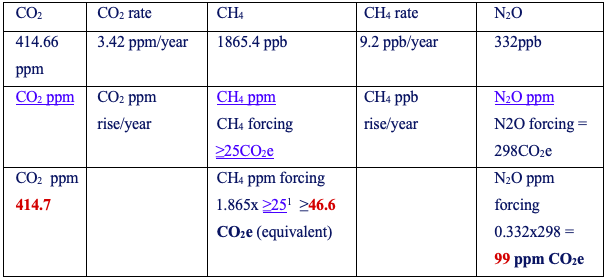
Total CO2e: 414.7+46.6+99 = >560.3 ppm CO2e
Plus: SF6, CHF3, CH2F2, CF4, C2F6, C3F8, C4F10, C4F8, C5F12, C6F1
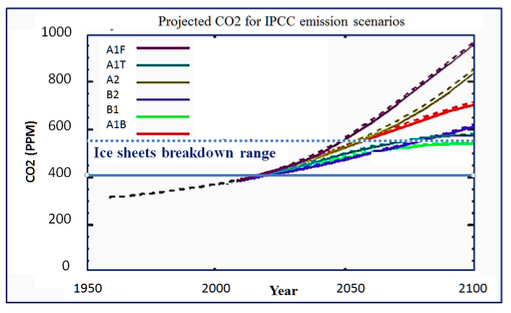
Figure 1. Projected CO2levels for IPCC emission scenarios
The current rise of the total greenhouse gas level to at least 560 ppm CO2-equivalent, twice the pre-industrial level or 280 ppm, implies global warming has potentially reached +2oC to +3oC above pre-industrial temperature. Considering the mitigating albedo/reflection effects of atmospheric aerosols, including sulphur dioxide, dust, nitrate and organic carbon, the mean rise of land temperature exceeds +1.5oC (Berkeley Earth Institute).
The threshold of collapse of the Greenland ice sheet is estimated in the range of 400-560 ppm CO2 at approximately 2.0-2.5 degrees Celsius above pre-industrial temperatures, and is retarded by hysteresis (where a physical property lags behind changes in the effect causing it).The threshold for the breakdown of the West Antarctic ice sheet is similar. The greenhouse gas level and temperature conditions under which the East Antarctic ice sheet formed about 34 million years ago are estimated as ~800–2000 ppm at 4 to 6 degrees Celsius above pre-industrial values. Based mainly on satellite gravity data there is evidence the East Antarctic ice sheet is beginning to melt in places (Jones, 2019), with ice loss rates of approximately 40 Gt/y (Gigaton of ice per year) in 1979–1990 and up to 252 Gt/y in 2009–2017 (Rignot et al., 2019).
The cumulative contribution to sea-level rise from Antarctic ice melt was 14.0 ± 2.0 mm since 1979. This includes 6.9 ± 0.6 mm from West Antarctica, 4.4 ± 0.9 mm from East Antarctica, and 2.5 ± 0.4 mm from the Antarctic Peninsula (Rignot et al., 2019). Based on the above, the current CO2-equivalent level of at least 560ppm closely correlates with the temperature peak at ~16 million years ago (Figures 2 and 5), when the Greenland ice sheet did not exist and large variations affected the Antarctic ice sheet (Gasson et al., 2016).
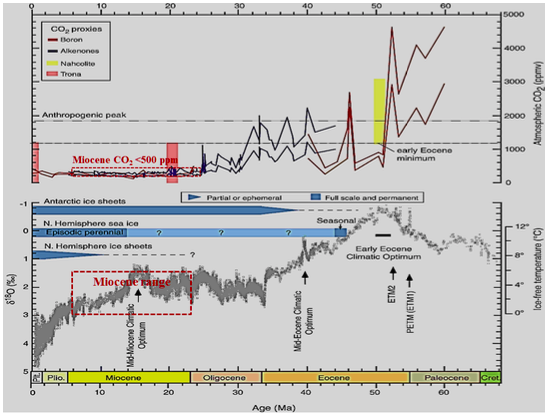
Figure 2. Updated Cenozoic pCO2 and stacked deep-sea benthic foraminifer oxygen isotope curve for 0 to 65 Ma (Zachos et al., 2008)converted to the Gradstein timescale (Gradstein et al., 2004). ETM2 = Eocene Thermal Maximum 2, PETM = Paleocene/Eocene Thermal Maximum.
Transient melt events
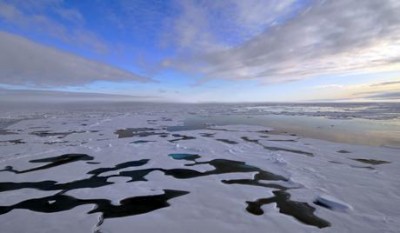
As the glacial sheets disintegrate, cold ice-melt water flowing into the ocean ensue in large cold water pools, a pattern recorded through the glacial-interglacial cycles of the last 450,000 years , manifested by the growth of cold regions in north Atlantic Ocean south of Greenland and in the Southern Ocean fringing Antarctica (Figures 3 and 4). The warming of the Arctic is driven by the ice-water albedo flip (where dark sea-water absorbing solar energy alternate with high-albedo ice and snow) and by the weakening of the polar boundary and jet stream. Penetration of Arctic-derived cold air masses through the weakened boundary results in extreme weather events in North America, Europe and northern Asia, such as the recent “Beast from the East” event.
Warming of +3oC to +4oC above pre-industrial levels, leading to enhanced ice-sheet melt, would raise sea levels by at least 2 to 5 meters toward the end of the century, and likely by 25 meters in the longer term. Golledge et al. (2019) show meltwater from Greenland will lead to substantial slowing of the Atlantic overturning circulation, while meltwater from Antarctica will trap warm water below the sea surface, increasing Antarctic ice loss. The effects of ice sheet-melt waters on the oceans were hardly included in IPCC models. Depending on amplifying feedbacks, prolonged Greenland and Antarctic melting (Figures 3 and 4) and a consequent freeze event may ensue, lasting perhaps as long as two to three centuries.

Figure 3.(A) Global warming map (NASA 2018). Note the cool ocean regions south of Greenland and along the Antarctic. Credits: Scientific Visualization Studio/Goddard Space Flight Center; (B) 2012 Ocean temperatures around Antarctica, (NASA 2012).
21st–23rd centuries’ uncharted climate territory
Modelling of climate trends for 2100-2300 by the IPCC AR5 Synthesis Report, 2014 portrays predominantly linear models of greenhouse gas rise, global temperatures and sea levels. These models however appear to take little account of amplifying feedbacks from land and ocean and of the effects of cold ice-melt on the oceans. According to Steffen et al. (2018) “self-reinforcing feedbacks could push the Earth System toward a planetary threshold” and “would lead to a much higher global average temperature than any interglacial in the past 1.2 million years and to sea levels significantly higher than at any time in the Holocene”.
Amplifying feedbacks of global warming include:
A. The albedo-flip of melting sea ice and ice sheets and the increase of the water surface area and thereby sequestration of CO2. Hudson (2011) estimates a rise in radiative forcing due to removal of Arctic summer sea ice as 0.7 Watt/m2, a value close to the total of methane release since 1750.
B. Reduced ocean CO2 intake due to lesser solubility of the gas with higher temperatures.
C. Vegetation desiccation and loss in some regions, and thereby reduced evaporation with its cooling effect. This factor and the increase of precipitation in other regions lead to differential feedbacks from vegetation as the globe warms (Notaro et al. 2007).
D. An increase in wildfires, releasing greenhouse gases.
E. Release of methane from permafrost, bogs and sediments and other factors.
Linear temperature models do not appear to take into account the effects on the oceans of ice melt water derived from the large ice sheets, including the possibility of a major stadial event such as already started in oceanic tracts fringing Greenland and Antarctica (Figure 3). In the shorter term sea level rises include the Greenland ice sheet (6-7 meter sea level rise) and West Antarctic ice sheet melt (4.8 meter sea level rise). Referring to major past stadial events, including the 8200 years-old Laurentian melt event and the 12.7-11.9 younger dryas event, a prolonged breakdown of parts of the Antarctic ice sheet could result in major sea level rise and extensive cooling of northern and southern latitudes, parallel with warming of tropical and mid-latitudes (Figure 4) (Hansen et al.. 2016). The clashes between polar-derived cold weather fronts and tropical air masses are bound to lead to extreme weather events, echoed in Storms my grandchildren (Hansen, 2010).
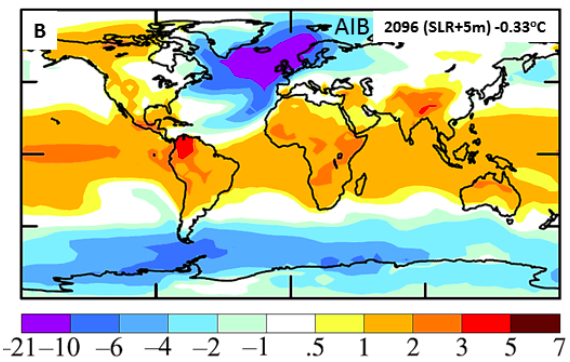
Figure 4. Model Surface-air temperature (oC) for 2096 relative to 1880–1920. Hansen et al 2016. The projection betrays major cooling of the North Atlantic Ocean, cooling of the circum-Antarctic Ocean and further warming in the tropics, subtropics and the interior of continents, including Siberia and Canada.
Summary and conclusions
A. Global greenhouse gases have reached a level exceeding the stability threshold of the Greenland and Antarctic ice sheets, melting at an accelerated rate.
B. The current growth rate of atmospheric greenhouse gas of 3.42 ppm CO2/year is the fastest recorded for the last 55 million years.
C. Allowing for the transient albedo enhancing effects of sulphur dioxide and other aerosols, mean global temperature has reached about 2 degrees Celsius above per-industrial temperatures.
D. Due to hysteresis the large ice sheets outlast their melting temperatures.
E. Cold ice melt water flowing from the ice sheets at an accelerated rate will reduce the temperature of large ocean tracts in the North Atlantic and circum-Antarctic. Strong temperature contrasts between cold polar-derived air and water masses and tropical air and water masses, ensuing in extreme weather events, would result in extreme weather events, retarding agriculture in large parts of the world.
F. Humans will survive in relatively favorable parts of Earth, such as sub-polar regions and sheltered mountain valleys, where hunting of surviving fauna may be possible,
G. In the wake of partial melting of the large ice sheets, the Earth climate would shift to polarized conditions including reduced polar ice sheets and tropical to super-tropical regions such as existed in the Miocene (5.3 – 23 million years ago) (Figure 5).
Current greenhouse gas forcing and global mean temperature are approaching Miocene Optimum-like composition, bar the hysteresis effects of reduced ice sheets (Figure 5). Strong temperature polarities are suggested by the contrasts between reduced Antarctic ice sheet and super-tropical conditions in low to mid-latitudes. Land areas would be markedly reduced due to a sea level rise of approximately 40 ± 15 meters
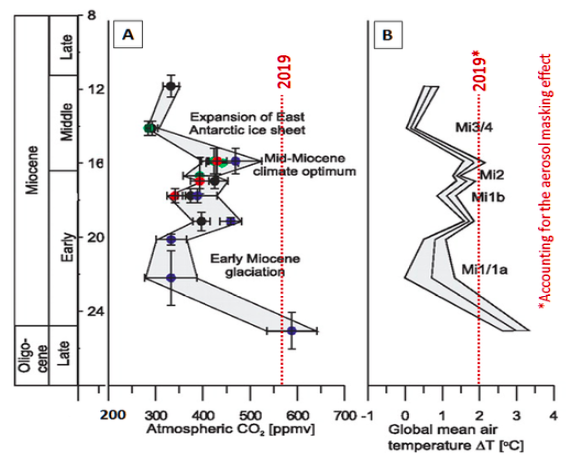
Figure 5. Late Oligocene–Miocene inferred atmospheric CO2 fluctuations and effects on global temperature based on Stromata index (SI) of 25 and 12 Ma (late Oligocene to late middle Miocene) fossil leaf remains; (A) Reconstructed late Oligocene–middle Miocene CO2 levels based on individual independently calibrated tree species; (B) Modeled temperature departure of global mean surface temperature from present day, calculated from mean CO2 estimates by using a CO2–temperature sensitivity study. Red discontinuous lines: 2019 CO2-e levels and 2019 temperatures (discounting the aerosol masking effects).
*
Note to readers: please click the share buttons below. Forward this article to your email lists. Crosspost on your blog site, internet forums. etc.
Dr Andrew Glikson, Earth and Paleo-climate science, Australia National University (ANU) School of Anthropology and Archaeology, ANU Planetary Science Institute, ANU Climate Change Institute, Honorary Associate Professor, Geothermal Energy Centre of Excellence, University of Queensland. He is a frequent contributor to Global Research.
Note
[1] A methane forcing value of 25 XCO2 is a conservative long-term value. Shorter term forcing values are significantly higher