Poverty in the Philippines: The Official Figures Have Been Manipulated

Introduction. The World Bank Methodology
The World Bank methodology regarding to measurement of poverty is described in the World Development Report 1990: Poverty? In this “authoritative” study on global poverty published in 1990, the “upper poverty line” is arbitrarily set at a per capita income of US$ 1 a day corresponding to an annual per capita income of US$ 370 per annum. This criterion subsequently led to the formulation of the one dollar a day International Poverty Line (IPL)
Population groups in individual countries with per capita incomes in excess of US$ 1 a day (1985 constant dollars) are arbitrarily identified by the World Bank as “non-poor”. Through the gross manipulation of income statistics, the World Bank figures serve the “useful purpose” of representing the poor in developing countries as a minority group. For purposes of “measurement”, the World Bank adopted arbitrarily a poverty line at $370 per annum at 1985 constant prices. An extreme poverty line was established at $270 per annum.
The $370 annual threshold was subsequently upheld as the one dollar a day per capita international poverty line (IPL) which has been applied widely by developing countries for “measuring poverty” at a national level.
“one dollar a day keeps poverty away”
It should be understood that the one dollar a day (1985 PPP) is an arbitrary figure recommended by the World Bank to the governments of developing countries. It does not require the measurement of poverty in terms of basic human needs including nutrition, health, education, housing. Its unspoken objective is to falsify the national figures on poverty as well as obfuscate the process of global impoverishment initiated since the onslaught of the debt crisis of the early 1980s.
The WB on a regular basis has issued statistics based on the one dollar day International Poverty Line with a view to upholding the illusion that global poverty has declined dramatically since the 1990s. These figures are based on the dollar a day per capita methodology.
The initial “measurement” of country level poverty figures based on the one dollar a day per capita criterion was applied by the World Bank using 1985 as the base period. During a period of twenty years (1985-2005) the one dollar a day was applied. The base period for the arbitrary one dollar a day per capita criterion was in 1985 constant prices.
In 2005, with a view to accounting for inflation of basic consumer goods since the 1985 base period, the World Bank redefined arbitrarily the upper poverty criterion at $1.25 PPP. i.e. a 25 percent increase in the poverty criterion to account for the increase of consumer prices over a 20 year period (i.e. in relation to the 1985 base period).
This figure of $1.25 pertaining to 2005 was set arbitrarily by the World Bank. It was not based on relevant estimates of inflation over a 20 year period (i.e. since 1985).
In 2011, the one dollar a day upper poverty criterion by the World Bank was set at $1.90 PPP (2011) (indicating that the prices of consumer essentials had increased by 90 % in relation to the 1985 base period):
In October 2015, the World Bank announced that it had updated its international poverty line (IPL) and its estimate of the number of people living in extreme poverty globally. The IPL, which came to prominence with the dollar-a-day figure devised by the Bank in 1990, is revised periodically in line with new data from the independent International Comparison Program (ICP), which is hosted by the World Bank. The new figure of $1.90 is based on ICP purchasing power parity (PPP) calculations and represent the international equivalent of what $1.90 could buy in the US in 2011. The new IPL replaces the $1.25 per day figure, which used 2005 data.( World Bank, April 5, 2016)
In the World Bank framework, the “estimation” of poverty indicators has become a numerical exercise, which usefully serves to conceal the incidence of poverty. No need to analyse household expenditures on food, shelter and social services; no need to observe concrete conditions in impoverished rural barangay or urban slum areas. The estimates are totally removed from real life situations.
The Measurement of Poverty in the Philippines
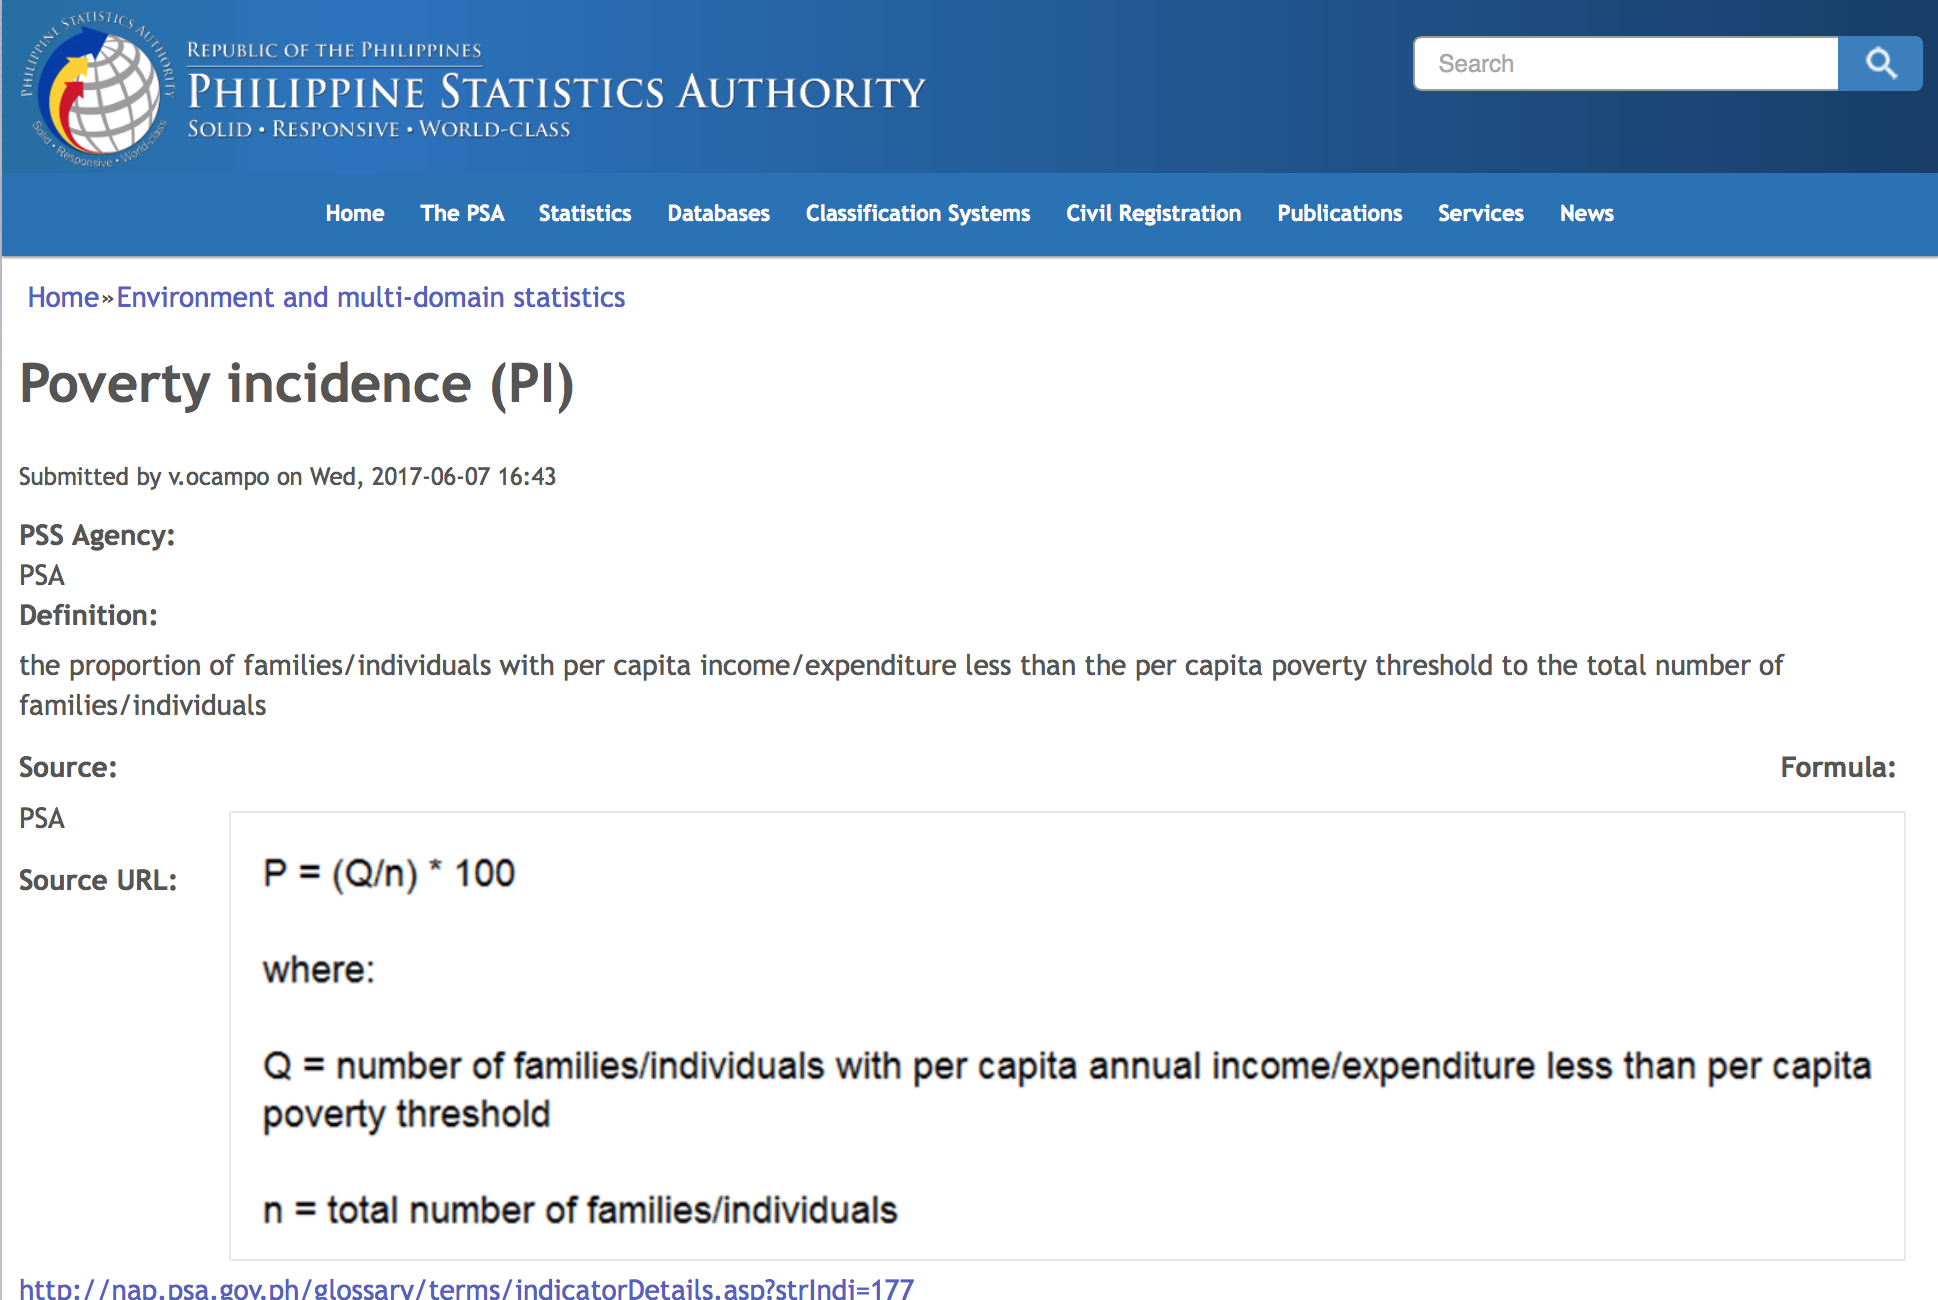
How are the estimates of “poverty incidence” in the Philippines calculated? According to the PSA “Poverty incidence among Filipinos is the proportion of people below the poverty line to the total population.”
The Philippines Statistics Authority (PSA) distinguishes between “poverty incidence” and “extreme or subsistence poverty incidence”
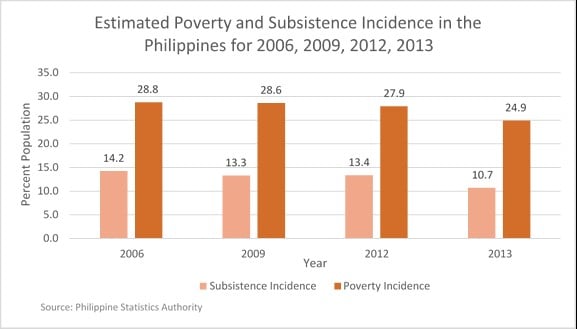
Poverty incidence among Filipinos in the first semester of 2015 was estimated at 26.3 percent. During the same period in 2012, poverty incidence among Filipinos was recorded at 27.9 percent
On the other hand, subsistence incidence among Filipinos, or the proportion of Filipinos whose incomes fall below the food threshold, was estimated at 12.1 percent in the first semester of 2015. In the first half of 2012, the subsistence incidence among Filipinos is at 13.4 percent. Subsistence incidence among Filipinos is often referred to as the proportion of Filipinos in extreme or subsistence poverty. (PSA Report, 2016)
While the PSA provides the relevant expenditure data, it does not explain how the “poverty line” is established, on what criteria. Moreover, it is unclear as to whether the Philippines uses the World Bank methodology to establish its “poverty line”.
In a 2001 report entitled Philippines Poverty Assessment, Vol I, the World Bank researchers pointed to the fact that the Philippines criteria in the 1990s for measuring poverty yielded significantly higher levels of estimated poverty than those those of the World Bank.
In contrast to the 1990s, the criterion applied in the 2012 and 2015 Philippines estimates result in a significantly lower percentage of the population below the poverty line, compared to estimates using the World Bank poverty methodology which is based on the arbitrary one dollar a day per capita IPL.
In a 2014 study, USAID states (mistakenly) that the Philippines adopted the World Bank methodology in its 2012 estimate of the incidence of poverty. According to USAID, the 2012 the poverty line for the Philippines was $1.25 per capita per day. The World Bank methodology, however had set the $1.25 poverty line for 2005 (not 2012), which means that in the case of the Philippines seven years of inflation have not been accounted for). According to USAID:
In 2012, extreme poverty in the Philippines was estimated at 19.2 percent of the population, or about 18.4 million people, based on the international poverty line of $1.25 per day. Most of the poor in the Philippines live in rural areas and work in the agriculture sector, mainly in farming and fishing. Urban poverty, however, has been increasing in recent years. Migrants without jobs or with low-paying jobs are unable to afford decent housing. As a result, Philippine cities have high proportions of informal settlers who are among the poorest of the poor.
Moreover, poverty is severe in parts of the country with high levels of conflict. The Philippines’ 10 poorest provinces are considered either conflict-affected or vulnerable to conflict.
The Official Poverty Estimates in the Philippines
In this section we examine poverty “estimates” respectively for 2012 and 2015. The poverty estimates are said to based on the Annual Poverty Indicators Survey (APIS) as well as the Family Income and Expenditure Survey (FIES).
While the Philippine Statistics Authority (PSA) claims that the poverty estimates are based on the household expenditures survey, an examination of the figures suggests that the incidence of poverty is determined arbitrarily. The household expenditure surveys confirm the levels of spending by income group. Yet the poverty threshold is set arbitrarily (in a similar way to the procedure pertaining to the World Bank’s International Poverty Line). The calculus of PI is as follows
PI = Q/n where
- Q is the the number of families/individuals less than the per capita poverty threshold divided by
- n total population (families/individuals)
The PSA does not define the per capita poverty threshold. There is no evidence that it is related to an actual measurement of poverty (nutrition, health, education, housing) based on the Family Income and Expenditure Survey (FIES).
The 2012 Estimates of Poverty
The Philippine Statistics Authority (PSA) provided estimates of poverty incidence in 2012 as follows:
In the same period in 2012, the proportion of Filipino families in extreme poverty whose incomes are not sufficient to meet basic food needs stands at 7.5 percent, which is almost the same in 2009 but the figure in 2012 is significantly lower than the 8.8 percent estimate in 2006.
These estimates border on ridicule. On what are they based? Daily minimum Calories and protein requirements?
Where are the estimates?
How were these figures computed?
Following the logic of the WB one dollar a day per capita criterion, the monthly PhP 7,890 to meet both basic food and non-food needs for a family of five translates into PhP52.6 per capita per day (simple arithmetics 7890 divided by 30 days to convert this amount into a daily requirement, then divided by five to account for family size)
Where is the manipulation?
The WB one dollar a day pertains to the base period of 1985. As mentioned above, the WB redefined the international poverty line (IPL) at $1.25 at 2005 constant prices (PPP). Moreover, for the year 2011, the poverty frontier was once again modified. It was defined by the World Bank at $1.90 PPP.
What this suggests is that the PSA “estimate” of the poverty line at $1.25 for 2012 in current prices is equivalent to that WB’s $1.25 for 2005. i.e. It does not account for inflation over a period of seven years (since 2005). the PSA measurement therefore yield a substantially lower “estimate” of poverty when compared to that of the World Bank.
The correct assessment following the WB criterion would have been to apply the $1.90 PPP criterion for 2011, accounting for inflation in 2012. At a threshold of $1.90+ this “estimate” would have led, had it been applied, to a significantly larger percentage of the Philippines population below the poverty line. It should be noted that neither the WB IPL nor the Philippines $1.25 criterion are valid measurements of poverty. They do not include an assessment of the purchasing power required (in PhP) to meet basic human needs (nutrition, health, education, housing)
The 2015 Estimates of Poverty
The Philippine Statistics Authority (PSA) describes the process of estimating the poverty incidence in 2015 (based on 2015 current prices):
During the first semester of 2015, a family of five needed at least PhP 6,365 on the average every month to meet the family’s basic food needs and at least PhP 9,140 on the average every month to meet both basic food and non-food needs. These amounts represent the monthly food threshold and monthly poverty threshold, respectively. They indicate increases of about 17 percent in food threshold and poverty thresholds from the first semester of 2012 to the first semester of 2015 . …
The subsistence incidence among Filipino families, or the proportion of Filipino families in extreme poverty, was estimated at 9.2 percent during the first semester of 2015. In the same period in 2012, the proportion of families in extreme poverty was recorded at 10.0 percent .
How were these 2015 figures computed?
Again following the logic of the WB one dollar a day per capita criterion, the monthly PhP 9,140 to meet both basic food and non-food needs for a family of five translates into PhP61.00 per capita per day (9140 divided by 30 days to convert this amount into a daily requirement, then divided by five to account for family size)
At the average 2015 dollar PhP exchange rate (PhP44.5= 1$), the per capita PhP 61.00 per day translates into $1.35.
The WB one dollar a day pertains to the base period of 1985. As mentioned above, the WB redefined the poverty frontier at $1.90 PPP in 2011.
While it appears that the PSA Authority has adopted the one dollar a day World Bank criterion, it has failed to account for inflation in both the 2012 and 2015 estimates. In 2015, the poverty threshold in dollars (and current pesos) was well in excess of $1.90 PPP for 2011.
It is worth noting that the World Bank had set a $1.25 PPP estimate for the year 2005, which according to the WB represents the purchasing power parity of the one dollar a day per capita established for the 1985 base period.
There are two distinct levels of manipulation. First the PSA takes the World Bank methodology at face value. They do not question the one dollar a day methodology, IT DOES NOT MEASURE POVERTY.
Second they seem to go well beyond the WB criteria in distorting reality by not accounting for inflation over the period 2005-2012. (The WB $1.25 daily per capita threshold pertains to 2005not to 201)
Moreover, the official estimates are set arbitrarily, totally removed from an assessment of basic human needs (nutrition, health, education, housing).They are clear expression of distortion and obfuscation.
The poverty levels in the Philippines are high, poverty encompasses the majority of the population. They need to be carefully estimated focussing on a measurement of basic human needs.
The PSA statement that an individual can meet basic human needs expenditures including food, transport, housing, health and education with 61 pesos (2015) a day borders on ridicule.
To state that population groups with 65-70 pesos per capita per day are “non-poor” is absurd. Poverty in the Philippines affect the vast majority of the population.
These figures do not reflect the social realities in the Philippines which is characterized by high unemployment, exceedingly low wages and mass poverty.
At the time of writing (February 2018), the cost of a 50kg sack of rice is approximately PhP2000, namely php40 per kg.)
Double Standards in the Measurement of Poverty
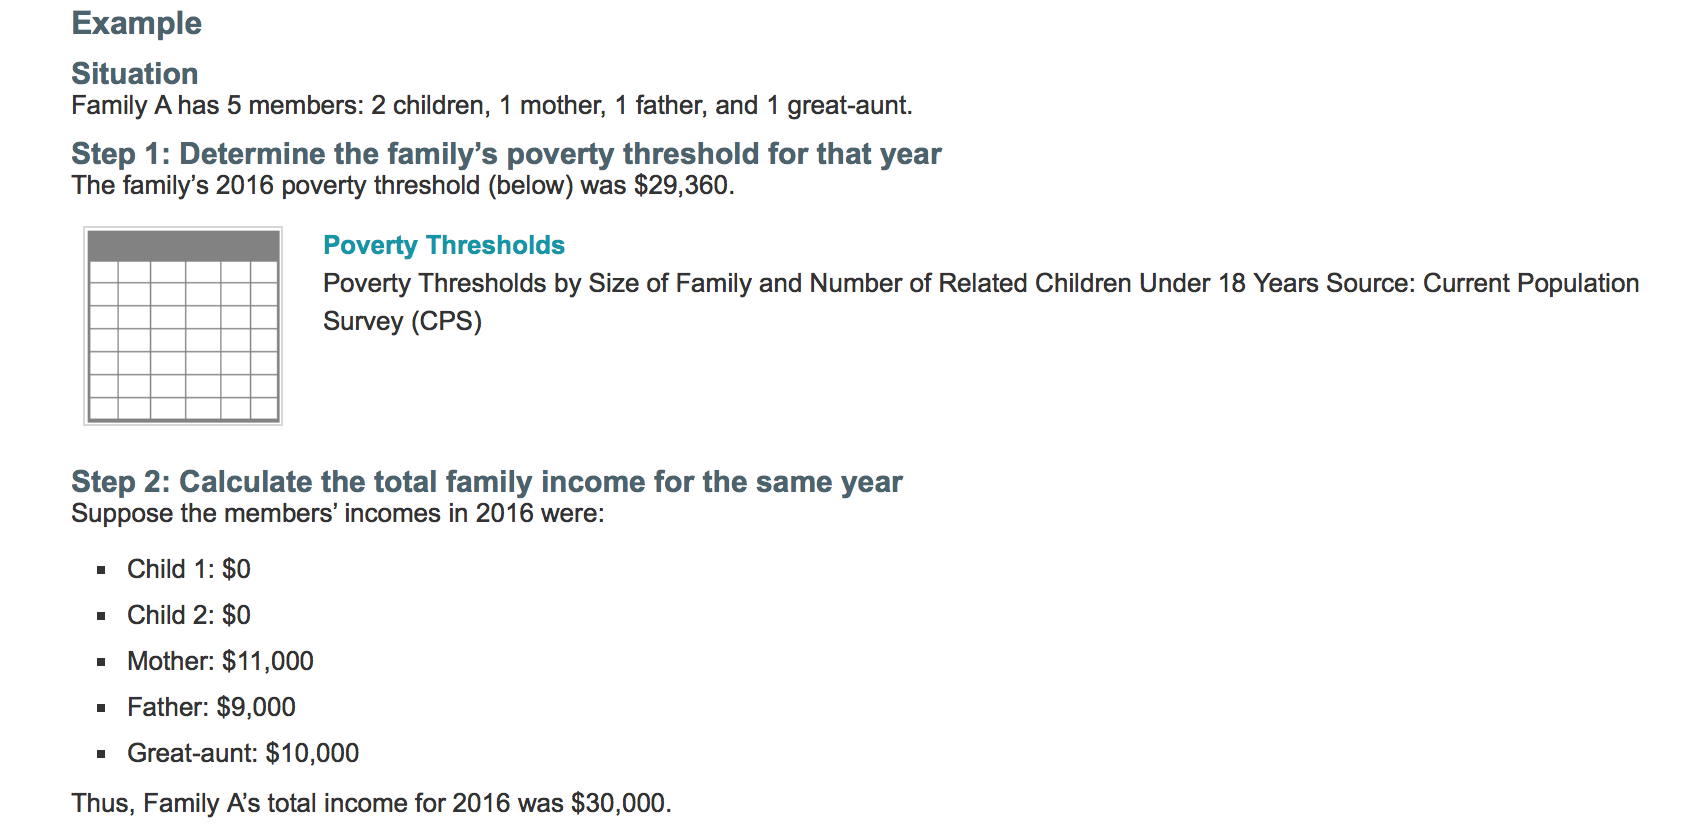
It is worth noting that in the US, the per capita per day poverty threshold, according to the US Bureau of Census for an American family of two adults and three children is of the order of $30,000 per annum,
namely $16.44 per capita per day
(TWELVE TIMES HIGHER THAN FOR A FAMILY OF FIVE IN THE PHILIPPINES 2015 POVERTY LINE OF:
$1.35 per capita per day. (PhP 61)

Source US Census Bureau
The criterion to measure poverty in the Philippines is imposed by the Washington Consensus, which evaluates the value of human life in the Philippines, twelve times lower than in the US.
Yet for a large range of commodities, prices in the Philippines are not only at par with those in America in many cases they are much higher than in the US. Visibly the poverty measurement criteria of the Washington Consensus (US Treasury, IMF-World Bank, Washington Think Tanks) are not meant to be applied in the US.
With regard to the price of basic food staples in the US , compared to the Philippines, the retail price of rice in New York City is US$ 0.71 a pound which converts into US$ 1.57 a kilo, approximately PhP 78.85.
In other words the price of rice in NYC is double that of the Philippines, yet the USCB poverty line used to measure poverty in the US is $16.44 a day (twelve times higher than in the Philippines)
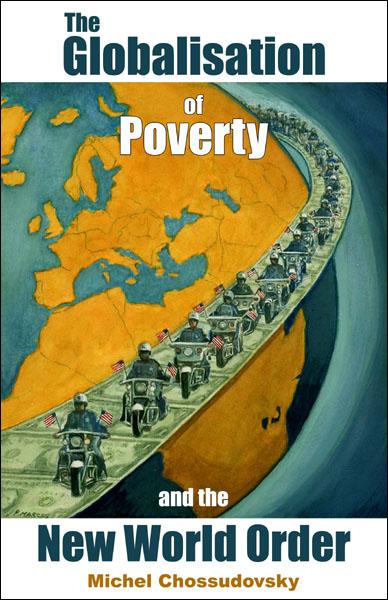
 In this new and expanded edition of Chossudovsky’s international best-seller, the author outlines the contours of a New World Order which feeds on human poverty and the destruction of the environment, generates social apartheid, encourages racism and ethnic strife and undermines the rights of women. The result as his detailed examples from all parts of the world show so convincingly, is a globalization of poverty.
This book is a skillful combination of lucid explanation and cogently argued critique of the fundamental directions in which our world is moving financially and economically.
In this new enlarged edition – which includes ten new chapters and a new introduction — the author reviews the causes and consequences of famine in Sub-Saharan Africa, the dramatic meltdown of financial markets, the demise of State social programs and the devastation resulting from corporate downsizing and trade liberalisation.
To order directly from Global Research, click here:


