


All Global Research articles can be read in 51 languages by activating the “Translate Website” drop down menu on the top banner of our home page (Desktop version).
To receive Global Research’s Daily Newsletter (selected articles), click here.
Visit and follow us on Instagram at @globalresearch_crg.
***
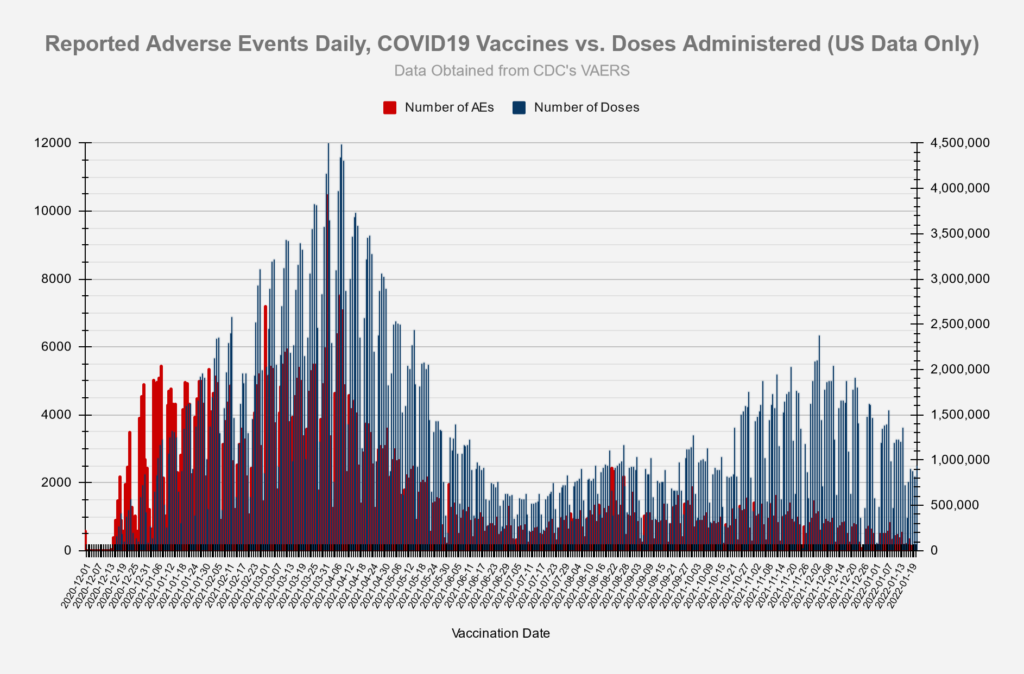
All charts and tables below reflect the data release on 01/28/2022 from the VAERS website, which includes U.S. and foreign data, and is updated through: 1/21/2022

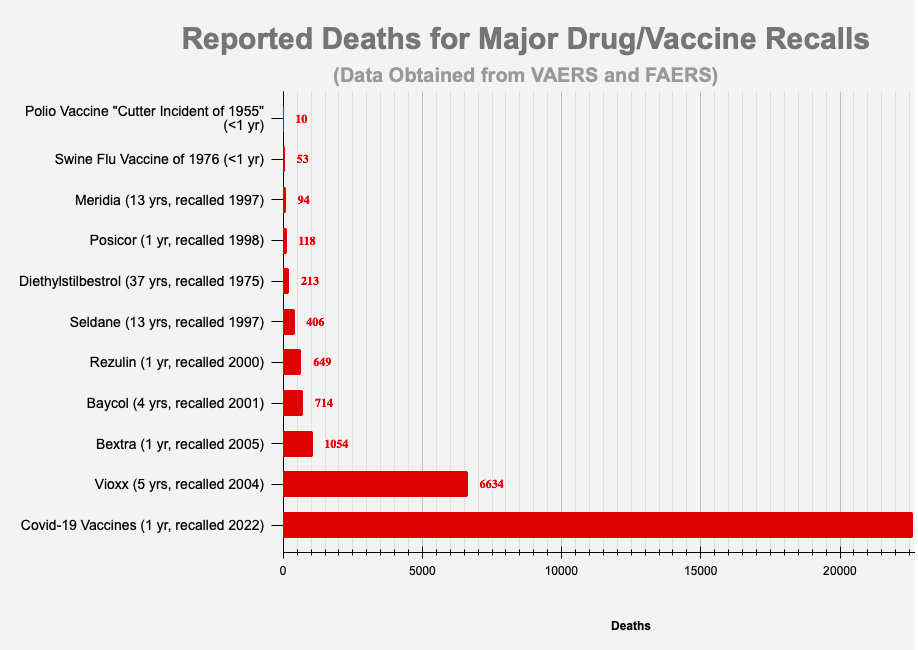
*Note that the total number of deaths associated with the COVID-19 vaccines is more than double the number of deaths associated with all other vaccines combined since the year 1990.
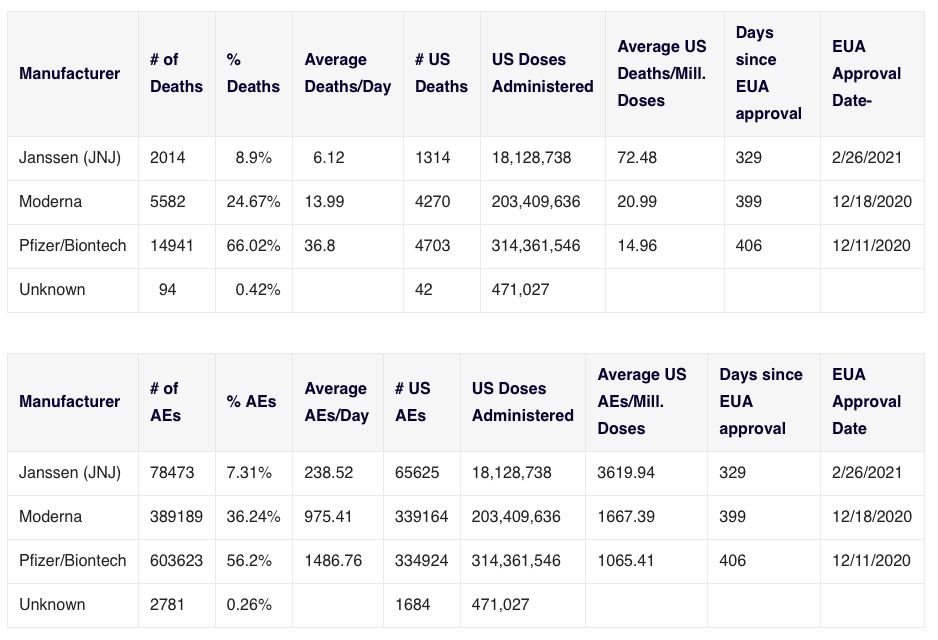
Deaths

[Unknowns separated from All Other Vaccines for greater clarity; in a majority of cases the Unknowns are actually Covid-19]


Adverse Events

[Unknowns separated from All Other Vaccines for greater clarity; in many cases the Unknowns are actually Covid-19]


Symptoms
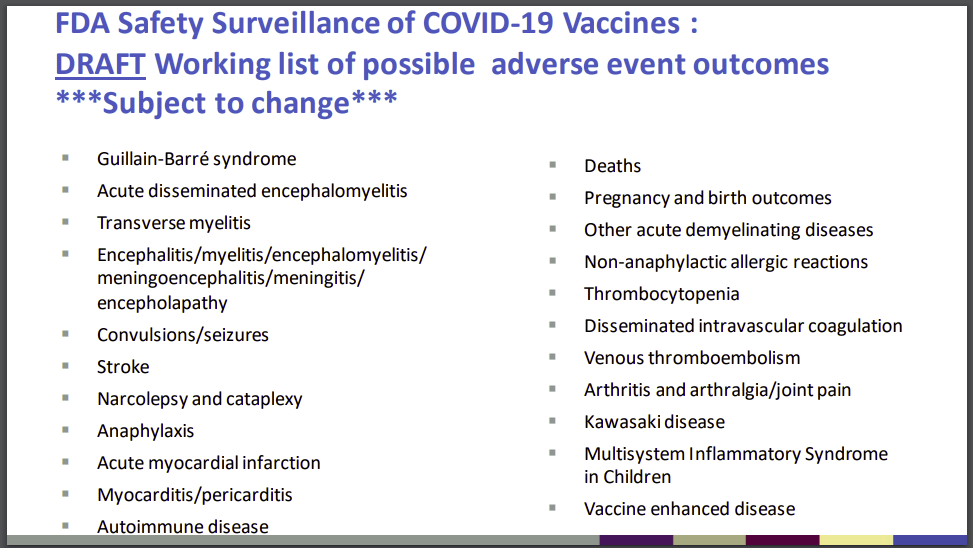
The slide below was taken from an FDA document from October 22, 2020 and provides a list of possible adverse event outcomes related to the Covid-19 vaccines.
- Source: ‘Vaccines and Related Biological Products Advisory Committee October 22,2020 Meeting Presentation”.
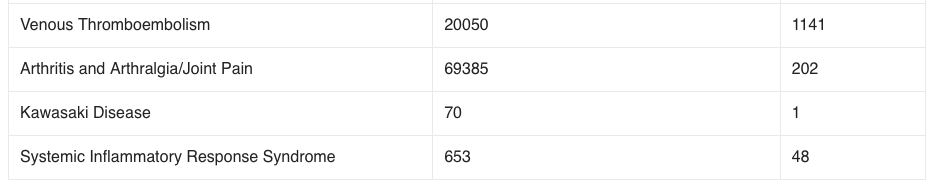
The following table lists the number of adverse events found in the VAERS data which match the outcomes listed above:

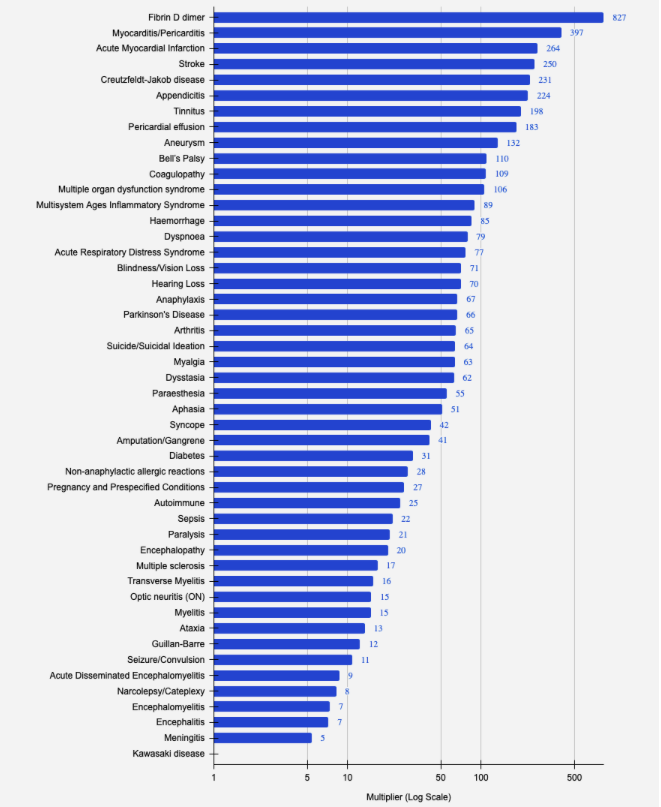
Average Annual Adverse Events by Symptom for COVID-19 Vaccines as a Multiple of All Other Vaccines Combined since 1990
(Data from VAERS through 1/21/22)
Vaccination Related Risks of COVID19 Vs. Flu
These set of figures compare the COVID19 vaccine to the traditional Flu vaccines. ‘Risk of Death’ percentages depend on the ‘# of Vaccinations’ data, which is only approximate, and was pulled from the CDC’s report on Flu vaccination coverage for the 2019-2020 season, and from Our World in Data for the COVID19 vaccinations.
Covid19 vaccinations through 5/31/2021 vs. Flu vaccinations 7/1/2019 – 5/31/2020 (last complete flu season)

Risk of dying from COVID vaccine is 171 times greater than Flu Vaccine
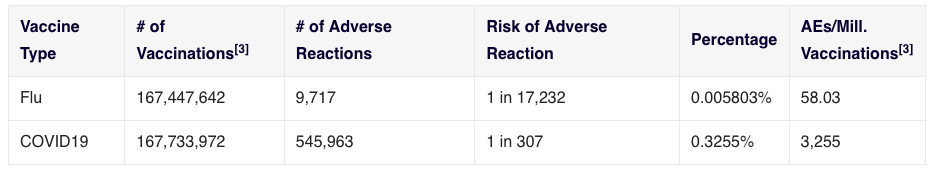
Risk of adverse reaction from COVID vaccine is 56 times greater than Flu Vaccine
Notes
[1] number of flu vaccinations based on estimated flu vaccine coverage data from CDC and estimated population data from US Census. Yearly flu vaccination data covers a period of time from 7/1 to 5/31 of the following year.
[2] number of covid19 vaccinations based on estimates from Our World in Data [2] number of covid19 vaccinations based on estimates from Our World in Data
[3] Persons vaccinated with at least one dose.

Vaccine Data by Manufacturer
Vaccine Data by Gender

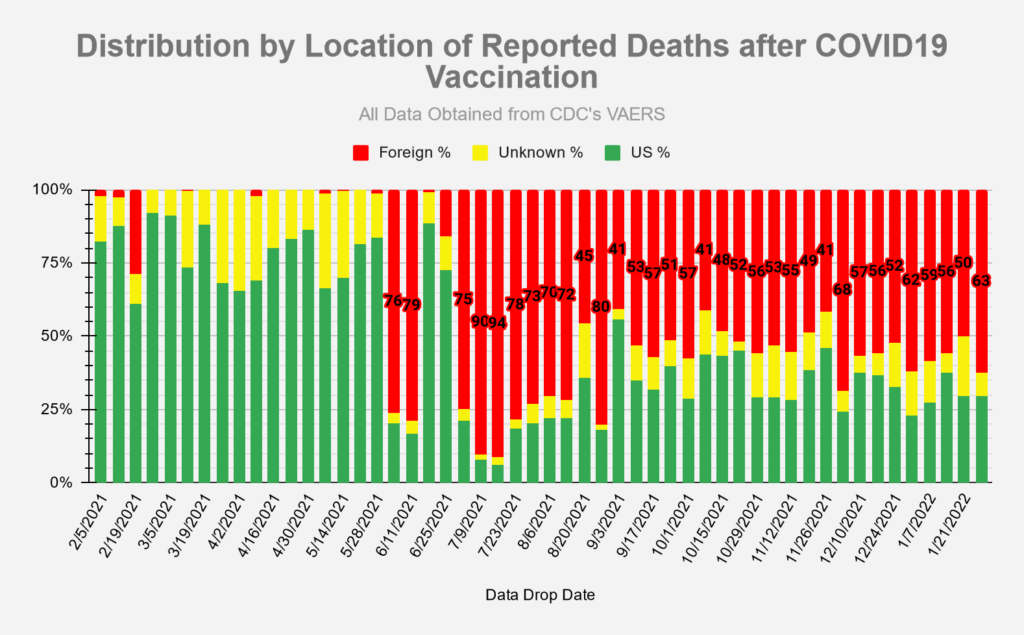
Vaccine Data by Location

Recall History
*
Note to readers: Please click the share buttons above or below. Follow us on Instagram, @globalresearch_crg. Forward this article to your email lists. Crosspost on your blog site, internet forums. etc.
Our thanks to Mark Taliano (CRG Associate) for bringing this to our attention.
Sources
Vaccine data (Covid-19 and other vaccines) taken from CDC’s VAERS website, located here: https://vaers.hhs.gov/data/datasets.html. VAERS data sets in the form of csv files are pulled down weekly and put into a database for reporting/analysis. Data files are available all the way back to 1990.
Number of doses distributed for other vaccines found in NVICP Data and Statistics report here: https://www.hrsa.gov/sites/default/files/hrsa/vaccine-compensation/data/data-statistics-report.pdf
Numbers for Covid-19 vaccines administered by manufacturer found here: https://covid.cdc.gov/covid-data-tracker/#vaccinations_vacc-total-admin-rate-total
Numbers for total Covid-19 vaccine doses administered found here: https://data.cdc.gov/Vaccinations/COVID-19-Vaccination-Trends-in-the-United-States-N/rh2h-3yt2
Numbers for Flu vaccine doses administered for 2019-2020 season found here: https://www.cdc.gov/flu/fluvaxview/coverage-1920estimates.htm
Numbers for FDA regulated drugs taken from FDA’s FAERS website, located here: https://www.fda.gov/drugs/questions-and-answers-fdas-adverse-event-reporting-system-faers/fda-adverse-event-reporting-system-faers-public-dashboard
Featured image is from VAERS Analysis