|
Much can be learned about the trajectory and nature of the current 2020 Great Recessions 2.0 underway by understanding what went on in similar deep economic contractions that are combined with financial-banking instability and crashes.
The so-called ‘Great Recession of 2008-09’ was one such ‘dual’ crisis. Another occurred in early years of the Great Depression of the 1930s, from 1929 to 1931. Another is the financial crash of 1907-08 and its aftermath of four years of stagnant growth and re-recessions.
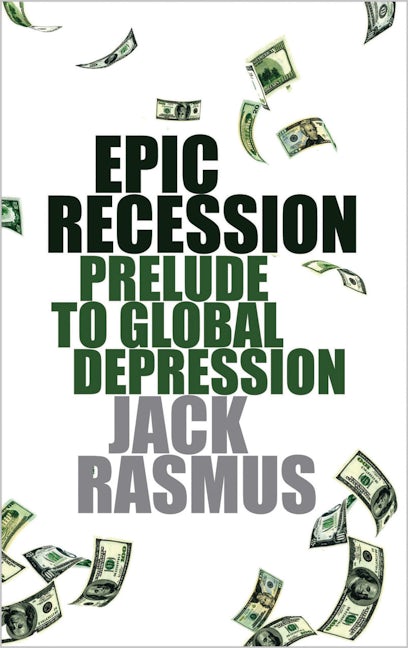
What follows is an excerpt from my 2010 book, ‘Epic Recession: Prelude to Global Depression’, specifically the chapter 3 entitled ‘The Dynamics of Epic Recessions. (Note: what others called the ‘Great Recession’ I alternatively called ‘Epic Recessions’ to distinguish them from ‘normal’ recessions). In it I explain how excessive liquidity injections by central banks feeds financial instability and excess debt accumulation throughout the economic system. Excess debt build up during the ‘boom’ period makes the economic system ‘fragile’–meaning sensitive and prone to deep contractions. The contractions, when they come, generate deflation in both financial and goods prices that, together with the debt unwinding, lead to widespread defaults, in both financial and non-financial sectors of the economy. That condition drives the economy into a further deeper contraction. Banking and financial crashes follow. All great (aka epic) recessions are made of such dynamics, which differentiates them from ‘normal’ recessions. Great Depressions are when defaults provoke a sequence of multiple financial-banking crashes.
In a number of ways the current 2020 events are increasingly similar to prior ‘great’ recession events.
The process is still, of course, in early stage and evolving. But the special, very severe contraction underway as of spring 2020 portends an especially severe form of Great Recession. The Fed and other central banks are desperately trying to head off a financial-banking crash by throwing unprecedented magnitudes of free money at the financial institutions. And now at the non-financial sector as well for the first time historically. Whether this ‘all in’ strategy can succeed in preventing defaults, deep financial asset price deflation, and a system wide credit crash remains to be seen.
The process will take months, not weeks, to work itself out. But against the system stabilizing as a result of tens of trillions of dollars of free money is the US and world economies were especially weak on the eve of the virus impact–not strong as some politicians like to argue.
Moreover, monetary policy was largely spent stabilizing the 2008-09 crashes, and thereafter in continuing to subsidize capital incomes and profits instead of preparing for the next cycle. Ditto for fiscal policy, that continued to subsidize capital incomes with massive tax cuts for investors and businesses alike–in the US no less than $10 trillion in such tax cuts, to which Trump added another $5 trillion in 2018-19. Budget deficits surged to more than $1 trillion. In short, fiscal policy like monetary policy on the eve of the current crisis was rendered largely ineffective for the coming crisis. The global economy is also decidedly much weaker this time around as well, with a global manufacturing recession the case in 2019 and trade wounded by Trump’s global trade war launched in 2018.
What follows is the excerpt from my 2010 book, ‘Epic Recession’. Its themes were picked up and developed thereafter further in my 2016 book, ‘Systemic Fragility in the Global Economy’ concluding chapter. Further excerpts from the 2010 book will follow this posts; and after that the updates in the 2016 book. So here’s Part 1 on liquidity, its role generating excess debt, and what I called at the time in 2010 the ‘debt-deflation-default nexus’.
The Dynamics of Epic Recession
The two preceding chapters addressed static quantitative and qualitative characteristics of Epic Recession. This chapter is concerned with the dynamic characteristics of Epic Recessions—i.e. those characteristics that explain the processes by which Epic Recessions evolve over time.
At the top of the pyramid is the explosion in global liquidity. Liquidity is cash and near-cash forms of liquid assets that can be relatively easily and quickly converted to investment. That investment may take the form of real physical assets, like structures, equipment, inventories of products, etc.; or the form of financial assets, like bonds, commercial paper, stocks, derivatives financial instruments, and so forth. Whichever the form, the point is liquidity is the basis for investment. It is the source for issuing credit and thus debt. The extension of credit becomes the debt of the borrower of that credit. Liquidity enables banks to issue loans, corporations to issue bonds, speculators to purchase derivatives, etc.
There are several major sources responsible for the exploding liquidity in the U.S. and global economy over the last several decades. All have contributed to the growing volume of liquidity, such that today there is now a flood of liquidity awash in the global economy. The unprecedented surge in liquidity is the source of credit and corresponding debt accumulation. And it is that credit and debt acceleration that has fueled and enabled the run-up in speculative investing to historic, record levels in turn.
One source of the global liquidity explosion has been the U.S. central bank, the Federal Reserve. Since the dollar became the de facto global currency in 1944 (and the virtual de jure global currency since 1971 when the last fiction of a gold standard was abandoned), U.S. monetary policies for more than half a century have been injecting trillions of dollars into the U.S. and global economies. That’s trillions of dollars of excess liquidity that has accumulated globally in the hands of investors public and private, corporate and sovereign, individual and institutional.
It represents a record volume between $20 and $40 trillion of investible money capital that cannot lie idle and must find an outlet.
The Fed enables the expansion of credit in the commercial banking system by means of buying government bonds back from the banks, changing their minimum reserve requirements of those banks, or loaning money to individual banks directly through the Fed’s ‘discount window’. Since December 2007 it has added a fourth new ‘tool’ for injecting liquidity into the economy called targeted ‘auctions’ designed to provide massive bailout funding for banks, shadow banks, and even non-financial corporations. By means of these special auctions over the last two years, the Fed has injected or committed to provide between $2 and $11 trillion, depending on which accounting approach one chooses. But Fed actions since December 2007 constitute only the latest of a long string of liquidity pumping actions by the Fed.
When there’s a recession, the Fed injects liquidity. That occurred in response to the normal recessions that happened in 1966, 1970, 1973-75, 1980, 1982, 1990, and 2001. In addition, every time there’s a financial instability event, the Fed injects still more liquidity to offset banks’ anticipated losses to keep them from insolvency and lending. That occurred 1987-1988 in response to the stock market crash of 1987; in 1989-1992 to bail out the savings and loan and junk bond markets; 1997-1998 to rescue the Long Term Capital Management hedge fund and Asian banks and financial institutions with ties to U.S. banks; in 1999 to counter fears about computers coming to a stop with the change in the millennia (a phony mini-panic called the Y2K or ‘year 2000’); 2000-2001 to counter the tech-driven stock market bust, and 2002-2004 to keep the housing market going as the rest of the economy faltered. On occasion the Fed has even injected liquidity to assist Presidents in their election bids or war policies, such as in 1971-72 in the case of Nixon and 2003-04 for George W. Bush.
In contrast to its long term policy of pumping liquidity into the economy, the Fed has done little in the way of successfully retracting that same liquidity after recessions, major financial instability events, or following the accommodation of Presidents’ political demands. The roughly twenty years of Fed ‘net’ liquidity injections into the U.S. economy, from 1986 to 2006 under the chairmanship of Alan Greenspan, has become known as the Greenspan ‘Put’. Since 2007, an even greater net liquidity injection has occurred under its current chairman, Ben Bernanke. It will no doubt eventually become known as the ‘Bernanke Put’—i.e. a far greater amount in a much shorter period of time.
The Fed’s decades-long, pro-liquidity policies not only contributed to a build-up of liquidity within the U.S. economy, but did so throughout the global economy as well. To the extent easier credit from the Fed was accessible to U.S. banks with operations and dealings abroad—which has become the case increasingly since the early 1990s—some of that Fed-provided liquidity to those U.S. banks was undoubtedly diverted offshore. Similarly, loans to non-bank U.S. companies with foreign subsidiaries no doubt resulted in liquidity flowing offshore to those subsidiaries, as well as for those multinational companies’ growing acquisitions of additional offshore assets since 1990. The latter is called Foreign Direct Investment, or FDI, and that too has been fueled by Fed monetary policies’ creating excess liquidity in the system.
Other U.S. government policies have also contributed to the growth of dollar liquidity globally. U.S. government policies providing foreign aid to sovereign countries for decades increased the flow of dollars and liquidity from the U.S. into the global system. So did funding of U.S. military bases and operations around the world. And policies of free trade, that resulted in chronic and rising U.S. trade deficits since the 1980s. Trade deficits have meant net annual outflows of hundreds of billions of dollars every year from the U.S. economy since the 1980s, culminating in more than $700 billion trade deficits for four years running during the mid-2000s alone. A further consequence of U.S. free trade policies has been the expansion of U.S. companies’ foreign direct investment, or FDI, which, as previously noted, have transferred additional billions of dollars offshore. Then there’s the major structural changes that have occurred in the U.S. tax system since 1980 that have permitted wealthy U.S. investors, individual and institutional, to shift decades of money capital from capital gains, dividends and interest income into offshore tax havens to avoid tax payments to the U.S.—in dozens of small or island nations from Cayman Islands to Seychelles to Vanuatu to Switzerland and beyond. All the above developments have combined to enable a flow of trillions of dollars into offshore venues—going into foreign central banks, private banks and financial institutions, offshore hedge and investment funds, personal and corporate accounts in tax havens, etc. Thus, while the Fed has obviously been a major contributor to the steady growth of liquidity in the U.S. and the global economy, it hasn’t been the only source. U.S. government military, trade and tax policies have contributed as well.
In addition to the Fed, and U.S. military spending, trade and tax policies, at least two other major forces have additionally contributed to the historic expansion of liquidity worldwide in recent decades. One is what is sometimes called the ‘global savings glut’.
There are different interpretations of the meaning of the ‘global savings glut’. For former Federal Reserve chairman, Alan Greenspan, the ‘global savings glut’ represents the accumulated reserves held by foreign central banks, private banks, and investors.
It is the global savings glut, as Greenspan defines it, that caused the flood of liquidity into the U.S. between 2002-2005 that drove down mortgage interest rates, which in turn caused the subprime market boom. It wasn’t the Fed lowering short term rates to 1% and keeping them there for nearly two years that caused the speculative boom in residential housing. The housing bubble occurred worldwide, not just in the U.S. It was the excess global liquidity that flooded into the U.S. housing market that was the culprit. The cause therefore was the glut—sometimes referred to as another sanitized term, ‘global imbalances’—that was responsible. The bubble was thus beyond the Fed’s or any central bank’s control. But even if it is true, as Greenspan maintains, that the post-2002 boom occurred simultaneously in many global markets not just the U.S. and the Fed therefore could not have been responsible; even if one were to agree with him that the global savings glut washing back onto U.S. economic shores circa 2002 was the sole cause the U.S. subprime housing bubble—what then explains the origins of that ‘global savings glut’ itself?
First, data is irrefutably clear that the U.S. housing price bubble began in 1997, not in 2002. The speculation in residential housing markets preceded the Fed’s 2002 lowering of rates as well as the alleged 2002-05 foreign investment inflows by at least five years. Both the Fed’s low 1% rates and the simultaneous global liquidity inflows contributed to the subprime housing bubble. But neither was the originating cause. The subprime boom of 2002-2005 was just the culminating phase of the housing bubble. What set off the start of housing speculation and the beginning of the run-up in housing prices around 1997-1998 is the fundamental question Greenspan must answer, but doesn’t. In addition, Greenspan must explain further why the dot.com technology stocks bubble originated around 1997 as well, and why the speculative bubble in Asian currencies that led to the Asian financial meltdown in 1997-1998 (that in turn spread to Russia and Latin American economies, and required the bailout of the big hedge fund, Long Term Capital Management in 1998) occurred as well circa 1997-1998? What was beginning to happen circa 1997-1998 that precipitated all three bubbles? Was it just coincidental that all three speculative bubbles commenced around the same time? Or is there a common thread and origin to all three?
The global savings glut begins with the river of dollars with which the U.S. flooded the world for decades as a direct consequence of its monetary, fiscal, and military policies. But that flow of dollars was only the start—a kind of priming of the global liquidity pump. The ‘global savings glut’ has been equally important factor contributing to the global liquidity explosion. The glut is the product of the past three decades of unprecedented profits, income and wealth accumulation. But it is not faceless ‘savings’ or ‘reserves’, as Greenspan and others call it. Those are misleading terms that function for the purpose of obfuscating a deeper meaning. The ‘glut’ is in fact the accumulation and concentration of income and wealth among certain strata of investors worldwide, taking the form of excess money and credit capital, that is now increasingly seeking out and flowing into speculative investment opportunities globally at an increasing rate. The glut therefore has a face: the rising global ‘investor elite’ of individuals, funds, investing institutions, corporations, banks, shadow banks and central banks.
The income-wealth accumulated by that elite more than three decades now has derived from both real asset and speculative asset investment, but increasingly in recent years from the latter and decreasingly from the former. The real asset investment has concentrated in manufacturing and infrastructure investment in the so-called ‘BRIC’ countries—i.e. Brazil, Russia, India, and especially China—and to a more limited extent in certain industries like energy extraction and commercial building the petro-economies. The rising share of accumulation of income and wealth from speculative investing has come from commodities, oil, gold, metals, currency and stock speculation, futures and options trading, land and commercial properties, funding of mergers and acquisitions, infrastructure bonds, buying and selling in secondary markets, securitized financial assets, credit insurance, and a host of other derivative based financial instruments.
Once again, the ‘glut’ is therefore not really about ‘savings’ or foreign investors’ reserves. That is a misnomer for what is in essence a concentration of income and wealth among a global strata of investors with a unique control of new, as well as old, forms of money capital. The glut represents global income inequality—not between nations but between the investor classes within most nations and their non-investor countrymen. This investor elite of course includes members in the advanced economies of North America, Europe and Japan, just as it does those in Singapore, Hong Kong, Dubai, Soeul, Shanghai, Rio, Bangalore and elsewhere. It is not about third world or ‘emerging markets’ investors. It reflects a global transformation of capital, as well as a restructuring of the various constituent elements of the class in control of that capital.
In addition to the Fed and U.S. military spending, trade and tax policies, and the global savings glut, there is yet a fourth major source of the global liquidity explosion. The policies of the Fed and U.S. government that since 1945 flooded the world economy with dollars, and the policies that since 1980 set in motion the concentration of income on a global scale do not, by themselves, fully account for the explosion of liquidity of recent decades. That record liquidity was also the consequence of the revolution in credit creation that has been unleashed in large part by the shadow banking system.
Normally liquidity is created in the banking system when the central bank of a country injects money into its banking system. That money injection increases the reserves on hand in the banks with which to extend credit to borrowers. As the banks lend the money to customers the money supply increases in the economy. The actual process of credit creation occurs when the private banks actually extend loans—i.e. credit—to borrowers who subsequently make investments. This describes a traditional process by which a central bank (Fed) determines the amount and timing of liquidity injection and credit. But that liquidity creation process has been giving way progressively over recent decades to a different kind of credit creation system that is growing relatively more independent of the central bank and whatever action it may take. Central banks’ injection of money into the banking system may lead to an increase in credit as banks loan out the money to borrowers. But banks’ credit extension is not limited to this process. Banks and shadow banks provide credit, but have been doing so increasingly independent of the money supply and central banks (e.g. Fed) money supply management processes. In other words, credit is becoming unhinged from money.
In the new system of credit, financial instruments themselves are used as the basis of credit extension and thus borrowing and debt. For example, when a financial instrument, like a collateralized debt obligation derivative, is created based on a subprime mortgage, and the market value of that derivative rises, that increased market value is then used as the basis for issuing further credit to purchase yet more financial instruments. Investments are not made based on the central bank increasing or decreasing the reserves banks may have on hand. Loans and credit extension have now little or nothing to do with banks’ existing levels of loanable excess reserves. Because these financial instruments are tradable immediately on secondary markets short term, they are more or less ‘liquid’; that is, can be used like money to purchase other financial assets. And as such financial instruments grow in volume and value, they are in effect increasing the overall liquidity within the system. Such credit financing is especially appropriate for investing in financial instruments. As the value of financial instruments rises (which presumes a continued rise in their price), it enables investing in still more similar financial instruments. The process would not be possible without the development of ‘securitization’ and highly liquid secondary markets for speculative financial instruments. In a sense, therefore, securitization and secondary markets create liquidity for financing still additional speculative investing.
A couple additional concrete examples: credit default swaps (CDS) derivatives and ‘naked short selling’. With CDS an investor may speculate that a company will default, so he ‘buys’an insurance contract (a CDS) to protect against that failure. But the speculator does not actually ‘buy’ in the sense of putting real dollars up to purchase the CDS contract. At most, he may put up a very small share of the actual cost of the CDS and leverage the rest—i.e. owe it as debt. All derivatives financial securities are in a similar way ‘leveraged’. That is, credit (and debt) far beyond what is invested in real money is extended to the borrower. Credit, and corresponding debt, is created independently of bank reserves and Fed efforts to manage levels of bank reserves.
The case of what is called ‘naked short selling’ of stocks by speculators is even more blatant. Short selling has been around for some time. It is associated with stock selling. Professional stock traders borrow to buy stock at its current price with the expectation of selling it later once the price declines and pocketing the difference as pure speculative profits. The borrowing incurs a short term debt for which an interest charge or fee must be paid. The borrowing also creates downward pressure on the stock price in question.
‘Naked’ short selling takes the speculative practice one step further. ‘Naked’ means traders don’t even borrow the funds in order to buy. Naked short selling amounts to buying stock without putting a penny down—i.e. 100% leveraging. Naked short sales amount to selling something you never owned. In other words, it’s another extreme form of speculation, more like pure ‘betting’ or like ‘betting’ when purchasing credit default swaps than buying and selling of a stock per se. Naked short selling results in even greater downward pressure on a stock’s price. Naked short sellers played a major role in the collapse of Bear Stearns, Fannie Mae, and Lehman brothers in the intensifying financial crisis during 2008, as speculators turned increasingly toward ‘naked’ short selling.
Naked short selling has the eventual result of causing a rise in corporate debt for those companies targeted by the short sellers. To the extent short selling drives down stock prices it makes it increasingly difficult for corporations to raise capital by means of stock issuance. That forces them to borrow and increase their debt, or to forego real investment activity altogether, which often means a reduction in real investment and jobs. As the recent financial crisis spread globally, the practice of short selling was banned or severely restricted in many places in Asia, Australia, Europe—but not in the U.S. Naked short selling might also be considered a form of ‘financial cannibalism’, in that investors in shadow banks prey upon investors in real asset institutions like non-financial companies.
As shadow banks, hedge funds and their investors have been particular active in naked short selling during the recent financial crisis. According to the premier market research source tracking the hedge fund industry, Hedge Fund Research, hedge funds involved in short selling (including the increasing practice of naked selling) accounted for about 40% of the $3 trillion in global hedge fund assets in 2007-08.
Investing in CDSs and naked short selling represent ‘investment as betting’ and thus an extreme form of speculative investing. But they would not be possible without the new forms of liquidity creation with which they are financed. These new forms of speculative investing typically often result as well in an increase in debt levels for companies with real assets and therefore negative affect levels of real asset investment in those companies. On the other hand, profits and returns to speculators are often significant. Driven by asset price inflation, speculative profits are often several magnitudes greater than profits from investment in real assets, so long as prices continue to rise. Speculative profits also have the added enticement that they can be realized in a much shorter time period. That capital-profit turnover time makes such investments further attractive. And so long as the price of the asset continues to rise, the expectation of profitability is more certain compared, say, to investing in real assets and real products for which demand may or may not materialize at all. Despite the frequency of financial crises in the past twenty years, it appears that profits from speculative investing have grown significantly faster than from real asset investing. For every speculator who waits too long to exit a bubble, and thus loses capital, there are on net more that gain from the run-up and price bubble. That net growth in profits and wealth in turn adds to the ‘global savings glut’ and global pool of liquidity available for subsequent investing.
Financial deregulation has increased the rate and geographic spread of speculative investing. It opened up and accelerated global capital flows. It permitted and stimulated the growth of shadow banking-financial intermediaries as the prime distribution channels for speculative investing and allowed the regulated banking system to play in those same channels and markets. But it did not create the fundamental requirement for speculative investing. That fundamental requirement was the explosion of liquidity. Without that liquidity, and the new forms of leveraging that accompanied it, there would be nothing to speculate with. The new forms of leveraging that expanded it, the new financial instruments that productized it, the new forms of institutions that distributed it, and the new markets in which those financial instruments were sold—are all predicated on the creation of a massive global pool of excess liquidity.
To sum up, there exists today a massive global pool of liquid and near liquid money capital that must find an investment outlet. Estimated roughly in the range of $20 to $40 trillion worldwide, it is thus so excessively large that it cannot find sufficient real, fixed investment opportunities to absorb all of it. There is far more liquidity than real physical asset investment opportunities—notwithstanding the infrastructure growth in China, India, Brazil and the like. More critically, real asset investment may not be as profitable as speculative investing in any event. Meanwhile, that liquidity pool cannot and will not remain idle. It is therefore prone to seek out new price driven speculative opportunities, which are more easily and quickly exploited, with faster turnover and often with greater returns, than physical asset investment in structures, equipment, inventories and such.
The Global Money Parade
The flooding of both the U.S. and global economy with U.S. dollars, the global savings glut, plus new forms of credit creation have produced a historic growth in available liquidity in the global economy. The volume of liquidity is only part of the story, however. Where that liquidity resides and to what uses it is being put are equally important. In what institutions is that liquidity ‘deposited’? In what asset types is it invested? Who are the investors—institutional, corporate, and wealthy individual?
How much of the estimated $20 to $40 trillion in outstanding liquidity today resides in the global network of commercial banks, like J.P Morgan Chase and Bank of America? How much of it in those institutions referred to as ‘shadow banks’ or financial intermediaries—i.e. the investment banks like Goldman Sachs and Morgan Stanley? Giant hedge funds, like Citadel, and the hedge fund sector, which grew from just several hundred in the 1990s to more than 10,000 by 2008 with nearly $2 trillion in assets? Private equity firms like Carlyl or Blackstone that controlled several trillions more at their peak? Finance companies like GMAC and GE Credit? GSEs like Fannie Mae and Freddie Mac? Or in the allegedly more conservative investing institutions like the $4 trillion money market funds, the multi-trillion dollar pension funds, emerging market funds, sovereign wealth funds of the oil rich economies, etc.?
As noted in a previous chapter, for the U.S. alone it is estimated the network of shadow banking institutions by 2007 accounted for more than $10 trillion, about equal to the assets of the commercial banking sector. And the U.S. share of the global shadow banking network is probably no more than 40% at most. Moreover, the commercial banks have over the last decade merged with shadow banks in various ways—at least the largest of the commercial banks. So it makes less and less sense over time to even refer to the distinction of the two banking sectors. Commercial banks have turned increasingly to the higher profitable speculative forms of investing. And they have long funded the shadow banks to significant extent, set up their own hedge funds and private equity firms, established private bank operations for their wealthiest clients, and acted in part like shadow banks in fact if not in name. So part of the big commercial banks must be considered a segment of the shadow banking sector as well, and a significant amount of their lending activity has no doubt been increasingly speculative.
A testimony to that latter point is the huge amount of lending by commercial banks that has occurred since May 2009 to speculators in foreign currency and emerging markets. The banks borrow from the Fed at 0.25% and loan at substantially higher rates to clients speculating in Asian, Latin American, and Russian currencies. Less involved in highly speculative ventures as general rule are the 8200 or so smaller regional and community banks and thrift institutions in the U.S., although to the extent this group has participated in financing subprime mortgages and highly leveraged commercial property deals they too have forayed into speculative investment in major ways. All these represent a short list of institutional ‘loci’ in which much of the world liquidity resides. Add to these institutionals investing on behalf of clients (as well as on behalf of themselves as institutions), very wealthy individuals who invest directly themselves rather than via institutions, and the thousands of corporations that, to some degree, also invest directly with their companies’ retained earnings.
These investors—individual, corporate, and institutional alike—have been shifting their liquidity increasingly in recent decades into speculative investments; that is, investment opportunities of a short term, price-driven asset nature rather than in longer term enterprise, equipment, and structures that payout with a longer, amortized stream of income. That is, investments in financial asset securities. The profits are greater due to the price volatility, the costs are lower since most speculative investing is in financial securities with no costs of production and low cost of sales, there are no potential supplier bottlenecks, distribution is instantaneous and the market size is global, the turnover in profitability is as short as the investor chooses, and the short term risk is less because the assets can be quickly resold in secondary markets most of the time.
These immense relative advantages in costs of speculative investing in financial securities, compared to investing in real physical assets, combined with the possible quick returns and the potential for excess price-driven profits, together result in a kind of ‘global money parade’ that sloshes around markets internationally seeking speculative opportunities—a financial tornado that causes speculative bubbles wherever it touches down.
That parade consists fundamentally of those investors globally that have become greater in number than ever before, controlling a share of total global liquidity that is at historic record levels, and that exhibit a growing preference for speculative investing. And where has most of the liquidity they control been going? Into foreign exchange trading, over the counter derivatives trading, buying and selling of securitized asset backed securities (ABS), collateralized debt (CDOs), collateralized loans (CLOs), residential and commercial mortgages (RMBS, CMBS), credit swaps (CDSs), interest rate and currency swaps, futures and options trades of all kinds, leveraged buyouts (LBOs), emerging market funds, high yield corporate junk bonds and funds, into stock market speculation world wide, into short-selling of stocks, landed property speculation, and global commodities of all kind from food and metals to gold and oil. A global money parade marching to and fro across global financial markets, from one short term speculative opportunity to another, at times exacerbating asset price volatility, at other times precipitating it, and sometimes even pushing asset inflation to the level of financial bust.
An important dynamic characteristic of Epic Recession is that it is typically preceded by a proliferation of multiple asset bubbles fueled by the global money parade that more or less mature in tandem. When one or more of the bubbles overextends and then collapses, it quickly precipitates similar collapses in other bubbles. The magnitude of the financial bust thereafter evokes a credit contraction well beyond that which may occur in a normal recession. How deep, fast and widespread the contraction depends in part on the degree of financial fragility that has developed at the time of the financial bust; and in part on the degree of consumption fragility as well. Both forms of fragility are a function of debt, debt servicing capability, and income. As debt levels unwind in the Epic Recession, the subsequent trajectory of the Epic Recession depends thereafter on the rate of deflation and defaults, and in turn on the ability or failure of government policies to check and contain the deflation-defaults and/or to reduce debt levels that exacerbate the deflation-default levels and rates.
*
Note to readers: please click the share buttons above or below. Forward this article to your email lists. Crosspost on your blog site, internet forums. etc.
|