


This past week Donald Trump appeared before the United Nations Assembly in New York. In typical Trump style, he immediately launched into bragging about his accomplishments. Like most of his recent public appearances, it was a campaign speech directed to his political base. He proclaimed to the Assembly he had achieved more in his first two years than had any other president in a like period. The claim elicited laughs from the audience, which Trump would brush off later in a press conference saying “We were laughing together, they weren’t laughing at me”. Sure, Donald. That’s what happened!
In the course of his over-the-top, self-congratulatory announcement he said the US economy had grown faster in his first two years at the presidential helm than in any administration before during a like period, he had reduced unemployment to the lowest rate ever in the US, and his policies have produced record wage gains for American workers. The reality, however, is none of the above is true.
What’s somewhat ironic is that Trump’s lies and misrepresentations about the performance of the US economy are buttressed in part by official US statistics. He didn’t have to lie outright. It is often forgotten that statistics are not actual data. They are not numbers and facts that are actually observed, collected and reported in their original form. Statistics are ‘operations’ on and manipulation of the actual data, i.e. the real numbers. Statistics are created numbers. The operations and manipulations are often justified by arguing they improve the data, reveal it more accurately. Sometime this is so. But too often the manipulations are designed to boost the raw data to show the economy is doing better than it actually is (i.e. GDP and growth is better than it really is); or reduce the numbers to show the same effect (i.e. inflation is not as high as it really is); or that wages are rising for everyone when in fact they may not be for most.
In Trump’s UN speech, we therefore find an ironic congruence of typical Trump imagined facts that don’t actually exist and official government statistics that are not lies per se but are nonetheless distortions and misrepresentations created by the many complex, often convoluted operations and manipulations performed on the actual facts.
Who’s lying? There are different ways to lie. Trump does it crudely and blatantly. Official stats often do it cleverly and opaquely. The debunking of Trump claims before the UN about US GDP, US unemployment, and US wages in what follows shows how the crude and the clever often coincide.
Trump’s ‘US GDP Is Growing at Record Rate’ Claim
Let’s take US economic growth or GDP (Gross Domestic Product). Trump claims the last quarter’s GDP growth of 4.2% was the best ever. Apart from the fact that the US economy has grown quarterly faster many times before, the 4.2% is a misrepresentation—even if it’s the official US figure. Here’s why:
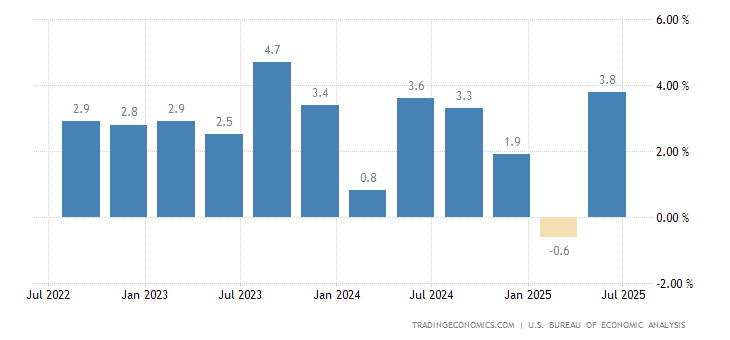
GDP is defined as the total goods and services produced in a given year that is sold in that year. So prices are associated with the output of actual goods and services produced. But real growth of the economy should not include prices. Therefore prices are adjusted out from what’s called the ‘nominal GDP’ number. Nominal GDP last quarter was 5.4%. Trump’s ‘real GDP’ number of 4.2% means inflation was 1.2% for the period, according to the ‘GDP Deflator’ price index that’s used to adjust GDP for inflation.
But does anyone really believe inflation was only 1.2%? No one that was paying for double digit hikes in insurance premiums and copays during the quarter, or a dollar plus more for a gallon of gasoline to get to work, or who has had to pay rent hikes by their landlord of 20% or more, or is paying higher local property taxes and fees, or has opened their utility bill envelopes lately. What wage earning household believes inflation is running at only 1.2%? And if inflation is higher than that, then the adjustment for inflation to the 5.4% nominal GDP results in a ‘real GDP’ of far less than Trump’s official 4.2%.
So why is inflation so underestimated, resulting in real GDP being over-estimated at 4.2%?
One reason actual inflation is much higher is that government statisticians arbitrarily assume that consumers are buying more online where goods are cheaper, even though the government itself has said its procedure for estimating online sales is a ‘work in progress’ and at best a guesstimate.
Another reason inflation is underestimated at 1.2% is government bureaucrats at the Commerce Dept. (responsible for estimating GDP) assume that the quality of goods sold today is better than in the past. So they reduce the actual price that households really pay for the product in the marketplace and assign a lower, fictional price when they calculate the 1.2% GDP Deflator.
Or they assume that rents aren’t really rising as fast as they are in fact, because their models definition of rent includes homeowners with mortgages supposedly paying a ‘rent’ to themselves as well. That’s called ‘imputed rents’. Of course it’s nonsense. Homeowners don’t pay themselves rents. But when you assume they do, it means 100 million homeowners pay rents to themselves that barely changes year to year, while true renters keep paying 20% or more. When rents are then ‘averaged out’ for both homeowners and real renters, the actual rent inflation comes out much lower as a contribution to total GDP inflation. There are dozens of other techniques by which the ‘GDP Deflator price index’ is manipulated to come up with only 1.2% inflation—and thus overstate real GDP to 4.2%.
The US has other inflation indexes it could use to adjust for real GDP more accurately, but it doesn’t use them. It prefers the ‘lowball’ GDP Deflator price index. The Consumer Price Index, CPI, is closer to the actual inflation, at 2.7%. If the CPI were used to adjust nominal GDP, the 4.2% real GDP would be only 2.7%. The US Central Bank, the Fed, uses yet another index called the Personal Consumption Expenditure or PCE. That’s at 2.2%, also much higher than 1.2%. If the PCE was used real GDP would be 3.2% not 4.2%. So the most conservative and lowest inflation indicator is used to estimate real GDP. And that’s how Trump gets his phony 4.2% real GDP—i.e. his ‘greatest in history’ US growth number.
But even the CPI, at 2.7%, underestimates inflation. It uses what’s called the ‘chained index’ method for calculating annual inflation rates. That simply takes the actual current year CP inflation and averages, or ‘smooths’, it out with the preceding years of inflation. The resulting ‘averaging of averages’ is a lower than actual annual rate of inflation.
There are other problems with GDP that further reduce the 4.2% assumed real growth rate. Periodically the government changes its definition of what makes up the GDP. The re-definitioning often results in a higher GDP than previous. It’s not a real growth increase, just growth by definition. This redefining GDP is going on globally as well. In Europe for example they now include drug smuggling and services from brothels as contributing to GDP. Of course, to estimate these ‘services’ contributions to total GDP one needs to get a price. Drug peddlers don’t tell the government what they’re selling their heroin or cocaine for. And it’s doubtful that government statisticians stand outside the brothels or interview street walkers to determine the price they charged their ‘johns’. So government statisticians simply make up the numbers and plug them into their GDP calculations. One of the most egregious examples of GDP growth by definition occurred in recent years in India. By redefining GDP it doubled its value overnight. The US engaged in its own form of GDP redefinition a few years back as well, when the economy recovery just couldn’t get off the ground and stagnated in late 2012.
Back in 2013 US GDP was arbitrarily redefined to include categories that had never been included—like the estimation of the value of company logos, trademarks, and intellectual property that never gets sold. What was for decades considered a business cost and not an investment—i.e. research and development—was now added to GDP figures. This change to GDP raised it by $500 billion annually starting in 2013. It’s no doubt higher today. That’s about 0.2% to 0.3% artificial boost to GDP just by redefining it. The point is no one knows the price of new categories like logos, trademarks, and the like. Government bureaucrats simply make them up (like they do ‘imputed rents’) and add them to the GDP totals.
What this all means is that Trump’s boast of his record 4.2% GDP is not really 4.2%, but something far lower, probably around 2%. That’s only a few tenths of one percent higher than under Obama, when GDP averaged around 1.7%-1.8% annually.
Trump’s bragging of historic growth misses another really important problem with GDP: It avoids the question of who benefits from the 4.2% (or 2% in fact). Who gets the income generated from the 4.2%, or 2.7%, or 2%, or whatever. The flip side of the 4.2% GDP is what is called National Income. National Income is what the GDP creates for businesses, investors, wage earners, etc. who make the goods and services that create the National Income. But to whom is the 4.2% national income equivalent of GDP really benefitting? Is it the roughly 130 million wage earners? Or is it the owners of capital, their shareholders and managers, the self-employed? How much do those who make the goods and services—i.e. wage earners—get of the National Income? And is the share of total National Income they are getting distributed more or less equally among the 130 million, or is it skewed to the high end of the wage and salary structure, i.e. the top 10% of wage and salary earners—i.e. the business professionals, tech sector engineers, high paid health professionals, etc.?
Trump’s ‘Wages Are Rising Fast’ Claim
Trump brags that wages are rising at 2.9% a year now. However, that 2.9% is for full time permanent employed workers only. (Read the fine print in the Labor dept. definitions). Excluded are the roughly 50 million part time, temp, on call, under-employed and unemployed. And the wages are rising nicely claim may include extra hours worked—i.e. more overtime for the full time employed and extra part time jobs and gig jobs for the part time and temp employed. Workers’ earnings may thus rise due to more hours worked, not actual wage rate increases. Independent reports show, moreover, that employers are giving raises mostly in lump sum and bonus payments instead of wage rate per hour hikes. That way they can discontinue paying the lump sums and bonuses more easily in the future.
Apart from applying only to full time permanent employed, the 2.9% is a distortion for tens of millions of workers as well because it is an average. It represents those at the top of wages and salary—the best off 10% of tech, healthcare, and select other occupations getting most of the 2.9%. They may be getting 4% and more. Those in the less preferred occupations get far less than 2.9%, or nothing at all in wage hikes. The average is 2.9%. So at least 100 million wage earners are getting far less than 2.9%–which then needs adjusting for a much higher than reported inflation rate. The result is a real wage gain for 100 million or more that is negative, not 2.9%. But Trump doesn’t bother to explain that. The devil is in the details, as they say.
Here’s another problem with the official government wage data reported in the GDP-National Income numbers you probably never heard of. It reduces the share of wages in National Income even more than is reported officially. According to GDP rules, 65% of the profits of unincorporated businesses (i.e. sole proprietorships, partnerships, S-corps, etc.) are considered wages in the National Income data. That’s right. Business Income—aka profits of non-corporate business—is considered ‘wages’ and added to the totals for wages in the GDP-National Income calculations.
The biggest misrepresentation of wage gains, however, is due to the underestimating of true inflation. What matters is ‘real wages’, what wages can actually buy. Trump’s 2.9% wage increase is not adjusted for inflation. It’s not ‘real’. If CPI inflation is 2.7% and nominal wages are rising at 2.9%, then real wages are actually stagnant at best at 0.2%. And if inflation for the more than 100 million primarily wage earning households is really around 3.5%–given recent hikes in oil and gas prices, rents, healthcare costs, utilities costs, local taxes and fees, etc.—then real wages for the 100 million or so are actually falling by 0.6% or more. Just as they have been falling every year since 2009.
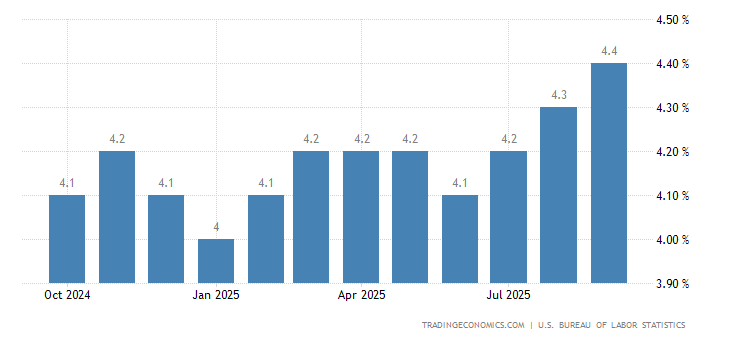
Trump’s ‘Unemployment is at an Historic Low 3.9%’ Claim
Like the numbers for GDP, inflation, and wages there are problems associated as well with Trump’s jobs data claim in his UN Speech. The 3.9% unemployment rate Trump declared as ‘the lowest it’s ever been’ refers to the unemployment rate for only former full time permanently employed workers. (The lowest ever rate was 1.9% in 1944, by the way). The 3.9% excludes the 50 million part time, temps, on call, i.e. what’s called the underemployed. If the underemployed are included the unemployment rate rises to about 8%–in other words more than double the 3.9% for full time permanent workers only.
But both the 3.9% and 8% are still underestimates of the true unemployment in the US at present. In the US, someone is considered unemployed only if they are ‘out of work and looked for work in the preceding 4 weeks’. Otherwise, they’re considered part of what’s called the ‘missing labor force’ and not counted in the 3.9% (or 8%). (Note that being unemployed in the US also has nothing at all to do with whether or not you’re getting unemployment benefits).
Another problem with the 3.9% is that it is based in large part on gross and arbitrary assumptions by government statisticians as to the number of new jobs that were created due to ‘new businesses being formed’. The government assumes hundreds of thousands of net new businesses are created every month, each with a number of employees. But the government just makes an assumption of how many businesses and number of employees. It then adds these assumed numbers to the actual numbers of unemployed counted for a recent month. Worse still, this assumed number of new jobs is based on businesses and jobs created nine months prior to the present. For example, assumed new business formations and jobs back in January 2018 are then plugged into current September 2018 job numbers. That boosts the number of jobs in September, to get the lower, 3.9% unemployment rate. And we’re talking about tens and sometimes hundreds of thousands of net jobs from nine months ago being added to current unemployed totals in the present. In short, boosting job numbers (and thus reducing unemployment to 3.9%) from ‘New Business Formation’ assumptions nine months prior is a way of padding the numbers.
Another set of problems in estimating the 3.9% occurs due to how the Labor Dept.’s household surveys are conducted to provide the 3.9% unemployment rate. The government surveys 60,000 households a month by telephone. But not everyone has a telephone or responds to a government call to participate in the survey. Typically refusing to participate in such government surveys are inner city youth, workers ‘working off the books’ and receiving cash instead of wages, most of the 10 undocumented workers in the US, itinerant workers without cellphones, and others. In other words, how the government surveys to get its estimated 3.9% unemployment rate is not sufficiently accurate either.
There’s an even greater gap in government estimations of unemployment. There’s still millions more who are not counted at all. Millions of workers in recent years have dropped out of the labor force altogether. Remember, if you’re not working or looking actively for work you’re not even in the labor force. Your ‘joblessness’ is therefore not even considered in calculating the unemployment rate. You may be jobless but you’re not unemployed, given the oxymoron US definition of unemployed. And the number of those who have dropped out of the labor force altogether, and thus not considered in calculating the unemployment rate, in the past decade number in the millions!
There’s what’s called the ‘Labor Force Participation Rate’ (LFPR). It is the percentage of the working age population that is employed or else unemployed and actively looking for work. That’s about 58% of the potential working age workforce in the US at present. But before the 2008 crash the percentage or LFPR was 63%. So 5% of the labor force has somehow ‘disappeared’ during the last decade. They’re not factored in the unemployment rate calculations. They may be without jobs, but they’re not considered unemployed. That 5% decline in the LFPR represents 5% of the total civilian labor force, which is about 165 million. So 5% of 165 million is a massive number of another 8.25 million. Having dropped out of the labor force, it is safe to assume most are unemployed or only temporarily or partially employed. About a million of them were able to arrange permanent social security disability benefits.
Mainstream and government economists try to explain away this massive drop out of the labor force by saying it reflects a growing number of retiring baby boomers. But that’s questionable, since the fastest growing numbers of people entering the labor force today (not dropping out) are workers older than 65 and 70, who are returning to work because they cannot afford to retire on the paltry benefits, 401k pensions, and IRAs they have, or the minimal savings they were able to accumulate since the 2008 crash.
To sum up: If to the ranks to the roughly 6.5 million full time permanent unemployed (the 3.9%) are added the 4% or so underemployed and discouraged, there are officially about 8% of the 165 million that are unemployed. That rate is double Trump’s claim of only 3.9%. But add a further 2%–i.e. the ‘hidden’ unemployed not counted in the underground economy, plus the mis-estimation of unemployment due to government survey methods, plus the million or so who have gone on social security disability, plus the 8 million more who have dropped out of the labor force altogether—and the true unemployment rate is somewhere between 15% and 18%, not 3.9%. But you won’t hear that from Trump, or for that matter from government bureaucrats that create the low ball number, or from the media and press that favorably promote the lowest possible number.
Trump’s ‘Stock Markets are at Record Highs’ Claim
In this case Trump is also lying. He claims that he is totally responsible for the current record highs in the Dow, S&P 500, and Nasdaq stock markets in the USA. Record levels in all the three major stock markets are of course fact. That is not the locus of Trump’s lying. The lie is he claims his economic policies, especially tax cuts and military spending and business deregulation are the direct cause of the record stock market levels. While it is true that Trump’s investor-business tax cuts have contributed in 2018 to boosting stocks. The cuts have reduced US budget revenues by more than $300 billion in just the first half of 2018. The tax cuts have thus far provided an artificial windfall to corporate profits of at least 20%, according to numerous studies. Other studies show that 49% of the tax-profits windfall has gone into corporations buying back their stock and paying more dividends to shareholders. Estimates by Goldman Sachs bank research and other sources are that $1.3 trillion will be spent by corporations on buybacks and dividends. That is a major factor why stocks just keep rising this year regardless of concern about trade wars, emerging markets’ currency collapse, Fed raising rates, the spread and deepening of recessions in key global economies, etc. Trump’s lie, however, is his taking credit for the entire stock bubble, when in fact a wall of money has been handed to investors and corporations ever since 2009 by continuous tax cutting under Obama, free low interest money provided by the Federal Reserve for six years, and other forms of subsidization or business by the US government, which is now the hallmark of 21st century capitalism in America.
Trump’s tax cuts and spending may be boosting stock buybacks and dividends—that in turn keep driving stock prices ever higher. But this policy has been going on since 2010. Every year since 2010, buybacks and dividend payouts have on average exceeded $1 trillion a year. Corporate profits have almost tripled. The Fed kept interest rates so low for so long that corporations, like Apple, borrowed billions by issuing new corporate bonds, with which to buy back its stock, increase its dividends, and invest massive sums directly itself in the stock market—even as it hoarded 97% of its $252 billion in cash offshore.
Trump thus lies when he takes full credit for the stock market at record highs. Obama and George W. Bush before him actually are even more responsible than he is.
*
Note to readers: please click the share buttons above. Forward this article to your email lists. Crosspost on your blog site, internet forums. etc.
This article was originally published on the author’s blog site: Jack Rasmus.
Jack Rasmus is author of the book, ‘Central Bankers at the End of Their Ropes: Monetary Policy and the Coming Depression’, Clarity Press, August 2017, and the forthcoming book, ‘The Scourge of Neoliberalism: US policy from Reagan to Trump’, 2019, also by Clarity Press. He blogs at jackrasmus.com, hosts the weekly radio show, Alternative Visions, on the Progressive Radio network, and tweets at @drjackrasmus. He is a frequent contributor to Global Research.