The Bull Market and Today’s Financial Crisis. “The Great Crash of 1929”. Will History Repeat Itself?


Last December the Dow Jones dropped slightly, 1,788 points down to 23,327 points, that’s about 7% and the business press reported as if the sky was falling. It has since recovered.
But that was enough to get me thinking. We’ve been in a bull market for over eight years, that’s almost a decade during which time the price of stocks has been climbing to ever higher prices. This run began in 2011 with the Dow Jones at 11,670 and has essentially doubled since then. That’s lovely, but when the bull ends, prices will drop – no one knows when or by how much. When the bull ended in 1929, it was also after an eight year run after which prices dropped by 25%. The impact on people and the economy was devastating. It took close to twenty five years for prices to recover.
To try to understand what this might mean today, I reread the wonderful short history John Kenneth Galbraith wrote in 1954 about The Great Crash. The Atlantic monthly praised his book for its ‘grace and wit’ and it still has it. “A period of financial insanity” he wrote “can be a source of pure enjoyment because nothing is being lost but someone else’s money”.
What does his study of 1929 teach us today? Let’s begin with a short recap.
Since 1922 the stock market had been going up at almost 20% a year. On September 3’rd of 1929 it hit a record high when in closed at 381.2. There was a small rumble in March when the market dropped about 10% but it recovered. However in mid-October and through mid-November there were a series if drops amounting to an overall 25% drop. In addition the drop in stock prices precipitated a decline in business conditions globally. GDP dropped about 15%. Unemployment in the US went from 5% to over 20%. Crop prices fell up to 60%. The crash affected the whole of the western world; the great depression had started. It took twenty five years to recover. There was and still is something fundamentally wrong with a system that is so volatile. It’s one of the reasons Galbraith wrote his book.
 Most of us know that the stock exchange is one way to finance businesses and to reward successful risk taking. It was historically an uncontrolled process until the eighties. In the five years prior to 1987 the market had more than tripled but then there were two market crashes, one in 1987 when the market dropped 22% in a day and a near crash in 1989. As a result, in 1989 President Ronald Reagan created the President’s Working Group on Financial Markets, which still exists. This new working group is generally assumed to meddle with the market and is better known as the Plunge Protection team. You can read more about it in my book. Since that time this group has meddled and continues to meddle with the market behind the scene.
Also, in my book (Chapter 10) there is a section entitled how high can the Dow Jones go? Included is a simple chart which covers the value of the Dow Jones for over one hundred years. It has a wee bump at 1929 when the market boomed and then crashed. The chart has an easy to see trend line that is pretty flat for about 100 years up until the mid-eighties. Then it soars! Why?? While the Dow Jones is at 25,000 as I write this, a simple straight line projection from the pre eighties suggests it should be at about 2,000 today. Since it’s not, we need to understand why. I can’t explain it. The closest thing to an explanation is that this time the peak is different but that is a classic fool’s explanation.
It’s such a classic explanation that it’s the title of a book; This Time is Different; Eight Centuries of Financial Folly. The two authors state in their preface that this time is never different because we have always “been here before.” Carmen Reinhart is a professor of economics at the University of Maryland who honed her skills on financial crises at Bear Stearns and her coauthor is Kenneth S. Rogoff, Professor of Public Policy at Harvard.
One possible explanation that this time is different has come and gone; the dot com craze. During the bull market of the late 1990’s technology driven stocks dominated over a five year span of exponential growth. NASDAQ was the home of many internet companies and it rose from 1000 in 1996 to 5000 in the year 2000. Money was pouring into companies that had never made a profit. This was all new territory moving into all new technologies. The market peaked on March 10 2000 having doubled in the last year. By the end of the next year a majority of the newly funded dotcom companies had folded. Trillions of dollars of investment capital had evaporated. The NASDAQ market crashed to just above a thousand in 2002, a decrease of 78%. The Dow Jones was less exposed but it too dropped 32%. No, that time wasn’t different!
Since the 2008 Great Recession and the Fed’s action to save the ‘to big to fail’ banks by pumping over two trillion dollars into the market with what it calls Quantitative Easing. There is no doubt that that propped up the stock market. But as the Fed starts to undo that with what is called Quantitative Tightening, what will that do to the market?
We are left with the problem of when will it collapse and how far down will it go. Below is a chart that covers 91 years ending in 2018. It begins with the wee bump in 1929 and has the long trend line from the twenties to the nineties. If you look at that, how low do you think it should be until the next crash comes?
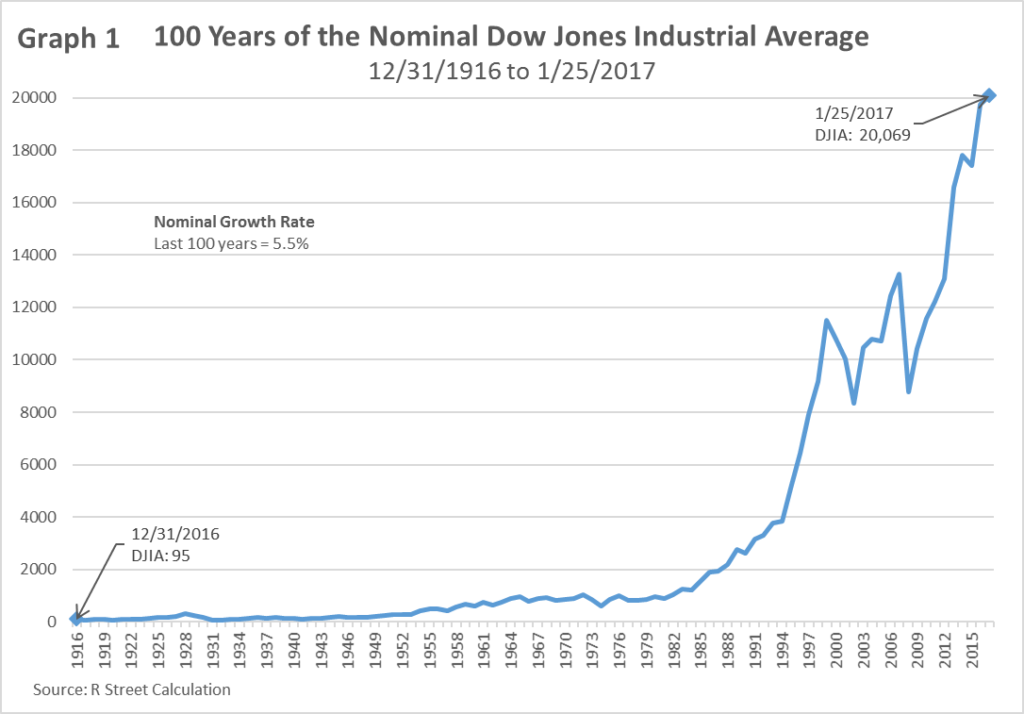
Remember, the Dow Jones rose and then fell in the twenties from 80.8 in 1922 to 381.2 in 1929 a gain of 310% and then dropped to settle at 164 in 1931.Our current bull market began in 2009 with the Dow at 8776. Today it’s at 25,883 a gain of 294%. Where will it settle?
As Galbraith noted history will repeat itself. And, then
“There would be a rush, pell-mell, to unload. This was the way past speculative orgies had ended. It was the way the end came in 1929. It is the way speculation will end in the future.”
Something to think about.
*
Note to readers: please click the share buttons below. Forward this article to your email lists. Crosspost on your blog site, internet forums. etc.