


Arctic ice breakdown
As extreme temperatures, the rate of sea ice melt, the collapse of Greenland glaciers, the thawing of Siberian and Canadian permafrost and increased evaporation in the Arctic drive cold snow storms into Europe and North America, and as hurricanes and wild fires affect tropical and semi-tropical parts of the globe, it is becoming clear Earth is entering a period of uncontrollable climate tipping points consequent on the shift in composition and thereby the state of the atmosphere-ocean system. Analogies with geological methane-release events such as the 56 million years-old Paleocene-Eocene boundary thermal maximum and mass extinction (PETM) event, and even with the 251 Million years-old Permian-Triassic (PT) boundary and mass extinction event when some 95 percent of species were obliterated, are becoming more likely.
As is well known to students of the history of the climate, once a temperature threshold is breached, abrupt events follow as a consequence of amplifying feedbacks, often within short time frameworks, examples being (1) stadial[i] freeze events which followed temperature peaks during past interglacial peaks due to cooling of ocean regions adjacent to melting ice sheets, such as the north Atlantic Ocean[ii] and Antarctica[iii]; (2) the intra-glacial Dansgaard–Oeschger (D-O)~1400 years-long warming events[iv] during the last glacial period; (3) the Younger dryas stadial freeze (12,800–11,600 years- ago[v]) and the Laurentian stadial freeze[vi] (8200 years-ago). In some instances it only took a temperature rise of about 1-2 degrees Celsius to trigger extensive ice melt, a flow of cold melt water into the oceans and thereby a regional to global freeze event, over periods ranging from a millennium to a few centuries. The abrupt transitions into and from stadial conditions could occur over a few decades and even few years[vii]
Lenton (2012) in an article titled “Arctic climate tipping points“[viii] wrote
“There is widespread concern that anthropogenic global warming will trigger Arctic climate tipping points. The Arctic has a long history of natural, abrupt climate changes, which together with current observations and model projections, can help us to identify which parts of the Arctic climate system might pass future tipping points … Looking ahead, a range of potential tipping phenomena are described.”
The last significant Arctic ice loss occurred in the Eemian interglacial around 125 thousand years ago when summer insolation in the Arctic climate increased by 11–13% causing a seasonal loss of Arctic sea-ice, northward advance of tree lines on land, and a substantial of the Greenland ice sheet (Brigham-Grette 2009[ix]). During the last ice age (110 – 11.7×10³ years-ago) the effects of warming events such as the Heinrich and D-O events led to influx of cold ice-melt water into the North Atlantic, manifested by sedimentary debris discharged from icebergs[x],[xi]. Large regions of North America and Eurasia became colder and drier. A southward shift of the tropical rain belt caused drier conditions in the Northern Hemisphere while moistening many parts of the Southern Hemisphere These climate anomalies are consistent with a slowdown of the thermohaline circulation and reduced ocean heat transport into the northern high latitudes.
Arctic climate tipping points are manifest in the present, as indicated below
- As temperature rise has exceeded 1.2 degrees Celsius above 1880 temperatures (Figure 1), sharp reductions of Arctic sea ice are taking place including a reduction of thick ice cover from 45 percent in 1985 to 21 percent in 2017[xii], when the ice cover was 8.5 percent lower than the average of 1981-2010[xiii] (Figures 2 and 3). The number of winter warming events rose from about 3 during 1980 to 20 in 2012[xiv]
- As the ice melts the near-total reflection (high albedo) of solar radiation from the ice is replaced by absorption of infrared radiation by open water;
- The flow of ice-melt water from the Greenland glaciers creates a large pool of cold water in the North Atlantic Ocean (Figure 4); By contrast the Antarctica sea ice displays marked positive and negative fluctuations[xv].
- The cold water region south of Greenland (Figure 4) slows-down to aborts northward flow of the thermohaline Atlantic Meridional Ocean Circulation (AMOC), leading to cooling of the North Atlantic and adjacent North America and Europe[xvi];
- Increased evaporation over the warming Arctic Ocean results in build-up of masses of cold vapor-laden air, intermittently penetrating into lower latitudes; Weakening of the boundary between the high-altitude polar vortex and mid-latitude stratosphere allows penetration of snow storms southward through Siberia and North America[xvii].
- These transient regional cooling to freezing events, which severely damage agriculture over large regions of Europe[xviii] and North America, may become more frequent with time, heralding longer regional freeze events, while the continuing accumulation of CO2 in the atmosphere warms other parts of the Earth.
- The slow-down to collapse of the northward flow of warm water pools in tropical regions, such as the Gulf of Mexico, results in further ocean warming of these pools, producing temperature polarities with cool northern ocean regions. This ensues in storms and hurricanes in regions such as the Caribbean islands and the southwest Pacific Ocean.
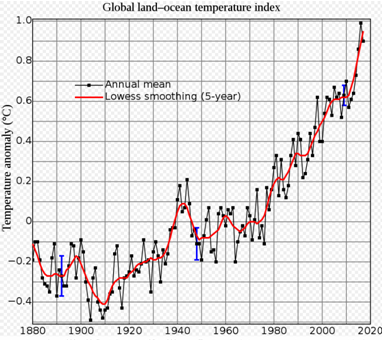
Figure 1. 1880-2018 annual mean temperatures and 5-years smoothing.
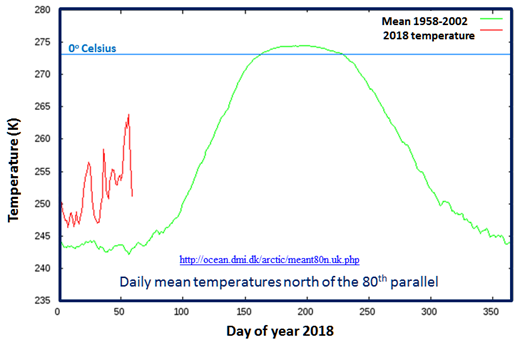
Figure 2. Average daily temperature north of the 80th parallel in 2018
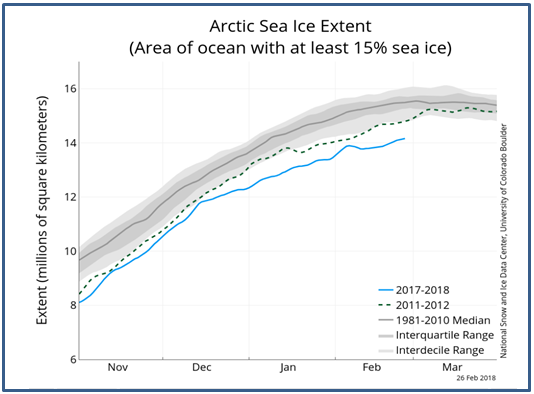
Figure 3. Arctic Sea ice extent between November 2017 and March 2018 (areas of ocean have at least 15% ice)
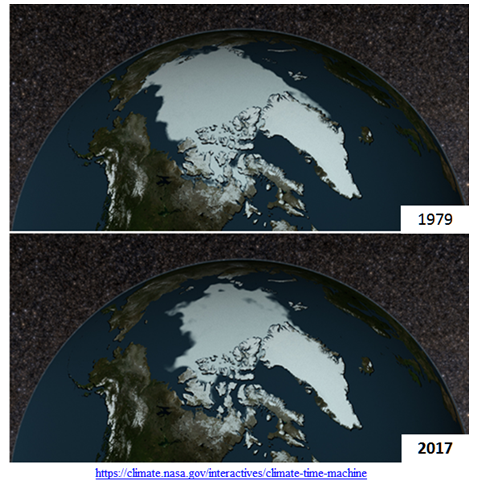
Figure 4. The decline in the extent of Arctic Sea ice cover between 1979 and 2017.
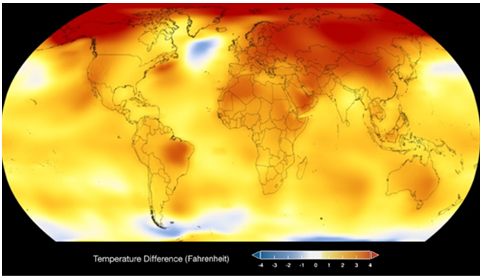
Figure 5. 2017 temperatures (in Fahrenheit) relative to 1884
Hudson (2011)[xix] estimates the increase in absorbed radiation due to total removal of Arctic summer sea ice as 0.7 Watt/m2, equal to about 1.05o Celsius. This means the global effect of Arctic melting, which in itself constitutes a feedback from CO2-driven global warming, is close to the warming effect of the rise in atmospheric CO2 from 280 ppm to 407 ppm since the onset of the industrial age.
Along with thawing and breakdown of Arctic Sea ice the Greenland ice sheet has been melting at an accelerating rate[xx]. In 2006, the Greenland and Antarctic ice sheets experienced a combined mass loss of 475±158 Gt/yr (billion ton/yr), equivalent to 1.3±0.4 mm/yr sea level rise. The acceleration in ice sheet loss over the last 18 years was 21.9±1 Gt/yr2 for Greenland and 14.5 ± 2 Gt/yr2 for Antarctica, for a combined total of 36.3±2 Gt/yr2. This acceleration is 3 times larger than for mountain glaciers and ice caps (12 ± 6 Gt/yr2). If this trend continues, ice sheets will be the dominant contributor to sea level rise in the 21st century.
The warming of large parts of the permafrost of the Siberian and Canadian Tundra is leading to the release of large amounts of methane from frozen organic matter stored in the soil, from methane clathrates (CH4·5.75H2O) in lake and sea and from shallow sediments. This has already raised atmospheric methane levels from ~1600 ppb (1960) to 1860 ppb in 2017[xxi]. i.e. at a mean rate of ~4.5 ppb/year, and higher at El-Nino years. Already the bubbling of methane from thawing permafrost is manifest through much of Siberia, northern Scandinavia and Canada[xxii], locally leading to collapse and cratering (Figure 6)[xxiii]. The total mass of methane on land of ~2050 GtC (billion tons) and methane hydrates at sea of ~16,000 GtC (Figure 7), exceeds the >600 GtC released by anthropogenic emissions since the industrial age by a factor of near 30. As the Arctic sea ice and the Siberian and Canadian permafrost thaws, even a release of 10 percent of their stored carbon would raise atmospheric greenhouse levels by a factor of about 3, leading to extreme warming, as modelled for the Eocene-Paleocene boundary[xxiv](56 Ma-ago) and Permian-Triassic boundary[xxv](251 Ma-ago) thermal events.
The Paleocene–Eocene Thermal Maximum (PETM) warming,triggered by rapid release of 13C-depleted carbon of organic origin, led to an increase in global temperature of about 5-8oC within a few thousand years and ocean acidification, leading to a mass extinction of benthic foraminifera and migration of tropical species toward the poles. It is suggested the carbon was released from circum-Arctic and Antarctic permafrost addingthousands of GtC of carbon to the atmosphere–ocean system[xxvi]over periods of about 20×103 years, with effects lasting for about 200×103 years[xxvii].
The Permian-Triassic (PT) boundary mass extinction of some 95 percent of species is the most severe biotic crisis in the fossil record. Its occurrence has been attributed to increased CO2 levels derived from massive Siberian volcanism[xxviii], warming of the oceans leading to loss of oxygen and an anoxic state, acidification and release of methane from methane hydrates. Sharp decline in δ13C at the P-T boundary is explained by methane release related to mass mortality.With warming, anaerobic microbial reactions leading to emission of poisonous hydrogen sulfide gas has been invoked as a major cause for the major cause for the PT mass extinction[xxix]
The warming of Earth, manifest in the Arctic Sea, polar ice sheets, injection of cold storms into mid-latitudes, permafrost thaw, hurricanes and wildfires, and the total rise in extreme weather events (Figure 8) represents an existential threat to humanity and much of nature. Apart from sharp reduction in carbon emissions, there appears to be only one chance to save the biosphere as we know it, namely CO2 down-draw using every available method (cf. basalt rock dust farming[xxx], biochar, air streaming through basalt, extensive sea weed farms, “sodium trees”) which would require funds on the $trillions-scale currently allocated for the military and for wars.
The willful ignorance of the powers to be in promoting carbon emissions,presiding over the devastation of large parts of the habitable biosphere, will not be lost on future generations of those who survive the ongoing calamity[xxxi].
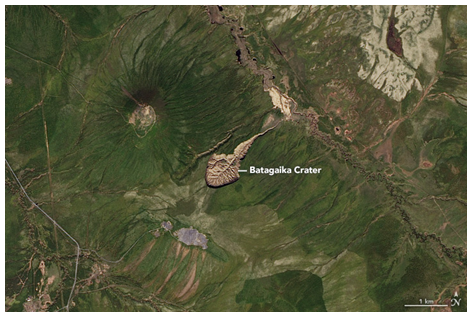
Figure 6. Batagaika Crater, northeast Siberia, formed by melting of permafrost. NASA
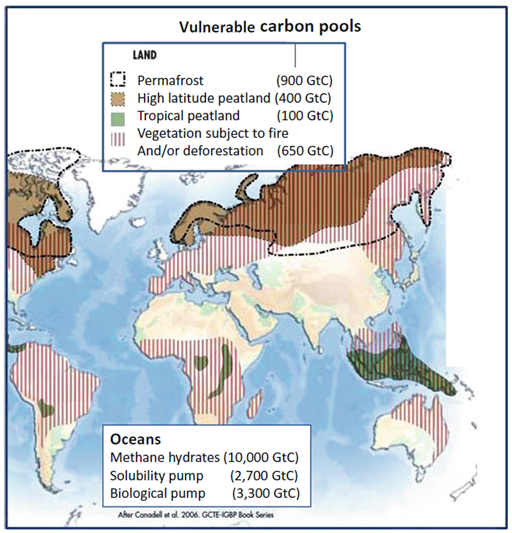
Figure 7. Vulnerable carbon sinks. ( a ) Land: Permafrost – 600 GtC; High-latitude peatlands – 400 GtC; tropical peatlands – 100 GtC; vegetation subject to fi re and/or deforestation – 650 GtC; ( b ) Oceans: Methane hydrates – 10,000 GtC; Solubility pump – 2700 GtC; Biological pump – 3300 GtC (After Canadell et al. 2007 GCTE-IGBP Book series; The Global carbon cycle; UNESCOSCOPE policy briefs; Vol. 2. Courtesy P. Canadell)
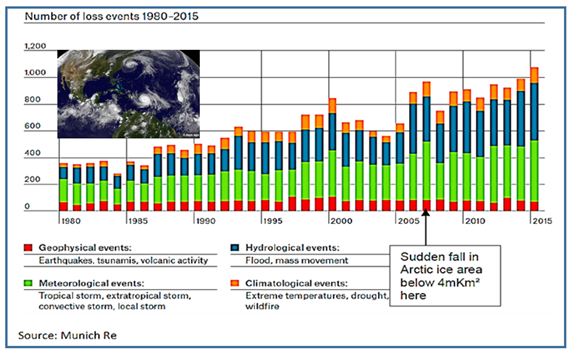
Figure 8. The rise in extreme weather events between 1980-2015. Munich Re. [xxxii]
*
Dr Andrew Glikson, Earth and Paleo-climate science, ANU School of Anthropology and Archaeology, ANU Planetary Science Institute, ANU Climate Change Institute, Honorary Associate Professor, Geothermal Energy Centre of Excellence, University of Queensland.
Notes
[i] https://www.merriam-webster.com/dictionary/stadial
[ii] http://onlinelibrary.wiley.com/doi/10.1029/2007PA001457/abstract
[iv] https://www.ncdc.noaa.gov/abrupt-climate-change/Heinrich%20and%20Dansgaard%E2%80%93Oeschger%20Events
[v] https://pdfs.semanticscholar.org/01ad/700320c4c34c94798ad4325fa1a42d5db379.pdf
[vi] https://www.britannica.com/science/Younger-Dryas-climate-interval
[vii] https://www.sciencedirect.com/science/article/pii/S0012821X17303205
[viii] https://www.ncbi.nlm.nih.gov/pubmed/22270703
[ix] https://works.bepress.com/julie_brigham_grette/20/
[x] http://globalwarming.berrens.nl/globalwarming.htm
[xi] https://www.nature.com/articles/nature21069
[xi] ftp://ftp.oar.noaa.gov/arctic/documents/ArcticReportCard_full_report2017.pdf
[xiii] https://www.nasa.gov/sites/default/files/thumbnails/image/image5figures5.jpg
[xiv] https://www.ncdc.noaa.gov/sotc/global-snow/201801
[xv] https://www.gfdl.noaa.gov/bibliography/related_files/td0802.pdf
[xvi] https://phys.org/news/2017-09-winter-cold-extremes-linked-high-altitude.html
[xviii] http://onlinelibrary.wiley.com/doi/10.1029/2011JD015804/pdf
[xix] http://onlinelibrary.wiley.com/doi/10.1029/2011GL046583/abstract
[xx] https://www.esrl.noaa.gov/gmd/ccgg/trends_ch4/
[xxii] http://www.bbc.com/earth/story/20170223-in-siberia-there-is-a-huge-crater-and-it-is-getting-bigger
[xxiii] http://www.pnas.org/content/113/43/12059
[xxiv] http://www.pnas.org/content/111/15/5462
[xxv] https://people.earth.yale.edu/paleoceneeocene-thermal-maximum
[xxvi] https://www.annualreviews.org/doi/abs/10.1146/annurev-earth-040610-133431
[xxvii] http://www.pnas.org/content/99/7/4172
[xxviii] https://psmag.com/news/suffocating-the-ocean ; https://www.sciencedaily.com/releases/2003/11/031104063957.htm ; https://www.ted.com/talks/peter_ward_on_mass_extinctions/transcript
[xxix] http://www.columbia.edu/~jeh1/mailings/2018/20180221_RockDustInFarmingRedux.pdf
[xxx] https://countercurrents.org/2016/11/14/a-dangerous-zero-sum-game-donald-trump-vs-the-planet/
[xxxi] https://www.munichre.com/topics-online/en/2017/topics-geo/overview-natural-catastrophe-2016