


All Global Research articles can be read in 51 languages by activating the Translate This Article button below the author’s name.
To receive Global Research’s Daily Newsletter (selected articles), click here.
Follow us on Instagram and Twitter and subscribe to our Telegram Channel. Feel free to repost and share widely Global Research articles.
First published on October 6, 2022
***
Abstract
We make a quantitative comparison between the COVID-19 mortality statistics of the Government of Canada (Public Health Agency of Canada; managed by the Chief Public Health Officer) and calculated total excess all-cause mortality (ACM) (deaths from all causes) for the Covid period. The claimed “COVID-19 deaths” mortality is almost double the total excess ACM for the same period, which we find to be irreconcilable with reality. We describe how these numbers have been uncritically used in public Government communications, by leading media, and in a recent scientific article co-authored by Canada’s Chief Public Health Officer, which claims that “without the use of restrictive measures and without high levels of vaccination, Canada could have experienced […] almost a million deaths.” We conclude that the COVID-19 mortality statistics are unreliable at best, and possibly meaningless.
Introduction
In Canada and in the world, there were virtually no reported deaths assigned to COVID-19 prior to the 11 March 2020 World Health Organization (WHO) declaration of a pandemic. Likewise, no anomaly in all-cause mortality by time (day, week, month) can be detected prior to the said declaration.1
The Government of Canada records “COVID-19 deaths” and reports the cumulative value on a weekly basis, at its Public Health Agency of Canada “COVID-19 epidemiology update” dashboard.2
Government of Canada officers and employees use the same cumulative “COVID-19 deaths” data in their peer-reviewed scientific articles (see below).
This brief report is about the irreconcilable discrepancy between the Government of Canada’s numbers of “COVID-19 deaths” and rigorous evaluations of excess total all-cause mortality (ACM) for the same time periods.
What the Canadian Government and legacy media say
Table 1 presents statements made by the Government of Canada and by leading media, reporting cumulative “COVID-19 deaths”. The list is incomplete.
Table 1. COVID-19 death count statements
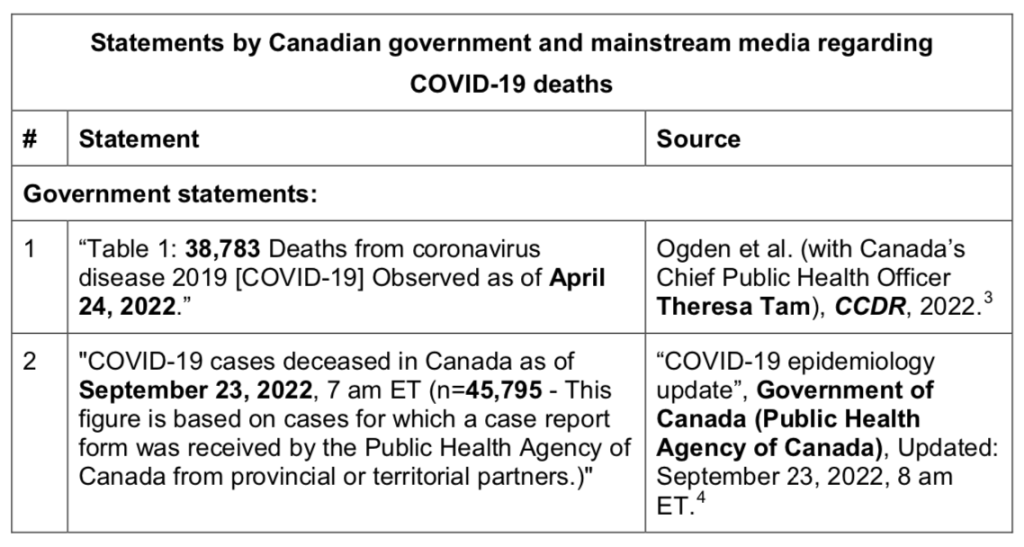
Clearly, these numbers are an integral part of the Government of Canada’s communication campaign during the Covid period.
In addition, countless audio and video recorded interviews have media interviewers and commentators advancing these and comparable large cumulative numbers of “COVID-19 deaths”, typically to emphasize the seriousness of the declared pandemic, and always implying that infection with the presumed SARS-CoV-2 virus was the dominant or only medical factor causing the deaths.
The detailed time evolution of the cumulative number of “COVID-19 deaths” is available at the Government of Canada (Public Health Agency of Canada) dashboard and its csv-file download,17 and is represented in the following graph (Figure 1), in which the time axis starts on 1 February 2020.
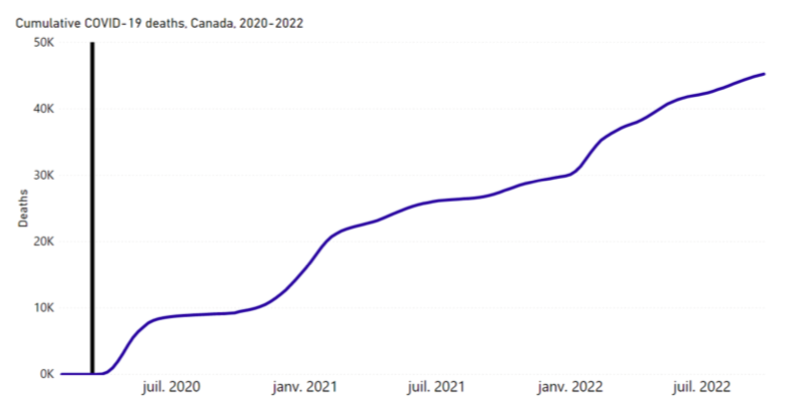
Figure 1. Time evolution of the cumulative number of “COVID-19 deaths” for Canada. The vertical line marks the week of 11 March 2020, when a pandemic was declared by the WHO. Data is from the Government of Canada (accessed on 3 October 2022).18
The same data as in Figure 1, viewed in terms of weekly new “COVID-19 deaths”, for the same time period (February 2020 to present), is shown in Figure 2.
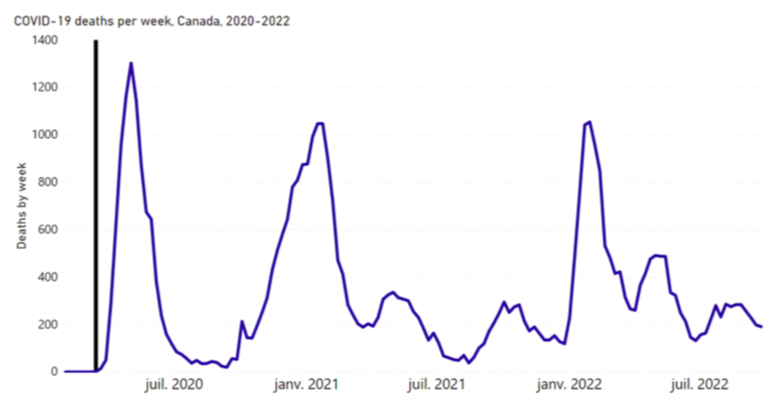
Figure 2. Time evolution of the weekly new number of “COVID-19 deaths” for Canada. The vertical line marks the week of 11 March 2020, when a pandemic was declared by the WHO. Data is from the Government of Canada (accessed on 3 October 2022).19
There is a consensus in the Government of Canada and the major media outlets that these numbers of “COVID-19 deaths”, reviewed above, represent true and reliable mortality caused by the SARS-CoV-2 virus, since COVID-19 is uniquely ascribed to this virus.
We were not able to find any Government of Canada sources or publications that suggested that the presumed virus could have played an insignificant or minor role in causing the deaths in some of the deaths attributed to or associated with “confirmed” COVID-19; nor were we able to find any Government (or investigative media) effort to estimate the fraction of any such “false positive” attributions of cause of death.
What the all-cause mortality says
All-cause mortality by time is the most reliable data for detecting and epidemiologically characterizing events causing death, and for gauging the population-level impact of any surge or collapse in deaths from any cause. Such data is not susceptible to reporting bias or to any bias in attributing causes of death. More and more researchers are recognizing that it is essential to examine ACM by time, and excess deaths from all causes compared with projections from historic trends, to help make sense of the events surrounding COVID-19: See Rancourt et al. (2022)20 and references therein.
Before we describe the quantification method, it is instructive to examine the ACM by time in Canada over the last three decades. Figure 3 shows ACM by month for Canada, from January 1991 through December 2020. Contrary to usual practice, we use the full y-scale, showing the zero, so that one may evaluate the relative importance of the seasonal variations and of any other changes compared to numbers of all the deaths in the country. This provides a reference to ascertain the degree to which the declared pandemic caused a notable excess in mortality after 11 March 2020.

Figure 3. All-cause mortality (ACM) by month for Canada, from January 1991 to December 2020, inclusive. The data is from StatCan.21 There are characteristic dips in February, due to the known artifact arising from February typically having only 28 days. The March-May 2020 peak that occurs immediately following the pandemic announcement of 11 March 2020 is historically anomalous, and we have discussed it previously.22
Next, we apply similar quantitative methods that we applied recently for the USA23 to the case of Canada, to quantify excess total ACM for the Covid period, which started on 11 March 2020. By “excess” we mean in addition to the expected mortality for the Covid period, based on the historic trend prior to 11 March 2020. As such, the expected mortality for the Covid period is the mortality that one would predict if the Covid period were just like recent prior periods, in terms of the factors that determine mortality.
We use the StatCan data of ACM by week,24 which starts at the week ending Saturday 9 January 2010, and ends at the week ending Saturday 14 May 2022. Although StatCan refers to this data as “provisional weekly death counts”, we have observed that successive updates for this product (their Table 13-10-0768-01) do not change the previously released data to a degree that could significantly change our calculations or conclusions. The last values in the dataset for May do not appear to be anomalous.
Given the end date of the data and given the start date of 11 March 2020 of the declared pandemic, the Covid period used in our calculation (the “defined Covid period”) is the 114-week period between the week ending Saturday 14 March 2020 and the week ending Saturday 14 May 2022, inclusive. We sum ACM over this 114-week period. We define non-overlapping 114-week periods of summation of ACM, which immediately precede the defined Covid period. Four such consecutive periods prior to the defined Covid period can be accommodated by the data.
We plot the resulting sum of ACM values versus time, along with the ACM by week (on a different y-axis), in Figure 4.
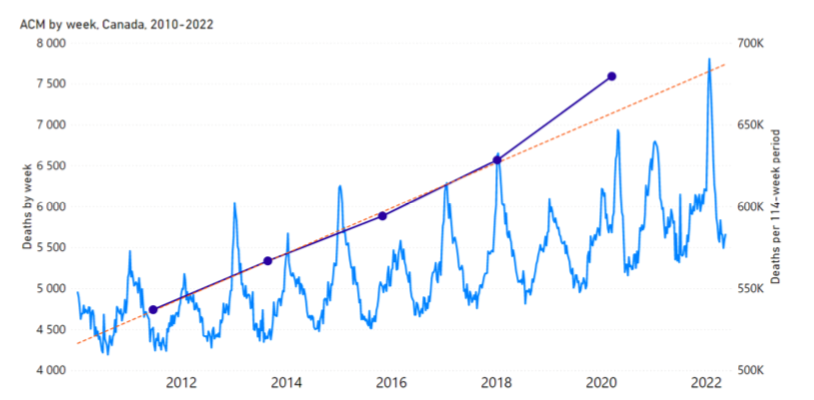
Figure 4. All-cause mortality (ACM) by week, 2010-2022, left y-axis (light blue continuous curve) for Canada; and ACM sums over the five 114-week non-overlapping consecutive periods described in the text, right y-axis (dark blue dots, joined by line segments). The ACM sums are positioned in time on the x-axis at the first week of the respective summation period. The last 114-week period is our operational Covid period (the defined Covid period). The orange straight dashed line is the least-squares best fit to the four ACM sums prior to the defined Covid period. The sharp spike occurring in the summer of 2021 corresponds to the heat wave that occurred in British Columbia (and the north-western USA).
We make a least-squares fit of a straight line to the four ACM sums of the 114-week periods prior to the defined Covid period (shown in Figure 4). Taking “x” to be the week number, where x=1 is the first week in the StatCan data, the resulting fitted line has slope = 264.5 ACM-sum-on-114-weeks per week, intercept = 516,400 deaths in 114-week period, and Pearson correlation coefficient r = +0.9989.
Therefore, the expected 114-week ACM sum for the defined Covid period, based on the least-squares fitted straight line, is (657.1 ± 1.3) x 103 deaths, where the uncertainty is estimated as the mean of the four absolute values of the deviations of the observed values from the fitted line; whereas the measured ACM sum for the 114-week defined Covid period is 679,645 deaths.
This means that the excess mortality for the 114-week defined Covid period ending on the week ending on Saturday 14 May 2022, is:
679,645 − (657.1 ± 1.3) x 103 = (22.5 ± 1.3) x 103 deaths, which is seen in Figure 4.
Covid-assigned deaths versus all-cause mortality
The thus obtained excess ACM for the 114-week defined Covid period ending on 14 May 2022 can be compared to the cumulative “COVID-19 deaths” on 14 May 2022.
The latter official value for 14 May 2022, from the Government of Canada (Public Health Agency of Canada), is: 40,684 “COVID-19 deaths”.25
Therefore, we have:
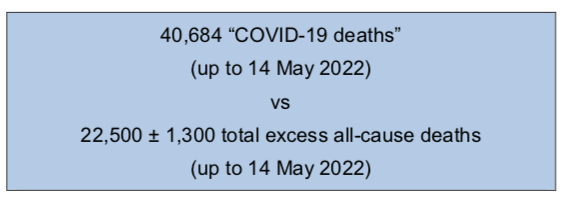
This means that there were 18,200 more “COVID-19 deaths” than the 22,500 excess all-cause deaths (up to 14 May 2022).
The “COVID-19 deaths” mortality, in magnitude, is 181% of the calculated total excess ACM (up to 14 May 2022).
If the same ratio were applied to the USA, there would have been 1.81 x 1.27M26 = 2.30M “COVID-19 deaths” in the USA, more than double the official USA number (998,587 “COVID-19 Deaths” on 14 May 2022, CDC).27
It is inconceivable that a virus killed this many more people than the total excess ACM, because this would imply that in the absence of the presumed virus there would be a large deficit of ACM. Alternatively, one would need to believe that Covid measures (masking, social distancing, isolation, shutting down economic sectors, etc.) cause a net reduction of deaths from all other causes; such as not causing any deaths while more than eliminating “influenza and pneumonia”, which in Canada have reported deaths in the range 6.2 to 8.6 K/year for 2016 through 2019.28
The presumed SARS-CoV-2 virus would have killed approximately twice as many people as the calculated excess ACM. This means that, in addition to presumably being the cause for all the excess ACM (which is implausible), the presumed SARS-CoV-2 virus would have also had to rush in and kill 18,200 people, in the same time period and before they could die of other causes, who most certainly would have died without the Covid circumstances. What is the meaning of a presumed virulent virus that kills people who would have died, when they would have died? Alternatively, for example, the Covid measures would have saved 18,200 people from “influenza and pneumonia”, say, while the presumed SARS-CoV-2 virus killed them.
More realistically, if approximately half of the excess deaths were due to the aggressive measures (including: harmful medical treatment, neglect of vulnerable individuals, social and physical isolation, and loss of regular occupation and care protocols), then at most 10,000 or so deaths could have been caused by the presumed SARS-CoV-2 virus, in this period, and the reported number of “COVID-19 deaths” is inflated by a factor of approximately 4, if the cause-of-death determinations can be taken to be meaningful.
Discussion: What does the Government of Canada say?
Deputy Prime Minister of Canada Chrystia Freeland29 has stated that if Canada had the same “COVID-19 deaths” rate per capita as the USA, then there would have been 70,000 more COVID-19 deaths in Canada.30 Freeland referred to a study by Naylor and other academics as her source. Razak et al. (including Naylor) make their analysis up to or near 12 February 2022 when the reported cumulative “COVID-19 deaths” for Canada were at 35,268. For this date, they report “COVID-19 deaths” rates per capita (per million) of 919 for Canada and 2,730 for the USA (their Figure 1C).31 The USA rate would produce 105,000 deaths in Canada, which is 70,000 more than 35,000.
This statement by Freeland has a “COVID-19 deaths” rate for the USA, which is 3.0 times larger than for Canada, but Freeland does not mention two important factors:
(1) the USA has an excess-ACM death rate (per capita) that is 6.5 times larger than for Canada [(1.27M/22.5K)(38M/330M) = 6.5], and
(2) the Covid-measures stringency index (Oxford Stringency Index) is statistically indistinguishable for the USA and Canada [Figure 2 in Razak et al.32].
Freeland’s attention should have been turned instead to a metric that takes into account the different health statuses of the vulnerable populations in the two countries.33 Freeland could have asked herself: “Why is the ratio of ‘COVID-19 deaths’ to excess ACM deaths [(40.7K/22.5K)/(0.999M/1.27M)] some 2.3 times larger in Canada than in the USA?” This contextualized comparison would mean a relative (compared to the USA) catastrophic failure of the Covid measures intended to prevent spread of the disease in Canada, in which the presumed infection appears to have disproportionately devastated those close to death in Canada. Freeland misled herself in her use of the USA regarding comparative efficacy of Covid measures in Canada.
Discussion: What do the Government scientists say?
Ogden et al. (with Canada’s Chief Public Health Officer Theresa Tam), publishing in the peer-reviewed journal Canada Communicable Disease Report (CCDR) in July/August 2022 wrote:34
“Together, these observations show that without the use of restrictive measures and without high levels of vaccination, Canada could have experienced substantially higher numbers of infections and hospitalizations and almost a million deaths.”
One million added “COVID-19 deaths” in Canada corresponds to adding approximately 150% of the baseline total (not excess) ACM deaths for the Covid period. This would increase the Covid-period total (not excess) ACM from approximately 680,000 deaths (Figure 4) to approximately 1,680,000 deaths. One can gauge what that would look like on Figures 3 and 4.
To make it more visual and concrete, we simulate the ACM by week for Canada with the added said “almost a million deaths” in Figure 5. Here, for the sake of illustration and simplicity, we add the one million deaths to the defined Covid period uniformly to each of the 114 weeks in the period (1M/114 = 8,772 deaths added to each week in the defined Covid period; keeping in mind that the Ogden et al. article uses data up to 20 April 2022, which is close to our defined Covid period end date).
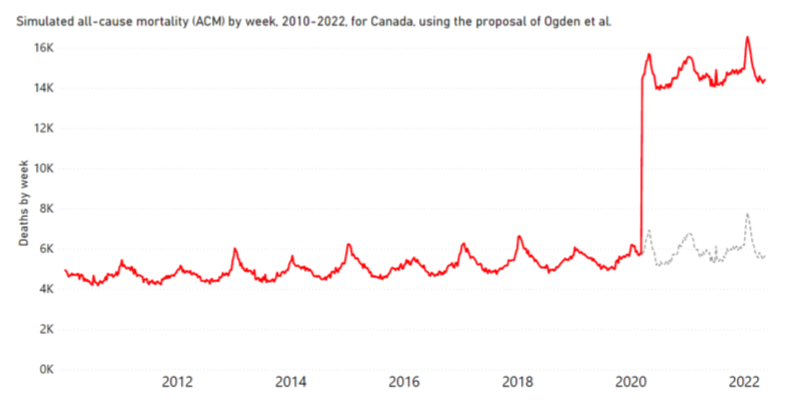
Figure 5. Simulated all-cause mortality (ACM) by week, 2010-2022, for Canada, using the proposal of Ogden et al. (red line), as explained in the text. The original data for the Covid period is shown by the dashed grey line.
Figure 5 suggests that the proposal made by Ogden et al. is not compatible with any reasonable view.
The theoretical notion that one million deaths were averted by the Covid measures in Canada is incredible on its face, but also contrary to reality. It would correspond to 210 million deaths globally [(1M/38M) x 8B]; and to 8.7 million deaths in the USA [(1M/38M) x 330M].
This conclusion by Ogden et al. (including Canada’s Chief Public Health Officer Theresa Tam) is not connected to reality because, in addition to relying on reported “COVID-19 deaths” numbers, it is a product of their theoretical modelling exercise. All such models applied to nations have been shown to often be grossly unreliable. Arguably the most renowned epidemiologist (cited >450K times),35 Stanford University’s Professor of Medicine John Ioannidis and co-authors had this to say about the models:36
“Epidemic forecasting has a dubious track-record, and its failures became more prominent with COVID-19. Poor data input, wrong modeling assumptions, high sensitivity of estimates, lack of incorporation of epidemiological features, poor past evidence on effects of available interventions, lack of transparency, errors, lack of determinacy, consideration of only one or a few dimensions of the problem at hand, lack of expertise in crucial disciplines, groupthink and bandwagon effects, and selective reporting are some of the causes of these failures. Nevertheless, epidemic forecasting is unlikely to be abandoned.”
At this point, readers have a choice of preferring to side more with one of two end-point views. Either:
(a) the Government of Canada saved one million lives, and thereby brought down mortality coincidentally to virtually the same level as in the pre-Covid periods (Figures 3 and 4); within 22,500 deaths, which is approximately +3% of expected mortality in the absence of Covid circumstances; or
(b) there was no such contagious and virulent pathogen present, and, if anything, the Covid measures may have caused net harm.
In making this evaluation, readers should keep in mind that the article by Ogden et al. (including Canada’s Chief Public Health Officer Theresa Tam) is written by the architects of the Covid measures in Canada, and of the COVID-19 testing and vaccination campaigns. It is published by the Government. And it constructs a theoretical justification for unprecedented harsh nation-wide Government measures. It cannot be viewed as unbiased.
Conclusion
We determined the expected defined Covid period mortality (nominally from 11 March 2020 to 14 May 2022), in the absence of the Covid period circumstances to be: (657.1 ± 1.3) x 103 deaths.
The actual defined Covid period mortality was 679,645 deaths.
Therefore, the defined Covid period excess mortality is (22.5 ± 1.3) x 103 deaths, which is significantly smaller than the Government’s reported “COVID-19 deaths” number of 40,684 for the same period.
These numbers (22.5K vs 40.7K) cannot be reconciled by any reasonable explanation, which we have explored.
The recent suggestion by Ogden et al., derived from using the Government-reported “COVID-19 deaths” mortality, that “without the use of restrictive measures and without high levels of vaccination, Canada could have experienced […] almost a million deaths.”, appears to be palpably disconnected from reality (Figure 5).
In conclusion, our analysis overall leads us to suggest that the COVID-19 mortality statistics collected and presented by the Government of Canada (Public Health Agency of Canada) are unreliable at best, and possibly meaningless.
*
Note to readers: Please click the share buttons above or below. Follow us on Instagram and Twitter and subscribe to our Telegram Channel. Feel free to repost and share widely Global Research articles.
This report was published by Correlation Research in the Public Interest.
Notes
1 Rancourt, D.G. (2020) “All-cause mortality during COVID-19: No plague and a likely signature of mass homicide by government response”, ResearchGate, 2 June 2020. https://doi.org/10.13140/RG.2.2.24350.77125 | archived at: https://archive.ph/PXhsg
2 Government of Canada (2022) “COVID-19 epidemiology update”. Updated: 2022-10-03. https://health- infobase.canada.ca/covid-19/ (accessed on 3 October 2022).
3 Ogden NH, Turgeon P, Fazil A, Clark J, Gabriele-Rivet V, Tam T, Ng V. “Counterfactuals of effects of vaccination and public health measures on COVID-19 cases in Canada: What could have happened?” Canada Communicable Disease Report (CCDR) 2022;48(7/8):292–302. https://doi.org/10.14745/ccdr.v48i78a01
4 https://health-infobase.canada.ca/src/data/covidLive/Epidemiological-summary-of-COVID-19-cases-in- Canada-Canada.ca.pdf (accessed on 27 September 2022).
5 Ibid. (accessed after 4 April 2022)
6 https://www.nytimes.com/interactive/2021/world/canada-covid-cases.html | Archived: https://archive.ph/puy6S (accessed on 27 September 2022).
7 https://globalnews.ca/news/6649164/canada-coronavirus-cases/ (accessed on 27 September 2022).
8 https://montreal.ctvnews.ca/covid-19-hospitalizations-down-by-42-in-quebec-1.6053545 (accessed on 27 September 2022).
9 https://www.thestar.com/politics/federal/2022/08/25/did-a-conservative-leadership-hopeful-compare- covid-19-vaccines-to-nazi-atrocities-leslyn-lewis-rejects-cowardly-accusation.html | Archived: https://archive.ph/iTEjc (accessed on 27 September 2022).
10 https://globalnews.ca/news/9084719/covid-deaths-hit-one-million-who/ (accessed on 27 September 2022).
11 https://www.ctvnews.ca/health/coronavirus/tracking-every-case-of-covid-19-in-canada-1.4852102 (accessed on 28 September 2022).
12 https://graphics.reuters.com/world-coronavirus-tracker-and-maps/countries-and-territories/canada/ (accessed on 28 September 2022).
13 https://ottawacitizen.com/opinion/kaplan-myrth-ontario-election-covid-19-isnt-over-vote-for-the-party- that-will-act-on-this-reality (accessed on 28 September 2022).
14 https://www.theglobeandmail.com/canada/article-canada-40000-covid-19-deaths/ | Archived: https://archive.ph/v3w1r (accessed on 28 September 2022).
15 https://globalnews.ca/news/8834765/covid-canada-40k-deaths-6th-wave/ (accessed on 29 September 2022).
16 https://www.cbc.ca/news/world/us-million-covid-deaths-1.6150574 (accessed on 28 September 2022).
17 See Footnote 2
18 See Footnote 2
19 See Footnote 2
20 Rancourt, D.G., Baudin, M., Mercier, J. “COVID-Period Mass Vaccination Campaign and Public Health Disaster in the USA – From age/state-resolved all-cause mortality by time, age-resolved vaccine delivery by time, and socio-geo-economic data”, Research Gate, 2 August 2022, DOI:10.13140/RG.2.2.12688.28164, https://www.researchgate.net/publication/362427136_COVID- Period_Mass_Vaccination_Campaign_and_Public_Health_Disaster_in_the_USA_From_agestate- resolved_all-cause_mortality_by_time_age-resolved_vaccine_delivery_by_time_and_socio-geo- economic_data | archived here: https://archive.ph/lFNwK
21 StatCan (2022) “Deaths, by month”. Release date: 2022-01-24. https://www150.statcan.gc.ca/t1/tbl1/en/tv.action?pid=1310070801 (accessed on 6 June 2022).
22 Rancourt, D.G., Baudin, M. and Mercier, J. (2021) “Analysis of all-cause mortality by week in Canada 2010-2021, by province, age and sex: There was no COVID-19 pandemic and there is strong evidence of response-caused deaths in the most elderly and in young males”. ResearchGate, 6 August 2021, https://doi.org/10.13140/RG.2.2.14929.45921 | archived here: https://archive.ph/CYA20
23 Rancourt et al. (2022): Footnote 20.
24 StatCan (2022) “Table 13-10-0768-01 Provisional weekly death counts, by age group and sex”. Release date: 2022-09-08. https://doi.org/10.25318/1310076801-eng | also: https://www150.statcan.gc.ca/t1/tbl1/en/tv.action?pid=1310076801 (accessed on 12 September 2022)
25 See Footnote 2
26 Rancourt et al. (2022): Footnote 20.
27 “COVID Data Tracker – Trends in Number of COVID-19 Cases and Deaths in the US Reported to CDC, by State/Territory”, CDC, https://covid.cdc.gov/covid-data-tracker/#trends_totaldeaths_select_00 (accessed on 2 October 2022).
28 “Leading causes of death, total population, by age group”, Table: 13-10-0394-01 (formerly CANSIM 102-0561), Release date: 2022-01-24, Statistics Canada, https://www150.statcan.gc.ca/t1/tbl1/en/tv.action?pid=1310039401 (accessed on 2 October 2022).
29 https://deputypm.canada.ca/en | archived: https://archive.ph/uyAHz (accessed on 1 October 2022).
30 Video: “All-cause deaths continue to skyrocket in Canada”, Rebel News, 26 September 2022. https://rumble.com/v1lmo2p-all-cause-deaths-continue-to-skyrocket-in-canada.html (at 4:12).
31 Fahad Razak, Saeha Shin, C. David Naylor, Arthur S. Slutsky. “Canada’s response to the initial 2 years of the COVID-19 pandemic: a comparison with peer countries” CMAJ Jun 2022, 194 (25) E870-E877; DOI: https://doi.org/10.1503/cmaj.220316 . See also the 27 June 2022 Globe&Mail opinion piece by Razak, Slutsky and Naylor: https://www.theglobeandmail.com/opinion/article-we-need-new-strategies-to- tackle-covid-this-fall/ | archived: https://archive.ph/moeYs .
32 Ibid.
33 Rancourt et al. (2022): Footnote 20.
34 Ogden et al. (2022): Footnote 3.
35 Google Scholar authenticated profile of John P.A. Ioannidis: https://scholar.google.com/citations?user=JiiMY_wAAAAJ&hl (accessed on 1 October 2022).
36 Ioannidis JPA, Cripps S, Tanner MA. “Forecasting for COVID-19 has failed”. Int J Forecast. 2022 Apr- Jun;38(2):423-438. doi: 10.1016/j.ijforecast.2020.08.004. Epub 2020 Aug 25. PMID: 32863495; PMCID: PMC7447267. https://doi.org/10.1016/j.ijforecast.2020.08.004
Featured image is from Children’s Health Defense