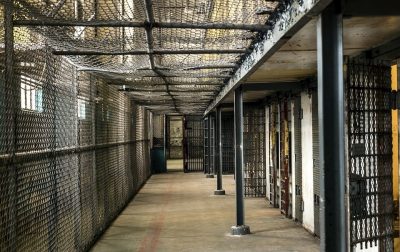
Private Prisons in the United States
U.S. private prisons incarcerated 121,718 people in 2017, representing 8.2% of the total state and federal prison population.


Private prisons in the United States incarcerated 121,718 people in 2017, representing 8.2% of the total state and federal prison population. Since 2000, the number of people housed in private prisons has increased 39%.
However, the private prison population reached its peak in 2012 with 137,220 people. Declines in private prisons’ use make these latest overall population numbers the lowest since 2006 when the population was 113,791.
States show significant variation in their use of private correctional facilities. Indeed, the New Mexico Department of Corrections reports that 53% of its prison population is housed in private facilities, while 22 states do not employ any for-profit prisons. Data compiled by the Bureau of Justice Statistics (BJS) and interviews with corrections officials find that in 2017, 28 states and the federal government incarcerated people in private facilities run by corporations including GEO Group, Core Civic (formerly Corrections Corporation of America), and Management and Training Corporation.
Eighteen states with private prison contracts incarcerate more than 500 people in for-profit prisons. Texas, the first state to adopt private prisons in 1985, incarcerated the largest number of people under state jurisdiction, 12,728.
Since 2000, the number of people in private prisons has increased 39.3%, compared to an overall rise in the prison population of 7.8%. In six states the private prison population has more than doubled during this time period: Arizona (479%), Indiana (310%), Ohio (277%), Florida (199%), Tennessee (117%), and Georgia (110%).
Proportion of incarcerated population in private prisons, 2017

The Federal Bureau of Prisons maintains the nation’s highest number of people managed by private prison contractors. Since 2000, its use increased 77%, and the number of people in private federal custody — which includes prisons, half-way houses and home confinement — totaled 27,569 in 2017. While a significant historical increase, the population declined 15% since 2016, likely reflecting the continuing decline of the overall federal prison population.
Among the immigrant detention population, 26,249 people – 73% of the detained population – were confined in privately run facilities in 2017. The privately detained immigrant population grew 442% since 2002.
Political influences have been instrumental in determining the growth of for-profit private prisons and continue today. However, if overall prison populations continue the current trend of modest declines, the privatization debate will likely intensify as opportunities for the prison industry dry up and corrections companies seek profit in other areas of criminal justice services and immigration detention.
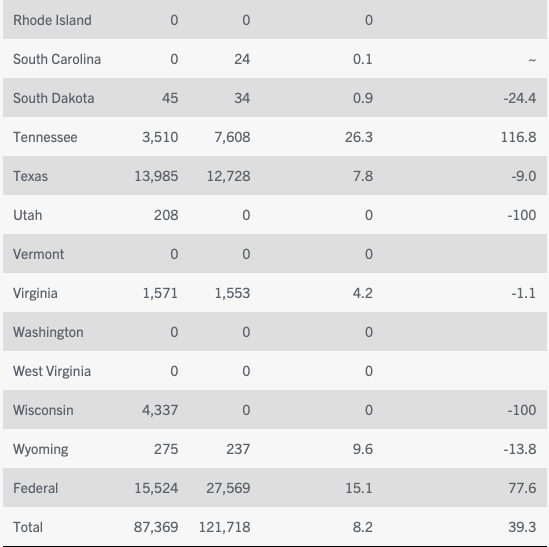
Overall private prison population numbers

Table 1. Private prison populations
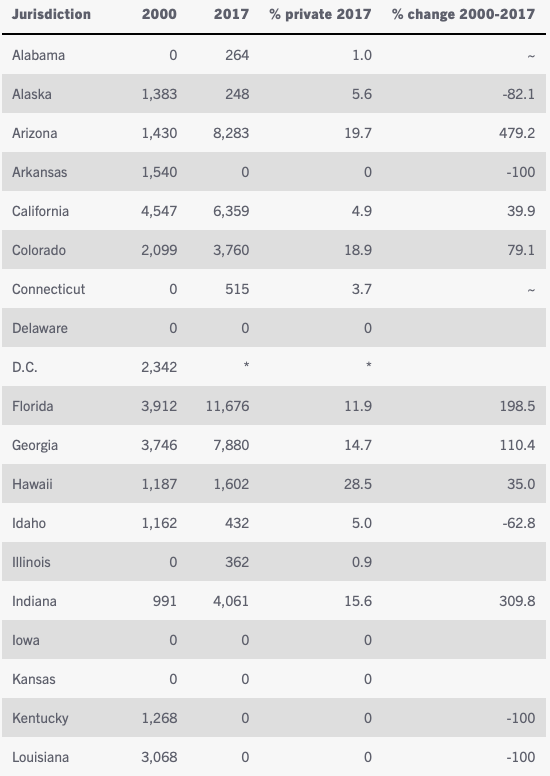

a. Data is for 2019 and was reported by the New Mexico Corrections Department.
b. Data reported by the North Dakota Department of Corrections and Rehabilitation.
~ Use of private prisons implemented after 2000
* D.C. count incorporated in federal numbers
Sources: Prisoners Series (2017, 2000), Bureau of Justice Statistics. Interviews with North Dakota and New Mexico corrections officials. Overall private prison population total for 2017 differs from Bureau of Justice Statistics report due to the inclusion of data from New Mexico obtained by The Sentencing Project which had not been available to the Bureau. Average daily immigrant detention numbers obtained from Immigration and Custom Enforcement and Removal Operations division by Detention Watch Network and the Center for Constitutional Rights as part of a Freedom of Information Act lawsuit.
*
Note to readers: please click the share buttons above or below. Forward this article to your email lists. Crosspost on your blog site, internet forums. etc.