|
All Global Research articles can be read in 51 languages by activating the “Translate Website” drop down menu on the top banner of our home page (Desktop version).
To receive Global Research’s Daily Newsletter (selected articles), click here.
Visit and follow us on Instagram at @crg_globalresearch.
***
A few weeks ago we announced that you can now search COVID VAERS reports by STATE. We have heard from many people across the country who have used the “by STATE” feature to educate elected officials about vaccine injuries happening in their jurisdiction.
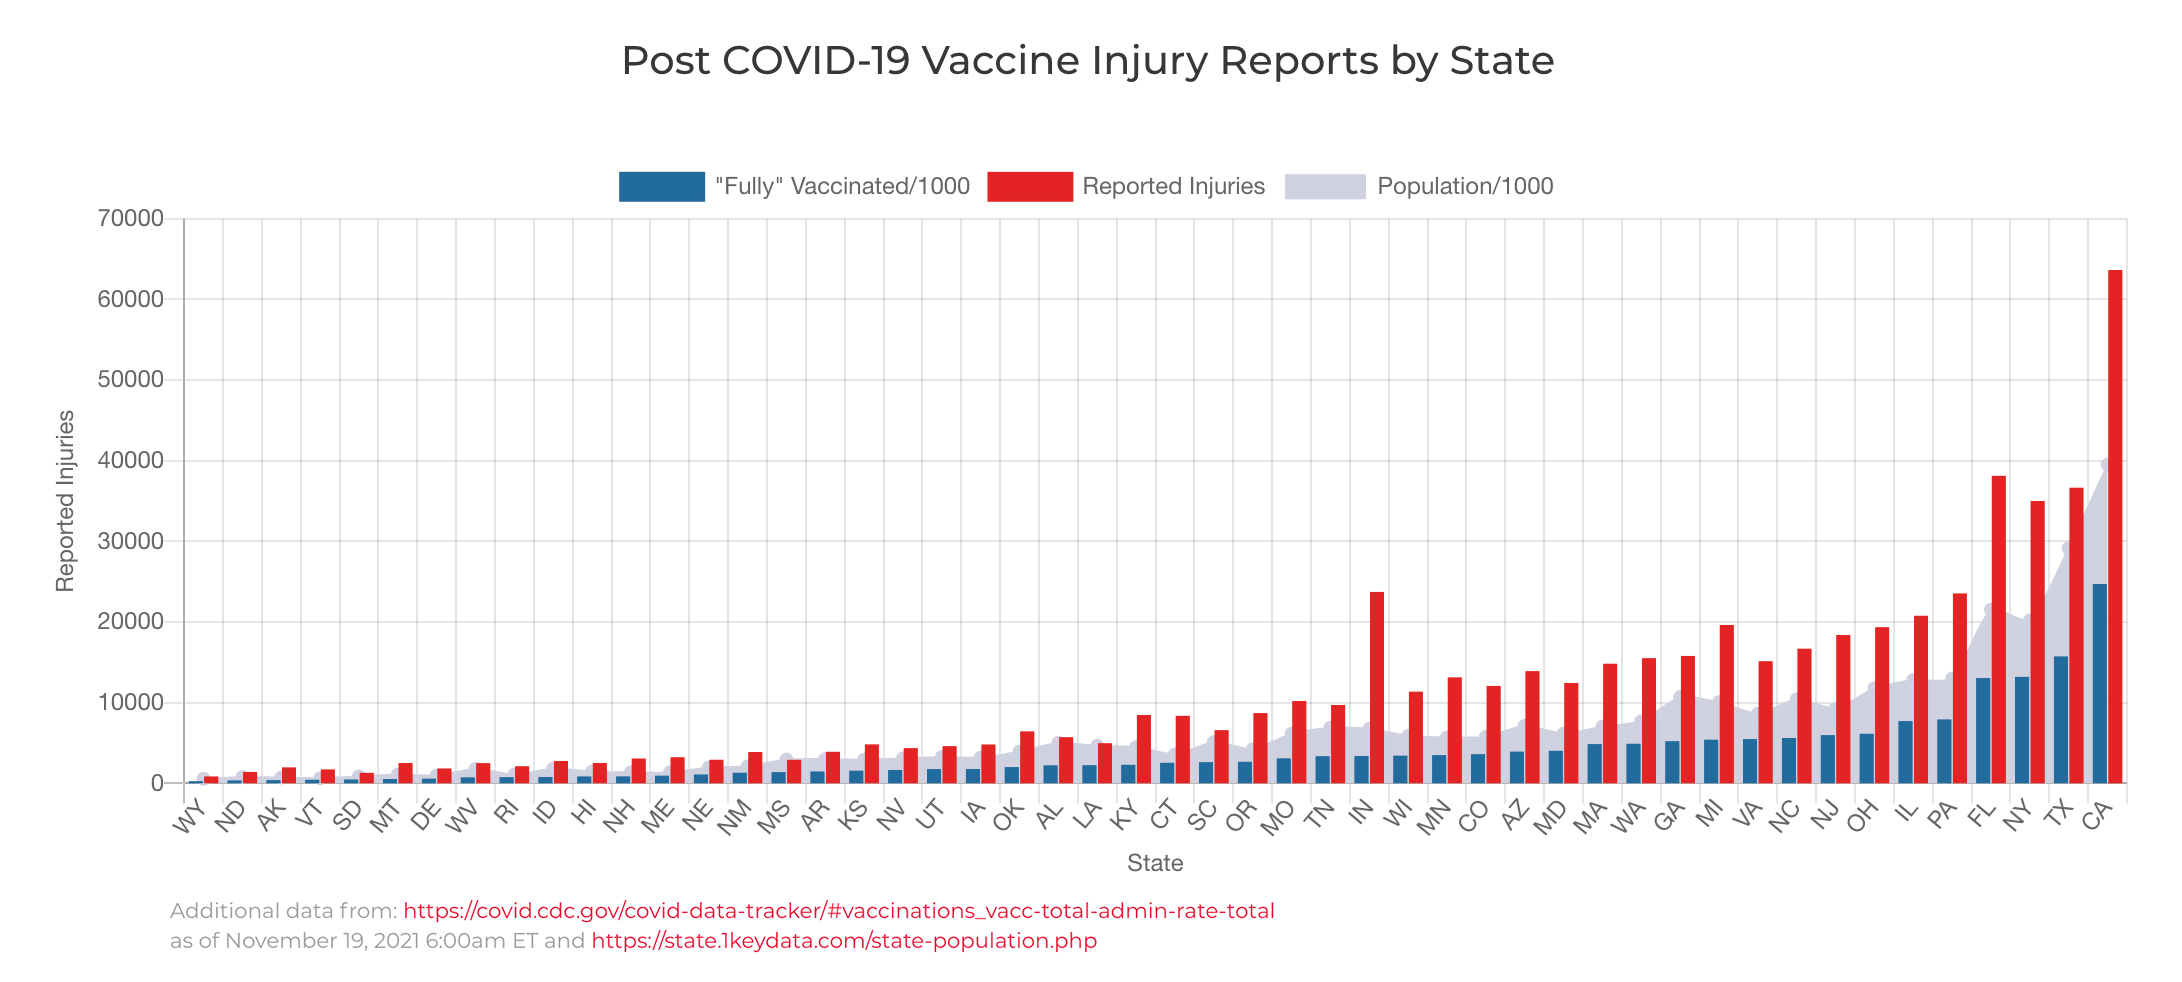
In this week’s OpenVAERS Red Box Report we have produced a chart that adds some extra context to the state reports. Below we graphed the number “Fully” vaccinated (divided by 1,000), the number of covid vaccine injuries reported to VAERS, and the population (divided by 1,000) for all 50 states. As you can see, the number of covid vaccine injury reports in each state corresponds to the number of people fully vaccinated in that state. This adds yet more evidence that we are witnessing the greatest safety signal in the 31 year history of VAERS.
The OpenVAERS Team
State population data comes from here.
Vaccination data comes from here.
Click to download the PDF of this week’s report numbers. The new version includes the numbers and a space for you to write on.
*
Note to readers: Please click the share buttons above or below. Follow us on Instagram, @crg_globalresearch. Forward this article to your email lists. Crosspost on your blog site, internet forums. etc.
Featured image is from Children’s Health Defense
|