As the Earth continues to heat, transient temperature reversals (stadials) accentuate temperature polarities between warming land and ocean regions cooled by the inflow of ice melt from the ice sheets, as observed south and east of Greenland and off Western Antarctica (Hansen et al. 2016) (Figure 1). Increased polar temperatures, rising twice as fast as intermediate and tropical zones, weaken and undulate the jet stream which defines the polar boundary (Figure 2), allowing cold air masses to move out and warm air masses to move in, further heating the Arctic.
The temperature contrast between migrating warm and cold air masses enhances the intensity of extreme weather events. Analogies are made with Pleistocene and early Holocene, (2.6-0.01.106 years ago) where peak interglacial temperatures were succeeded by transient freeze events (stadials), such as the Younger Dryas and the 8.5.103 years-old Laurentide ice melt, attributed to cold ice melt flow into the North Atlantic Ocean and North American lakes (Lake Agasiz). The evidence raises questions regarding the mostly linear to curved IPCC model trajectories proposed for the 21st century and beyond. Already large pools of cold ice melt are formed in the ocean south and east of Greenland (Rahmstorf et al. 2015) and north of west Antarctica (Figure 1) and the AMOC (Atlantic Meridional Ocean Circulation) and the jet stream are weakening. Comparisons of current warming with past climates of +1oC relative to the early 19th century indicate extreme weather events, including in the early Holocene Optimum period (~10,000-8500 years ago) and the Eemian interglacial (130,000 – 115,000 years ago) (Roverea et al. 2017). The probability of a future transient freeze event (stadial) triggered by the flow of cold icemelt water into the North Atlantic and sub-Antarctic oceans bears major implications for modern and future climate change trends, including a rise in extreme weather events due to a growing contrast between cooling oceans and warming continents and between polar-derived and tropics-derived air masses of contrasted temperatures. This needs to be taken into account in planning adaptation efforts.
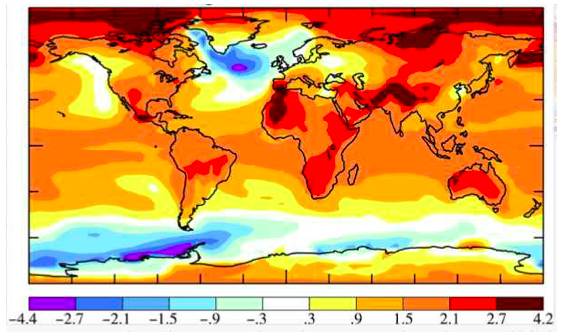
Figure 1.Modelled 2055-2100 surface-air temperature to +1.19oC above 1880-1920 (AIB modelmodified forcing, ice melt to 1 meter sea lelvel rise) (Hansen et al. 2016)1
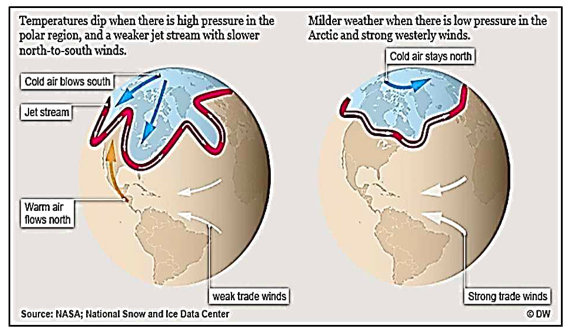
Figure 2. The weakening and increasing undulation of the polar boundary (see this)
Whereas reports of the International Panel of Climate Change (IPCC2), based on thousands of peer reviewed science papers and reports, offer a confident documentation of past and present processes in the atmosphere3, including future model projections (Figure 3), when it comes to estimates of future ice melt and sea level change rates, however, these models contain a number of significant departures from observations based on the paleoclimate record. This includes climate change feedbacks from land and water, ice melt rates, temperature trajectories, sea level rise rates, methane release rates, the role of fires, and observed onset of transient stadial (freeze) events4. Early stages of stadial event/s are manifest by the build-up of a large pools of cold ice melt water in the North Atlantic Ocean south of Greenland and along the fringes of the Antarctic continent (Figure 1).
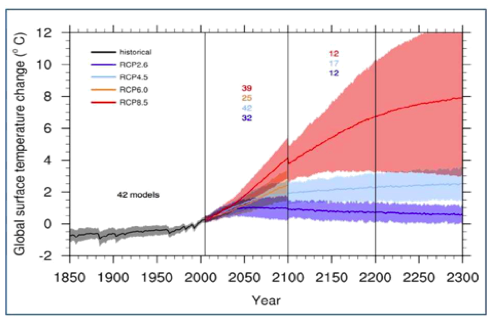
Figure 3. IPCC model of the time series of the global annual mean surface air temperatureanomalies relative to 1986–2005 from CMIP5 (Coupled Model Inter- comparison Project) Projections are shown for each multi model mean (solid lines)5
Hansen et al. (2016) (Figure 1) used paleoclimate data and modern observations to estimate theeffects of ice melt water from Greenland and Antarctica, showing cold low-density meltwater tend to cap increasingly warm subsurface ocean water, affecting an increase in ice shelf melting, accelerating ice sheet mass loss (Figure 4) and slowing deep water formation (Figure 5). Ice mass loss would raise sea level by several meters as an exponential rather than linear response, with doubling time of ice loss of 10, 20 or 40 years yielding multi-meter sea level rise in about 50, 100 or 200 years.
Linear to curved temperature trends portrayed by the IPCC to the year 2300 (Figure 3) are rare in the Pleistocene paleo-climate record, where abrupt warming and cooling dominate during glacial periods (Dansgaard-Oeschger cycles; Ganopolski and Rahmstorf 20016; Camille and Born, 20197) and interglacial (Cortese et al. 20078) periods.Hansen et al.’s (2016) model includessharp drops in temperature, reflecting stadial freezing events in the Atlantic Ocean and the sub-Antarctic Ocean and their surrounds, reaching -2oC over several decades (Figure 6).
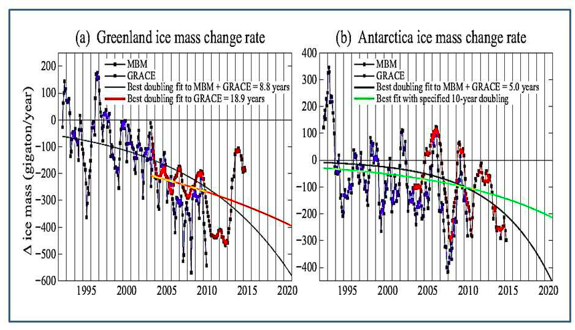
Figure 4.Greenland and Antarctic ice mass change. GRACE data are extension ofVelicogna etal. (2014)9gravity data. MBM (mass budget method) data are fromRignot et al. (2011)10. Redcurves are gravity data for Greenland and Antarctica; small Arctic ice caps and ice shelf melt add to freshwater input (Hansen et al. 2016)11
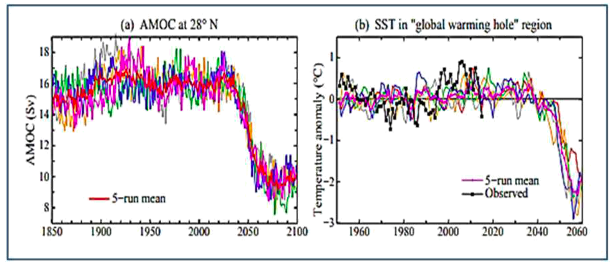
Figure 5. The AMOC (Atlantic Mid-Ocean circulation) at 28◦N in simulations (i.e., includingfreshwater injection of 720 Gt year−1 in 2011 around Antarcti ca, increasing with a 10-year doubling time, and half that amount around Greenland). (b) SST (◦C) in the North Atlantic region (44–60 ◦N, 10–50 ◦W).
Temperature and sea level rise relations during the Eemian interglacial12 about 115-130 kyr ago, when temperatures were about +1oC or higher than during the late stage of the Holocene, and sea levels were +6 to +9 m higher than at present, offer a possible analogy for present developments. During the Eemian overall cooling of the North Atlantic Ocean and parts of the West Antarctic fringe ocean due to ice melt led to increased temperature polarities and to storminess (Roverea etal. 2017; Kaspar et al. 2007)13, underpinning the danger of global temperature rise to +1.5oC. Accelerating ice melt and nonlinear sea level rise would reach several meters over a timescale of 50–150 years ( Hansen et al. 2016)
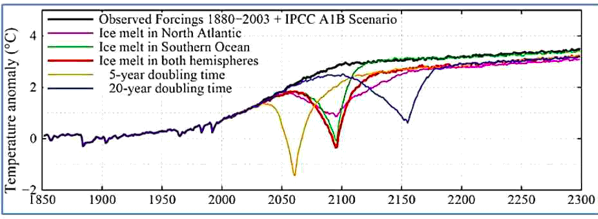
Figure 6. Global surface-air temperature to the year 2300 in the North Atlantic and SouthernOceans, including stadial freeze events as a function of Greenland and Antarctic ice melt doubling time
The development of large cold water pools south and east of Greenland (Rahmstorf et al. 201514) and at the fringe of West Antarctica (Figure 1) signify early stages in the development of a stadial freeze, consistent with the decline in the Atlantic Meridional Ocean Circulation (AMOC) (Figure 5). These projections differ markedly from model trends of the IPCC (Figure 3), which portray long term ice melt (Ahmed N 2018)15. The IPCC (2016)16 states: A key question is whether ice-dynamical mechanisms could operate which would enhance ice discharge sufficiently to have an appreciable additional effect on sea level rise” . This statement is difficult to reconcile with studies by Rignot et al. (2011), reporting that in 2006the Greenland and Antarctic ice sheets experienced a combined mass loss of 475 ± 158 Gt/yr, equivalent to 1.3 ± 0.4 mm/yr sea level rise.”17 For the Antarctic ice sheet the IEMB team (2017)18 states the sheet lost 2,720 ± 1,390 billion tonnes of ice between 1992 and 2017, which corresponds to an increase in mean sea level of 7.6 ± 3.9 millimeter.
A non-linear climate warming trend, including stadial freeze events, bears significant implications for planning future adaptation efforts, including preparations for transient deep freeze events in parts of Western Europe and eastern North America, for periods lasting several decades (Figure 6), as well as coastal defenses against enhanced storminess arising from increased temperature contrasts between the cooled regions and warm tropical latitudes.
According to NOAA19 Arctic surface air temperatures continue to warm at twice the rate relative to the rest of the globe, leading to a loss of 95 percent of its oldest ice over the past three decades. Arctic air temperatures for 2014-18 have exceeded all previous records since 1900 and are driving broad changes within the Arctic as well the sub-Arctic through weakening of the jet stream which separates the Arctic from warmer climate zones. The recent freezing storms in North America represent penetration of cold air masses through a weakening and increasingly undulating jet stream barrier (Figures 2 and 7). This weakening also allows warm air masses to move northward, further warming the Arctic and driving further ice melting. The freezing storms in North America are cheering climate denialists who refuse to discriminate between the climate and the weather. As the Earth continues to heat and cold air masses breach the Arctic boundary and move southward, temperature contrasts between polar and subpolar climate zones decrease, further weakening the polar divide. At the same time temperature contrasts between Arctic-derived cold air masses and subtropical zones result in an increase in the intensity and frequency of extreme weather events.
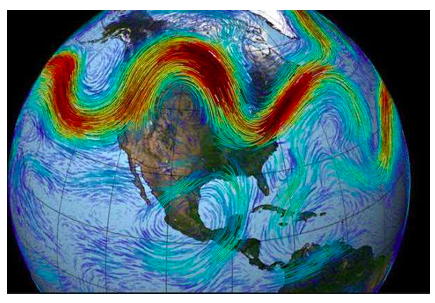
Figure 7. The weakened undulating Jet stream bounding the polar vortex. Red represents thefastest air flow (Berwyn 2016)20
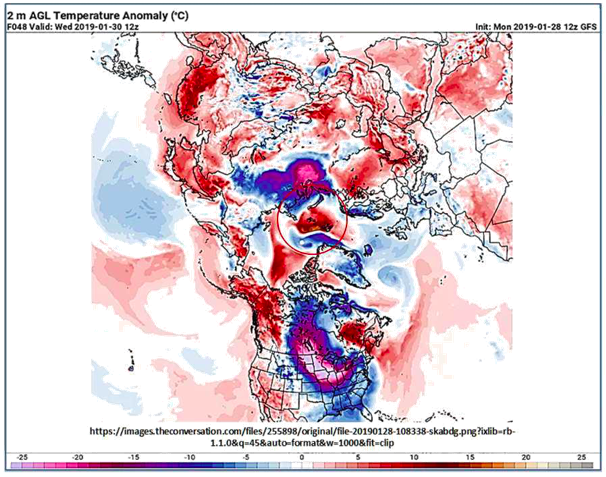
Figure 8. The North American and Siberian freeze event 30 January 2019 (NOAA GlobalForecast system model) (Francis 2019)21
The role of feedbacks from land and water, estimates of future ice melt rates, sea level rise rates, methane release rates, the role of fires in enhancing atmospheric CO2, and the already observed onset of temporary freeze events need to be quantified. As the Earth warms, the increase in temperature contrasts across the globe, and thereby an increase in storminess and extreme weather events, occurring at present, need to be taken into account when planning adaptation measures, including preparation of coastal defenses, construction of channel and pipelines from heavy precipitation zones to draught zones. In Australia this should include construction of water pipelines and channels from the flooded north to parched regions such as the Murray-Darling basin.
Imminent climate risks
Climate model projections for the 21st to 23rd centuries need to take paleoclimate evidence more fully into account, including the transient stadial effects of ice melt water flow into the oceans and amplifying feedbacks of global warming from land and oceans. The paleo-climate record indicates that over the last 800,000 years peak interglacial temperatures were consistently succeeded by temporary freeze events, attributed to the flow of cold ice melt water flow into the North Atlantic Ocean. Radiative forcing22, increasing with concentration of atmospheric greenhouse gases and rising by about 0.04 Watt/m2/year over the last 50 years23, totaled by more than 2 Watt/m2, equivalent to ~3.0°C (~1.5°C per W/m 2)24. The rise of mean global temperatures to date by 0.9°C since 1880 25 therefore represents lag effect, pointing to potential temperature rise by approximately two degrees Celsius. Climate change trajectories would be highly irregular as a result of stadial events affected by flow of ice melt water into the oceans. Whereas similar temperature fluctuations and stadial events occurred during past interglacial periods (Cortese etal. 200726; Figure 9), when peak temperature fluctuations were close to +/1oC, further rises intemperature in future would enhance the intensity and frequency of extreme weather events, entering uncharted territory, rendering large parts of the continents uninhabitable.
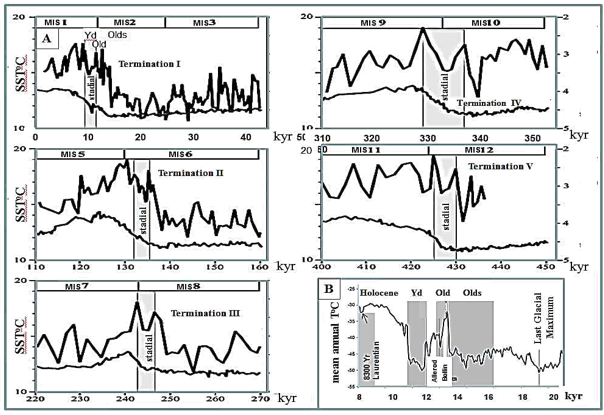
Figure 9.A.Evolution of sea surface temperatures in 5 glacial-interglacial transitions recordedin ODP-1089 at the sub-Antarctic Atlantic Ocean. Lower grey lines – δ18O measured on Cibicidoides plankton; Black lines – sea surface temperature. Marine isotope stage numbers are indicated on top of diagrams. Note the stadial temperature drop events following interglacial peak temperatures, analogous to the Younger Dryaspreceding the onset of the Holocene (Corteseet al. 200727).B. Mean temperatures for the late Pleistocene and early Holocene.
*
Note to readers: please click the share buttons below. Forward this article to your email lists. Crosspost on your blog site, internet forums. etc.
Dr Andrew Glikson, Earth and Paleo-climate science, Australia National University (ANU) School of Anthropology and Archaeology, ANU Planetary Science Institute, ANU Climate Change Institute, Honorary Associate Professor, Geothermal Energy Centre of Excellence, University of Queensland. He is a frequent contributor to Global Research.
Sources
Arctic Report Card (2018) Tracking recent environmental changes relative to historical records https://www.arctic.noaa.gov/Report-Card
Berwyn B (2016) Wobbly Jet Stream Is Sending the Melting Arctic into ‘Uncharted territory. Inside Climate News https://insideclimatenews.org/news/08062016/greenland-arctic-record-melt-jet-stream-wobbly-global-warming-climate-change
Camille Li, Born A (2019) Coupled atmosphere-ice-ocean dynamics in Dansgaard-Oeschger events Quaternary Science Reviews 203, 1-20.
https://www.sciencedirect.com/science/article/pii/S0277379118305705
Climate Council (1918) The good the b ad and the ugly: limiting temperature rise to 1.5°C. https://www.climatecouncil.org.au/resources/limiting-temperature-rise/
Cortese G, Abelmann A, Gersonde A (2007) The last five glacial‐interglacial transitions: A high‐resolution 450,000‐year record from the sub-Antarctic Atlantic. Paleogeography and Paleoclimatology (22) Part 4.
https://www.researchgate.net/publication/228524417_The_last_five_glacial-interglacial_transitions_A_high-resolution_450000-year_record_from_the_subantarctic_Atlantic
Easterbrook S (2019) New IPCC Report (Part 6). Azimuth.
https://johncarlosbaez.wordpress.com/2014/04/16/what-does-the-new-ipcc-report-say-about-climate-change-part-6/
Francis J (2019) How frigid polar vortex blasts are connected to global warming: The National Weather Service is warning of brutal, life-threatening conditions. Salon, January 2019.
https://www.salon.com/2019/01/31/how-frigid-polar-vortex-blasts-are-connected-to-global-warming_partner/
Ganopolski A, Rahmstorf S. (2001) Rapid changes of glacial climate simulated in a coupled climate model. Nature 409 (6817)153-8.
https://www.ncbi.nlm.nih.gov/pubmed/11196631
Hansen J. et al. (2016) Ice melt, sea level rise and superstorms: evidence from paleoclimate data, climate modeling, and modern observations that 2°C globa l warming could be dangerous. Atmos. Chem. Phys. 16, 3761-3812.
New IPCC Report (Part 6)
IMBIE Team (2017) Mass balance of the Antarctic Ice Sheet from 1992 to 2017. The IMBIE team. https://www.nature.com/articles/s41586-018-0179-y.epdf?referrer_access_token=S5Y_R7foKDe_0LTC1ePHNRgN0jAjWel9jnR3ZoTv0PBEKqWHTwARrIrR4OxoHFd5WZGhA0FX8FPbkdWIZLYWSZXdrY6PsBEIhQw8kfzqY8CzRUyWaogOmRlMtURwKL_LY17cUVdlgmtWLaRk_EWhFILoJdJyawITzJhU3y8fPcoosWQQMgEN2fv3kQx_S8JT4BLn4bheLaGZaYfD6J64pzwLO1V5h5TxsI6J4qUimPnWHm2Ax0DoQjYvfEgChVqY1nI8d3M_kRuObyJedPw%3D%3D&tracking_referrer=www.abc.net.au
IPCC (2018) Global warming of 1.5oC.
https://www.ipcc.ch/sr15/
IPCC Working Group I (2018) The Scientific Basis.
https://archive.ipcc.ch/ipccreports/tar/wg1/416.htm;
https://www.ipcc.ch/working-group/wg1/?idp=408
Kaspar, F, Spangehl T, and Cubasch U (2007). Northern hemisphere winter storm tracks of the Eemian interglacial and the last glacial inception. Clim. Past 3, 181–192
Nafeez Ahmed (2018) |The UN’s Devastating Climate Change Report Was Too Optimistic. Mother board.
https://motherboard.vice.com/en_us
Rahmstorf S. et al. (2015) Exceptional twentieth-century slowdown in Atlantic Ocean overturning circulation. Nature Climate Change volume 5:475–480
Rignot E et al. (2011) Acceleration of the contribution of the Greenland and Antarctic ice sheets to sea level rise Acceleration of the contribution of the Greenland and Antarctic ice sheets to sea level rise. Geophysical Res Lett 38 (5).
Roverea A et al. (2017) Giant boulders and Last Interglacial storm intensity in the North Atlantic. Proc. Am Acad Sci 114 (46) 12144-12149.
Velicogna I, Sutterley T. C. vanden Broeke M. R. (2014) Regional acceleration in ice mass loss from Greenland and Antarctica using GRACE time‐variable gravity data. Geophysical Res Lett 41 (22) 8130-8137 https://agupubs.onlinelibrary.wiley.com/doi/10.1002/2014GL061052
Notes
1. https://www.atmos-chem-phys.net/16/3761/2016/
2. IPCC (2018) Global warming of 1.5 degrees. https://www.ipcc.ch/sr15/
3. https://www.climatecouncil.org.au/resources/limiting-temperature-rise/?gclid=EAIaIQobChMIt-Wq7-KM4AIVVQ4rCh0WSQ69EAAYASAAEgLhp_D_BwE
4. https://www.atmos-chem-phys.net/16/3761/2016/acp-16-3761-2016.pdf
5. https://johncarlosbaez.wordpress.com/2014/04/16/what-does-the-new-ipcc-report-say-about-climate-change-part-6/
6. https://www.ncbi.nlm.nih.gov/pubmed/11196631
7. https://www.sciencedirect.com/science/article/pii/S0277379118305705
8. https://agupubs.onlinelibrary.wiley.com/doi/full/10.1029/2007PA001457
9. https://agupubs.onlinelibrary.wiley.com/doi/10.1002/2014GL061052
10. https://agupubs.onlinelibrary.wiley.com/doi/10.1029/2011GL046583
11. https://www.atmos-chem-phys.net/16/3761/2016/acp-16-3761-2016.pdf
12. https://www.britannica.com/science/Eemian-Interglacial-Stage
13. http://moraymo.us/wp-content/uploads/2018/03/Rovereetal_PNAS_2017.pdf;https://www.clim-past.net/3/181/2007/cp-3-181-2007.pdf
14. https://www.nature.com/articles/nclimate2554
15. https://motherboard.vice.com/en_us/article/43e8yp/the-uns-devastating-climate-change-report-was-too-optimistic
16. https://archive.ipcc.ch/ipccreports/tar/wg1/416.htm
17. https://agupubs.onlinelibrary.wiley.com/doi/full/10.1029/2011GL046583
18. https://www.nature.com/articles/s41586-018-0179-y
19. https://www.arctic.noaa.gov/Report-Card
20. https://insideclimatenews.org/news/08062016/greenland-arctic-record-melt-jet-stream-wobbly-global-warming-climate-change
21. https://www.salon.com/2019/01/31/how-frigid-polar-vortex-blasts-are-connected-to-global-warming_partner/
22. Radiative forcing – the difference between incoming radiation and radiation reflected back to space
23. http://www.columbia.edu/~jeh1/mailings/2018/20181206_Nutshell.pdf
24. https://arxiv.org/abs/0804.1126
25. https://climate.nasa.gov/vital-signs/global-temperature/
26. https://agupubs.onlinelibrary.wiley.com/doi/full/10.1029/2007PA001457
27. https://agupubs.onlinelibrary.wiley.com/doi/full/10.1029/2007PA001457