In the Wake of Fukushima (3/11): Japan’s Shift into Renewable Energy
Japanese Miracle? Its Hamstrung Feed-in Tariff Actually Works


Reeling from history’s biggest double-blow of natural and nuclear disasters, post 3-11 Japan seemed poised to lead the world’s accelerating turn to radical efficiency and renewable energy (the latter accounted for 56% of net additions to global power capacity in 2013).1 After 3-11, then-Prime Minister Kan Naoto quickly initiated regulatory shackles on the country’s nuclear capacity and implemented a feed-in tariff (FIT). These deft moves became core elements in a battering-ram of policy changes and political opposition that forced open a door to profound change in Japan’s power mix and its political economy. The country has seen minimal nuclear power generation in the wake of 3-11, and not one kilowatt between September 15 of 2013 and the present. Japan now appears on track towards the restart of at least some of its remaining nuclear capacity.2 Not without reason, the “smart money” believes Japan’s power choices are dominated by fossil fuels and the resumption of considerable nuclear capacity.3 So it is important to ask whether aggressive efficiency and FIT-incentivized renewable power got through while the door was open or face a suffocating squeeze if significant nuclear generation returns on-line.
This article proceeds by describing the promising role that efficiency and conservation have achieved in Japan’s power mix, reflecting their recent international recognition as a “fuel” in their own right. It then turns to consider Japan’s renewable opportunity and what appear to be the FIT’s most salient inadequacies. The article follows up with recent market surveys and other evidence of what took place in the power business in 2013. These empirical studies suggest that in spite of the FIT’s handicaps, the policy has already had a striking effect on investment, business formation, local-government growth strategies, innovation, and other important items.
In addition, more recent developments in 2014 confirm that Japan’s power economy is very different from what it was three years ago. PM Abe Shinzo’s government confronts this new reality in the midst of a string of important local elections and at a time when its faltering Abenomics has been forced to become a “local Abenomics.” Ironically, those incentives may make Abe and his “local revival” chief Ishiba Shigeru reluctant supporters of the FIT and renewables.
Japan’s Power Cuts as a Growth Opportunity
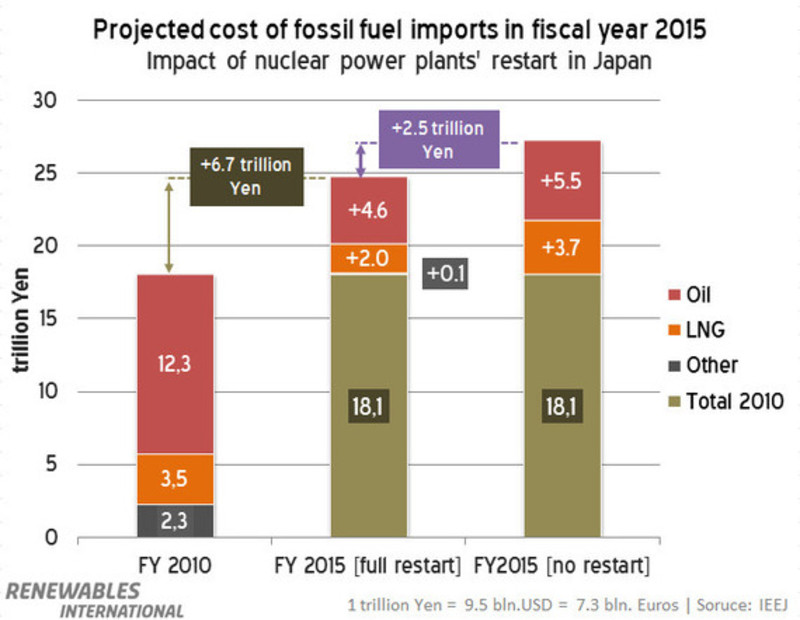
Japan was the world’s third largest nuclear-power generator prior to March 11, 2011. It had 54 reactors with a total power generation capacity of 49 gigawatts (GW) in 2010. The loss of the Fukushima reactors has since reduced that number to 48 reactors with 42 GW of power capacity. As noted earlier, none of that capacity has been in operation since September 15 of 2013. The most optimistic, politically informed outlook projects only about 20 of these reactors to restart over the next five years.4 Moreover, the attached chart on “Projected cost of fossil fuel imports in fiscal year 2015” shows that even the full restart of all remaining nuclear capacity by 2015 – something that is simply not going to happen – would cut fuel costs by only YEN 2.5 trillion, or roughly 9%. Renewables expert Thomas Gerke argues that the Abe administration ought to reassess its priorities, and emphasize power cuts as well as “an aggressive transformation of the entire energy system, that could effectively reduce Japan’s energy import dependency.”5 The evidence below bears out his assertions.
|
The very good news from Japan is that power cuts, inescapable in the immediate aftermath of 3-11, appear to have become institutionalized and ingrained in behaviour. These cuts are not incentivized by the FIT. Their drivers include the power-saving campaigns that followed 3-11, power-price increases that averaged 28% in September 2014 versus 4 years earlier,6 and ramped-up subsidy programmes for efficiency. An example of the latter are measures encouraging a more rapid uptake of LEDs – 6 times more efficient than incandescent lights – and other devices in lighting and other areas of power consumption. Japan’s post 3-11 diffusion of LEDs boomed, becoming 11% of a global market of just over USD 90 billion by 2013. Japan’s diffusion rate of 54.1% LEDs in the 2013 domestic lighting market was nearly double the global average of 27.6%. Estimates project Japan’s diffusion rate will rise to 70.8% in 2015 and 80.9% in 2018.7 By contrast, the US Department of Energy forecasts LED diffusion in America to reach just 36% of sales by 2020 and 74% by 2030.8
Japan’s power-saving campaigns also include such innovations as “peak shift” vending machines in the country’s YEN 2.7 trillion vending market. Coca Cola commands 20% of the market share in these devices, ubiquitous throughout Japan, and in January 2013 introduced “Peak Shift” vending machines that power-up late at night, when demand on the grid is low. The machines “can keep soft drinks cool without the use of electricity for up to 16 hours during summer, reducing daytime electricity consumption by 95%.”9 Japanese power demand tends to peak in the early afternoon hours of mid-summer. Adequate power-generation capacity must be on hand to meet that surge, lest there be power outages. So shaving the peak — whether through outright cuts or shifting demand — means a more efficient use of all power infrastructure. It also allows for reductions of the number of expensive “peaker plants” needed only to meet infrequent demand spikes.
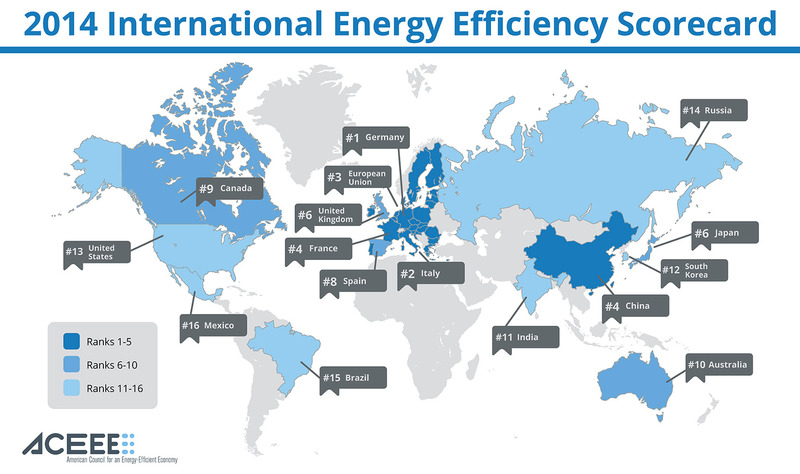
These kinds of conservation and efficiency measures saved 78.9 billion kilowatt-hours in 2013, or roughly the output of 13 of Japan’s shut-down nuclear reactors.10 This is very important in growth-challenged Japan. The International Energy Agency (IEA) rightly describes efficiency as the “fifth fuel,” and indeed the cheapest of all. Efficiency is also a global market worth about USD 300 billion in 2012, and almost certain to grow significantly in the coming years.11 Japan’s post 3-11 success with the fifth-fuel is such that some Japanese analysts argue it should become the heart of the country’s growth strategy.12 This would be wise, as the most recent authoritative comparison of efficiency across countries placed Japan tied with United Kingdom at sixth (see “2014 International Energy Efficiency Scorecard”) indicating lots of low-hanging fruit left to pick. Post 3-11 Japan has made impressive gains in power cuts. But it is not the global leader, trailing not only Germany (#1) but also China (#4), and its competitors are also increasingly shifting human, financial, fiscal and other resources into this lucrative sector.13 Japan’s ongoing rollout of smart communities, including district heating, energy-management systems, waste-energy recovery, and other initiatives, have enormous potential if they are not marginalized by vested energy interests and their myopic political-bureaucratic supporters.
|
Japan’s Bounty of Renewable Resources
We have seen that Japan’s power cuts appear institutionalized and could become a much-needed growth sector. On the other hand, Japan’s expansion of renewable power after 3-11, and especially in the wake of implementing the FIT, does not reflect what is technically feasible. This underperformance is rather odd. After all, Japan was a first-mover in renewable energy, especially solar.14 Japanese firms, including Toshiba and Mitsubishi, command roughly 70% of the global market in geothermal power-related equipment.15 And on September 18, 2014, 3 days after the country went a full year without nuclear power, Japan’s New Energy and Industrial Technology Development Organization (NEDO) held a special symposium celebrating the 40th anniversary of the September 1974 “Sunshine Plan” of solar, geothermal and other new energies.16
Japan does not lack renewable energy resources, as its rich endowment is precisely the reverse of its paucity of conventional energy resources. It is important to stress this fact because “resource-poor Japan” is such deeply embedded conventional wisdom that even Obuchi Yuko, the new (from September 3) minister of economy, trade and industry (METI) appears to echo it. She demonstrated this during a September 21, 2014 debate aired by the national broadcaster, NHK, when she insisted that nuclear restarts were necessary for Japan, “the nation with scarce resources (shigen no toboshii nihon).”17
To paraphrase Upton Sinclair, it will be difficult to get Obuchi to understand something that her cabinet position, as a member of nuclear-restart Team Abe, depends on her not understanding. Yet on November 2, 2012, the same NHK aired a visually rich comparative presentation of Japan’s abundant resources by Amory Lovins, Rocky Mountain Institute Chief Scientist and executive board member of the Japan Renewable Energy Foundation.18 Lovins has repeatedly and convincingly argued, and not just on Japanese NHK broadcasts, that Japan has excellent renewable energy potential but lacks the appropriate policy regime to fully exploit it. And rather than lazily repeat tired slogans, like METI’s Obuchi, he and his researchers went to work and combined assessments of all renewable resources, including intensity of sunlight, average wind speeds, geothermal potential, available biomass, and other pertinent elements. They converted the totals into one common comparison of the annual number of gigajoules of renewable energy potential per square meter (GJ/y/m2). The result shows that Japan is a global leader: Japan’s endowment of 63.1 GJ/y/m2 is far more plentiful than the18.8 in China, India’s 45.5, the EU’s 20.4, North America’s 30.4, and South America’s 28.1.19
The German Energy Shift
Elsewhere, Lovins has used this data to show that Japan’s renewable resource potential is 9 times that of Germany.20 He points out that among large industrial states Germany is the global leader in shifting its energy mix to renewables because of good policy, especially the FIT. The Germans aim at 35% renewable power by 2020 and over 80% by 2050. Even with far less abundant renewable resources than Japan, the Germans appear capable of overcoming the technical challenges of building environmental sustainability as well as competitive new industries.21 In 2013, non-hydro renewables provided just under 24% of Germany’s power, 380,000 jobs in thriving industries, and displaced at least USD 16 billion in fuel imports. The FIT also contributed to more equitable income distribution and enhanced community ties, important positive externalities in our post-Lehman malaise. The multinational audit firm Ernst and Young (EY) emphasize this fact in their September 2014 “Renewable Energy Country Attractiveness Index,” the 42nd edition of this quarterly publication. EY highlight the fact that Germany – along with Denmark – has “demonstrated that citizen participation and regional value creation from decentralized renewable energy production can be the norm, not the exception. In Germany, there are more than 600 energy cooperatives and more than half of renewables capacity is community-owned.”22
Germany’s renewable goals and policy regime are deeply embedded in its political economy. Its renewable commitment and industrial structure endured the dramatic collapse of domestic solar-panel production, when German firms Q-Cells, Bosch Solar, Conergy and others went bankrupt in 2012 and 2013 in the face of unbeatable Chinese price-competition.23 The German state and capital were already collaborating in moving on to power storage, integrating renewable systems and other areas of innovation opened up by their energy transition.24 That smart response is helping German exporters advance up the value chain in a global industry where the simple manufacture of solar panels, per se, has become commodified.25
Japan’s Performance in 2013
Aggressive policy saw Germany secure just under 24% of its power from non-hydro renewables in 2013, whereas renewables provided only 2.2% of Japan’s power supply in 2013. (This total then leapt to 4.4% in April-May of 2014, but for the moment, let us stick with the 2013 data.) To be sure, the amount installed in 2013 was a robust 32% increase over the previous year. A one third increase in solar investment, to USD 28 billion, placed Japan 3rdin the PEW Charitable Trusts analysis of clean tech investment for 2013 (see the attached chart on “Investment by Country and Sector, 2013”). During 2013, Japan installed 7 GW of solar capacity, which nearly equalled the 7.8 GW of all renewable power (5 GW being solar) it had installed under the Renewables Portfolio Standard (RPS) system it had initiated in 2003.26

|
Japan’s investment in solar in 2013 was impressive, but its deployment of the gamut of renewable power options was not as rapid as many observers had expected.27 Japan’s combination of post 3-11 power needs, its abundant renewable resource-endowment, and the fact that in 2013 it came second in the world in clean energy patents (see chart on “Clean Energy Patents for Top Countries 2013”), suggest it should and could have made more progress. Instead of a dramatic increase in renewables, Japan largely substituted for lost nuclear generation with the power cuts outlined earlier and by increasing fossil fuels in its power mix from roughly 60% before 3-11 to just under 90%. The latter was in large part through expanding the use of existing generation capacity, bringing old “mothballed” capacity back on-line, and building new fossil-fuel plant, especially natural gas and coal.
Preeminent among the factors that hindered a more rapid diffusion of renewable power is the regulatory regime that underpins the Japanese FIT, which became effective from July 1 of 2012. After a brief overview of the Japanese FIT itself, this paper turns to these handicaps.
The Japanese FIT’s Handicaps
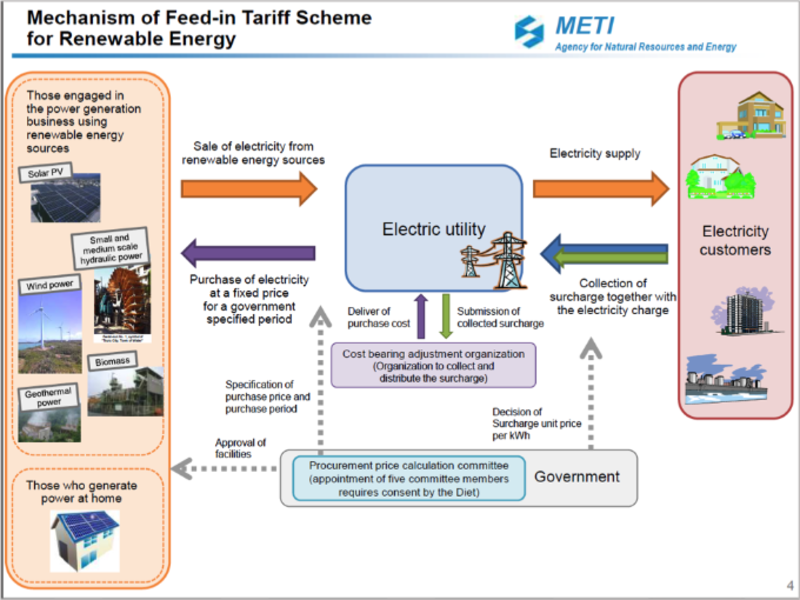
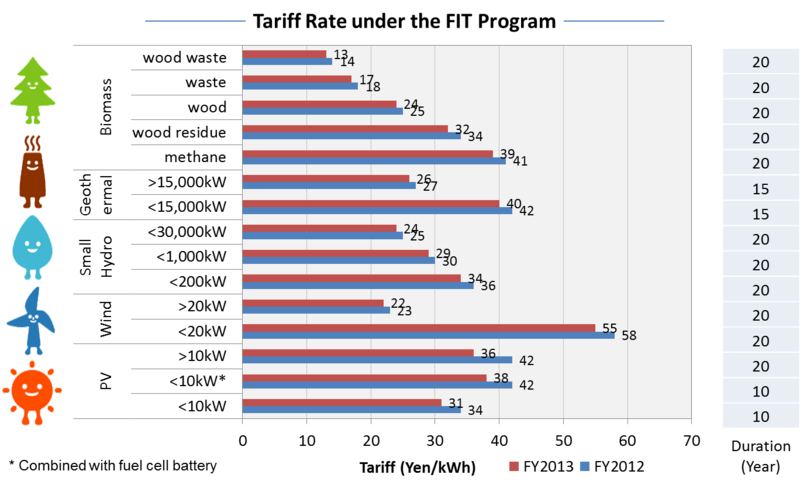
The attached Ministry of Economy, Trade and Industry (METI) diagramme “Mechanism of Feed-in Tariff Scheme for Renewable Energy” shows that the FIT is a scheme through which solar, wind, and other types of renewable-power generation (biomass, geothermal and small hydro) are given a guaranteed price – or “tariff” – per kilowatt-hour (kWh) for a designated period. The tariff varies according to the particular system’s output, measured in kilowatts (kW), as is seen in a separate METI chart on “Tariff Rates.” The cost of the premium price is then passed on to ratepayers in their power bill.
|
|
|
| Japan’s 2013 share of clean-tech patents | Source |
On paper, the Japanese FIT obligates power companies (meaning Japan’s 10 monopolies, including the infamous TEPCO) to purchase the renewable power generated by duly designated renewable-power projects. But where the Japanese FIT falls short, especially compared to its German counterpart, is in allowing the monopoly utilities to refuse grid connection to projects at their discretion. The Japanese monopolies also have no obligation to expand the power grid, giving access to areas with renewable resource-endowments but limited or nonexistent power lines to transmit it. Among other things, this has allowed the monopolies to freeze out onshore wind power, which is potentially the cheapest among renewable options, relatively quick to install,28 and the backbone of global renewable power. Japan’s onshore wind capacity has grown by only minimal amounts over the past two years. As Lovins points out, “of the 8 GW of renewables brought into operation in the first 20 months after it [Japan] introduced renewable FITs in July 2012, 97.5% was solar and only 1% windpower.”29
Pro-Monopoly Warts and All, Japan’s FIT Works
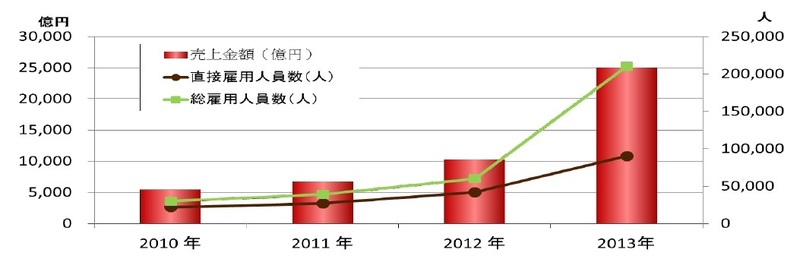
We have seen that Japan’s FIT did not drive as rapid an expansion of renewables in the power mix as advocates expected. Even so, it is clear that the FIT stimulated a very large and expanding industry. One recent assessment of part of this industry’s scale is see in a Japan Photovoltaic Energy Association (JPEA) analysis, based on August 8, 2014 data from the METI’s New Energy Subcommittee. The total expansion of economic activity in solar is represented by the red bars in the attached chart on “Sales and Employment Japan’s Solar Sector, 2010-2013.” The JPEA analysis shows that the solar business in Japan increased from just over YEN 500 billion in 2010, to 670 billion in 2011, about YEN 1 trillion in 2012 (the initial year of the FIT), and then leapt to YEN 2.5 trillion in 2013. The calculation of business activity includes not just sales of solar panels, but also the power conditioners, inverters and other gear as well as the installation costs. And in terms of direct (the black line) and indirect employment (the green line) in the solar sector, the analysis highlights an expansion to 90,000 direct jobs and 210,000 indirect jobs in 2013, versus a few thousand for both in 2010. Moreover, only 9.3% YEN 2.5 trillion in total business volume represented money that went overseas for the import of panels and other equipment. Over 90% of the economic activity generated in this sector therefore stayed in the domestic economy, leading to the impressive results in employment.30
|
Another indicator of the growth of Japan’s renewable energy industry is seen in the Tokyo Shoko Research survey of new business creation during 2013 (released on August 8, 2014). There were 210,000 new businesses created in all sectors of the Japanese economy during 2013, a 5.8% increase over the previous year. The survey also revealed that there was a startling 118.1% increase (834 firms to 1,819 firms) in the utilities sector, which includes electricity, gas, heat distribution, and water. Tokyo Shoko directly attributes this increase to the ballooning interest in solar, wind, geothermal and other renewable power generation and related business.31
Tokyo Shoko has been in the business of market surveys since 1892,32 so is not some over-eager front for Greenpeace or Friends of the Earth. It seems important to stress this fact, because 5 days after the above release Tokyo Shoko published a clearly enthusiastic special report that zeroed in on the utility sector, and specifically power.33 This August 13 summary of the survey results confirmed that the bulk of the 1,819 new firms in the utility sector were centred in power, which saw 1,799 new businesses launched in 2013. The attached chart on “Annual Trend in New Power Firms, 2009-2013” graphically illustrates the pace of new business growth. Tokyo Shoko deliberately added the red lines in the chart to help readers visualize the upward spike of business starts in power, represented by the rapidly ascending blue line. The 2013 total of new firms was a striking increase of 2.2 times over the 811 in 2012, and a very dramatic leap of 26.4 times the 68 new firms that were established in 2011. The report also made a point of emphasizing that these results reflect the attractiveness of the FIT.

|
|
| Annual Trend in New Power Firms, 2009-2013. | Number of Firms and Energy Type (with some overlap) |
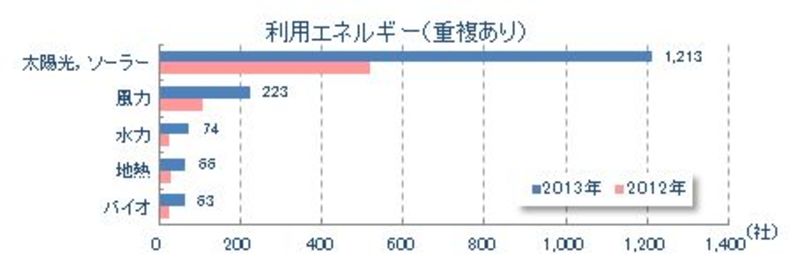
Of the 1,799 new power businesses in 2013, 67.4% (1,213) were involved in solar. In spite of Japan’s bias towards solar, there were also significant numbers of business starts in other renewable areas as well. On the x-axis of the attached chart (in Japanese) on “Number of Firms and Energy Type (with some overlap),” the topmost energy is solar, followed by wind, water (i.e., small hydro), geothermal, and “bio” (a contraction, referring to biomass and biogas). The 223 new firms in wind in 2013 is impressive on its own, nearly 4 times the total number of new firms in the entire power sector in 2011, and over 10 times the 22 new entrants in 2009. The results for hydro, geothermal and bio-power are similarly noteworthy, when viewed against the past lethargy of Japan’s monopoly-dominated power sector.
The Tokyo Shoko survey also highlights the explosion in the number of firms designated as Power Producer and Supplier (PPS) businesses. The PPS category is a result of the 1999 power-law reform. This reform allowed new entrants into the power-supply market (for over 50 kW) in addition to the existing 10 monopoly utilities, as of April 2005. Tokyo Shoko view this as a very important metric, and hence included the most recent data possible prior to their August 13 survey release. Their numbers show that as of August 4, a total of 313 firms were registered with the METI’s Energy and Natural Resources Bureau. Bear in mind that at the end of March 2012, this number was a mere 53 firms.34 Tokyo Shoko note that the expansion in the number of PPP firms has largely been driven by the increase in renewable power generation, the electricity price hikes of the monopoly utilities, and the impending liberalization of the YEN 7.5 trillion small-lot power market in April 2016.
The Tokyo Shoko specialists do not expect all these new firms in the power sector to survive. Among other challenges, they point to the low capitalization of many of the new businesses. Fully 80% of them are capitalized at YEN 10 million or less, with 40% being under YEN 1 million. In addition, some of the firms are yet to engage in business activity or soon go bankrupt.The analysts thus warn of an impending shakeout in the number of PPS and other new entrants into the power sector. At the same time, they argue that the striking increase in business starts in this important sector is a very positive development. They remind readers that Japan’s growth strategy is aimed at raising the low level of new business starts to 10%. Tokyo Shoko also spotlight Japan’s need for expansion of new business areas in order to shift its industrial structure, moving human and other resources from declining areas to more promising new sectors. The analysts urge smart policymaking, and express optimism that many of the new entrants in the power sector will afford much-needed employment and innovation.
Surveying the New Landscape of Power
We have seen that, even handicapped by rules that privilege the extant power monopolies, Japan’s FIT incentivized significant business activity during 2013. Several more recent developments indicate that the striking increase in the number of players in the Japanese power market, together with many of them deploying renewable energy, are not bubbles but are rather rooted on solid ground. This solid ground includes the fact that many new entrants are large firms, there are significant investment plans in expanding renewable capacity, there are impressive increases in demand for renewable power, and evidence of quite promising innovation.
First, the number of PPS firms, 313 at the time of the Tokyo Shoko study’s release, has continued to increase. As of September 19, 2014, the figure stands at 352.35 As of July 2014, the number of PPS actually producing and selling power was 56. Most of the rest appear to be firms that have formally registered as PPS, but are waiting for deregulation (such as of the retail market in April 2016) to proceed before actually commencing operations. These firms include PPS set up by Nippon Paper Group and other large-scale concerns. Not all of these interests plan to deploy renewable power, but many of them do.
As to investment in renewable capacity, the PPS Orix intends to increase its renewable-power supply capacity by 12 times (to 1 million kilowatts) over the next 5 years in an investment of YEN 300 billion.36 The Orix PPS is an important element of the larger Orix Group of 26,000 employees working in leasing, asset management, eco services, and other areas.37 The firm has at present 4000 business firms as customers and a renewable-power output capacity of 80,000 kilowatts. Most of its investment will go to solar, as it plans to spend YEN 220 billion on 800,000 kilowatts of solar capacity at over 200 locations nationwide (from Hokkaido to Kumamoto). It will also pour YEN 60 billion into biomass, with plant in Fukushima and Fukuoka. On geothermal, it will spend YEN 25 billion at a maximum of 15 sites. It is also thinking about entering wind, but has not yet made any decisions.
This investment plan will put Orix in the number 2 spot among the PPS firms by 2018 in terms of generating capacity. The top PPS is Enetto, which secures its power from excess in-house generation and in 2013 sold 10.6 billion kilowatts. Orix renewable deployment will see its capacity move into the 2.3 to 3 billion kilowatt range.
The Public Sector and PPS
Some local governments are also planning to directly enter the PPS market. Planned additions include Osaka Prefecture’s Izumisano City (population 101, 313) announcement that within 2014 the city would join with a private firm and undertake a PPS (tentatively named Izumisano Power). The PPS would be funded 2/3 by the city and 1/3 by the private firm, and would largely use FIT-supported solar power generated by the city’s solar projects at Kansai International Airport, to supply city facilities from April of 2015. At current power prices, the PPS arrangement is calculated to result in a YEN 1 million reduction of the city’s power bill.38
It is also not uncommon for local governments to shift their power contracts away from the monopolies to active PPS, with all or at least some of the power being renewable. One recent example is the city of Nasukarasuyama (population: 28,633) in Tochigi Prefecture (one of the areas affected by 3-11). The city authorities relate that in response to price increases for power, they have progressively shifted power-supply contracts, via auction, from Tepco. Since August 1 of 2012, they did this for 19 city facilities (schools, day-care centers, municipal waterworks centers, etc). And as of the end of July in 2014, they have completed 3-year contracts (August 1, 2014 to July 31, 2017) with 2 PPS firms (Mitsurou Green Energy and Itochu Enex) for power to a total of 21 facilities (Mitsurou having 15, and Itochu 6) at substantial savings from the Tepco price. The average reduction over the 21 facilities is 21.9%, and the total cost reduction is YEN 3.18 million, which is significant savings for such a small community.39
Other local governments plan to draw on PPS for green power, and aim to make the initiative a model for others to follow. A recent example is Atsugi City’s (population: 225,000) August 22 deal with above-noted Orix as well as Kanagawa Power. The three entities are cooperating on using the power generated by solar panels in the city to supply 15 of the city’s public buildings. This arrangement will see the city cancel its power contracts with the regional monopoly, Tepco, by December. The move is expected to save the city YEN 1.5 million in power costs. But the plan is also designed deliberately to be a template for other local governments’ “local production-local consumption” initiatives to enhance local resilience.40
These kinds of leadership templates are important. Many local governments have plans to expand renewables, but not necessarily the technical sophistication to build the capacity into a larger system. On local renewables, Hitotsubashi University Natural Resource Economics Project team members Fujii Kohei and Yamashita Hidetoshi conducted a survey of “The Actual Conditions And Issues of Renewable Energy Use in the Municipalities” earlier this year. They produced a questionnaire that inquired whether the local governments were deploying renewable energy, in what fashion, and whether they were planning to expand it. Collaborating with the Asahi and Kyodo news agencies, they sent the survey to all of Japan’s 1741 local governments during May and June. They received replies from 288 locals (16.5%) as of May 28, of which 73% reported they had renewable power deployed. Fully 58% of the generation was solar, 14% wind, and 7% biomass. The operator, in 33% of the cases, was the municipality, with outside business being the operator in 28% of cases, and a local business in 22% of cases. Fully 92% reported they were considering more renewables, for environmental as well as resilience reasons.41
And many local governments are simply shifting their power contracts to PPS firms to get a lower price, irrespective of whether the new power is renewables. A recent survey by the Sankei Shimbun, which is quite conservative and overtly pro-nuclear, found that 21 of Japan’s 49 prefectures have shifted power supply for their main offices to PPS firms. This number was apparently a 150% increase on the number of prefectural offices abandoning the monopolies last year.42 While this kind of contract-cancellation does not necessarily advantage renewable, it does bolster the position of the PPS business overall.
Moreover, according to the August 6, 2014 Nikkei Shimbun, contract cancellations with the monopoly suppliers and shifts to new power firms are seen in 41% of firms surveyed by the newspaper during June and July. The survey received usable responses from 78 firms. Of those, 43 were in manufacturing and 35 in non-manufacturing.
The survey showed that 41% of the firms were already purchasing power from the PPS new power firms. It also showed that 12% of the surveyed firms were considering purchasing power from the new power firms. Manufacturing firms tend to use large amounts of power, and the number of manufacturing firms already purchasing power from the new power firms was 44%, with 16% considering purchasing power from new power firms, for a total of 60% either already purchasing power or considering.
As to cost of power, the surveyed firms indicated that their power costs for 2014 would increase by, on average, an estimated 22% over prices prevailing in 2010. All firms indicated that they had made efforts to reduce their power consumption, but that the price increases by the monopoly utilities had effectively made that a wash in terms of costs, and thus the turn to new power producers was a defensive move for their bottom lines. Interestingly, the article’s title was “large firms power cancellations total 11 nuclear reactors worth.”43
Innovation in Energy Services
It is hardly surprising that, in the context described above, significant innovation is evident in energy services. Indeed, in some casesentire business sectors are innovating in the power supply area. One example is outlined in the August 15 Nihon Keizai Shimbun. It details how printing firms (whose businesses have been hit by declining demand due to population decrease and the use of iPads, etc) are designing services for firms in the PPS market. These services include assistance in finding potential customers, various innovative mechanisms to combine power supply to households (from 2016 deregulation) with a variety of ancillary services to encourage conservation.44
Another promising area of innovation is seen in HL Solutions, which offers a package of options (advice on efficiency, PPS, solar deployment, etc) that includes splitting power contracts between the monopoly utility and a PPS. HL Solutions is an energy-services firm that has been active in Kyushu since May of 2012. As of August 1 of 2014, they have expanded their offices from Fukuoka Prefecture’s Ohnojou City (a mid-size city of just under 100,000 people) to Kitakyushu and Kumamoto cities (both large urban “smart city” centres in Kyushu, and the former having been the focusof a “green city” report for the OECD in 201245). HL Solutions will also open offices in Oita City. HL Solutions has already done this “partial supply” contracting for 100 clients as of April 2014, and anticipates a business volume of over 50 clients per month. This innovation has allowed HL Solutions to get over the business problem of still-limited PPS power supply (only 4-5% of capacity). This development possibly not only changes the incentives for HL and other energy service firms but for PPS firms as well as the renewable industry per se. This is because it enhances the ability to use the monopolies’ power capacity while at the same time eroding it. This information on HL Solutions is carried in a August 5, 2014 piece by “Construction Industry,” which portrays the PPS and related expansion of firms (such as HL Solutions) as a boon for the construction industry.46
Again, not all of this activity is due to the FIT, because much of the PPS power is generated by fossil fuels. But the FIT clearly plays a significant role in a larger context. This bears out the arguments of Tokyo Shoko and updates them.
Maximizing the Benefits From the FIT
Though the Japanese FIT clearly works, it very much needs to be adjusted and embraced by a better coordination of energy and environmental policies. This would help Japan accelerate its deployment of renewables as well as cut its costs.
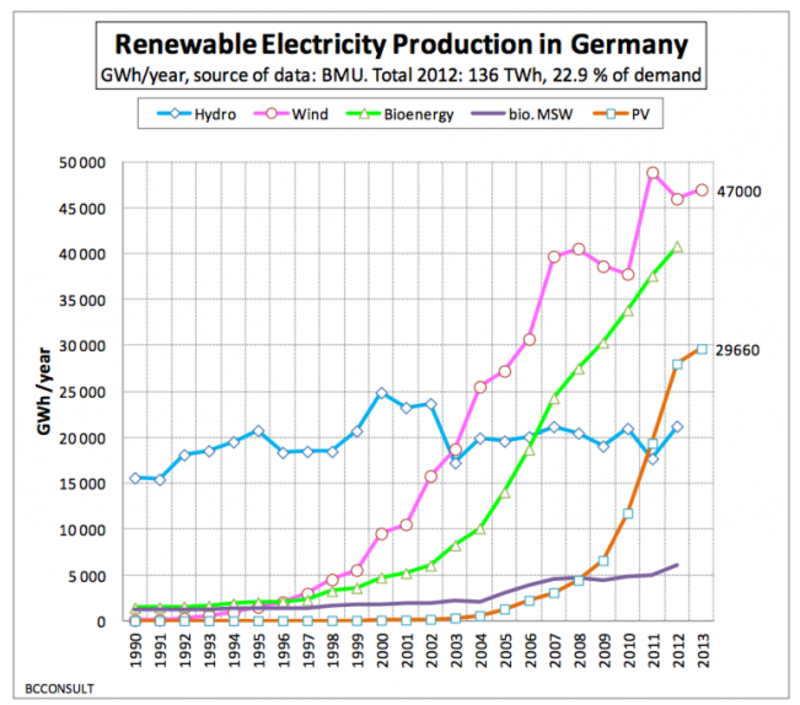
For example, the attached chart on “Renewable Energy Production in Germany” shows that Germany’s striking success at expanding renewable power energy shift relied very heavily on wind from its 2000 adoption of the FIT.
The Germans deployed a lot of expensive wind power a decade ago. Thanks to their and others’ efforts, wind power is cheap. Technical innovations along with increased turbine size have made wind power so cheap in the present that it has become Denmark’s least expensive form of power. New Danish onshore wind projects scheduled for 2016 are set to produce power at less than half the price of coal and natural gas plants.47 Nor is this peculiar to Denmark. The Financial Times reported on September 18, 2014, that “[l]arge wind farms and solar plants are now cost-competitive with gas-fired power in many parts of the US even without subsidy.”48
Faster deployment of onshore wind in Japan is thus one comparatively inexpensive route to expanding renewable power production. The METI chart on “Tariff Rates” shows that at the FIT’s 2012 implementation, the tariff for large wind (over 20 kW) was YEN 23/kWh, far less than the YEN 42/kWh price guarantee for large-scale solar. Getting a lot of onshore wind on-line, creating employment and displacing costly fossil fuel imports and greenhouse-gas emissions, would require expanding grid capacity as well as shortening environmental assessments. In 2013, the opportunity was lost in a briar patch of bureaucratic inertia and the political focus on keeping the tottering monopolies, especially Tepco, viable in the face of massive costs from Fukushima.
But the chance was there, and remains there. This is seen in the fact that expansion of the grid for onshore wind power resources concentrated in the Tohoku region (devastated in the 3-11 disasters) is at present the subject of a survey by METI’s Agency for Energy and Natural Resources.49 Moreover, the present 3-4 years assessment periods for wind and geothermal projects are under review, in a METI Agency for Energy and Natural Resources and Energy initiative set to last between 2014-2016. The review is to select at least 10 new wind-power sites nationwide and monitor them from the beginning of the planning stage with an eye to halving the assessment period.50Only politics stands in the way of accelerating these initiatives, or finding other work-arounds. By contrast, Japan’s Ministry of Environment announced in April of 2013 that it would cut the assessment period for new coal plant from the four or more years at present to just one year.51 This suggests that political priorities, as much as technical possibilities, shape policymaking about the shifting composition of Japan’s power mix. Policymakers need to find autonomy from vested interests, so as to grasp their real resource endowments and the speed of relative price changes globally.
|
Cutting the FIT
The METI ‘s “Tariff Rate under the FIT Program” diagramme, reproduced earlier in this article, shows that the FIT started with very generous incentives for most renewables. This generosity was to stimulate business activity, and the understanding was that the tariffs would be scaled back after households’ and other potential investors’ interest was whetted. This powerful incentive was arguably especially important in Japan. Previous FIT schemes, as well as the RPS, had been managed by or on behalf of the power monopolies and the nuclear village. Captive bureaucrats in METI were in charge of promoting as well as regulating nuclear power. These actors dominated energy policymaking, and had no interest in seeing distributed renewable generation spread and undermine the economics of their aggressive commitment to centralized – and especially nuclear – power generation.52 Cutting through the toxic mountain of cynicism and investor risk built by these vested interests required a very high initial tariff. And at YEN 42/kWh, the tariff for large-scale solar was especially generous by international standards. Through Japan’s FIT, a large-scale (over 10 kilowatt) system installed in 2012 is guaranteed YEN 42 for every kilowatt-hour it generates over a period of 20 years.
As was planned, these tariffs have been reduced over time. The tariff for large-scale solar has dropped from YEN 42/kWh in 2012, YEN 38/kWh in 2013, to YEN 32/kWh as of April 2014. It is important to point out that tariff reductions (or “degressions,” as FIT experts refer to them) are an essential part of the policy. Scheduled cuts to the FIT tariffs are often interpreted in the press as a withdrawal from renewable energy, but that interpretation is inaccurate.
Tariff degressions apply to renewable power systems installed after the cuts are implemented, not to systems already installed. Degression encourages firms throughout the renewable industry, from the manufacturers to the service firms, to reduce the so-called “hard costs” of equipment and the “soft costs” (or “balance of system” costs) of installation and associated services. Trimming hard costs is primarily achieved by technical and process innovation as well as through economies of scale. Reductions in hard costs appear to have made up most of the decline in overall solar costs over the past few years, largely due to innovation among firms in the EU, Asian and North America, along with the overall industry’s economies of scale through increasing volume.
Cutting soft costs has become a major focus of initiatives in Japan as well as in the United States. Soft costs include four general categories of the “pre-install” aspects, such as preparing the site; “racking and mounting,” involving all phases of getting modules onto the desired spot (such as a roof); “electrical,” meaning wiring up the various elements of the system; and “non-production” that includes delays and down-time during other phases. Cutting these costs include faster and simpler installation as well as – for example – innovating software that simplifies paperwork.53
The good news here is that Japanese system costs have come down by 30 to 40% for solar. In the first quarter of 2010, the cost for residential solar system (under 10 KW) was YEN 598,000/kW, but had dropped to YEN 394,000/kW in the first quarter of 2014. This was a 33% decrease in costs in 4 years. But the drop in system costs for solar in the 10-50 kW class was even more pronounced. In this range, the 2010 cost of about YEN 700,000/kW fell to YEN 383,000/kW in 2013.54
The prospect of a cut in tariffs not only helps trim costs; it also gives investors the incentive to get their projects on-line as soon as possible. Startling declines in solar-system costs, in particular, mean that failure to cut the FIT tariffs might encourage investors to wait while panel prices dropped even further. This seems especially significant in Japan: After years of deflation, Japanese investors and consumers are used to delaying purchases because of the virtual certainty that prices will drop.
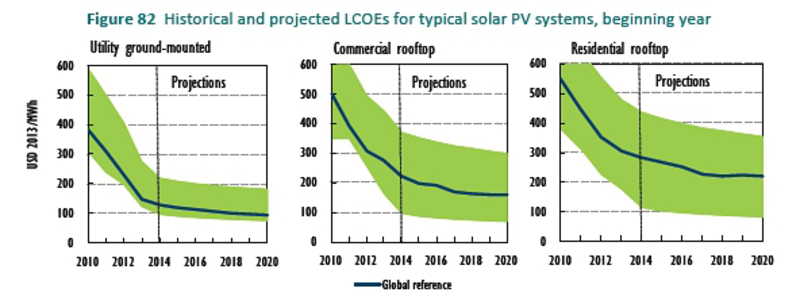
Given this backdrop, it would be much better for Japan if the METI minister and others were less concerned about saving the monopoly utilities and more focused on exploiting the incredible opportunity staring them in the face. Poorly designed tariff cuts, in tandem with continued uncertainty about grid access, risks eroding the large and expanding domestic renewable industry’s potential to increase its competitiveness as global costs for solar and other renewable systems drop. An indication of how rapid renewable costs are nosediving is seen in the attached figure, from the August 28, 2014 IEA Medium Term Renewable Energy Market Report (MTREMR).55 The chart shows that between 2010 and the most recent data for this year, the global average cost for various sizes (ie, large-scale utility to small rooftop) of solar systems has plummeted.
 Source Source |
These costs seem likely to continue falling dramatically, and almost certainly at a faster rate than predicted by the IEA. This possibility deserves an aside, as it is of direct relevance to Japan’s FIT and its energy policies in general. Renewable-energy experts argue that the new IEA solar cost data reflect an “awakening” for the agency, as it has hitherto been overly cautious in its presentation of the evidence. For example, the IEA MTREMR 2014 calculated average of 2010-2014 solar costs are a substantial reduction from those the IEA presented just a year ago in its MTREMR 2013. Moreover, the attached MTREMR 2014 chart’s projections of system-price declines from 2014 to 2020 are a sharp contrast to the US National Renewable Energy Laboratory and other reputable agencies that expect large-scale solar costs to drop to a level 40% below what the IEA now estimates.56
The IEA certainly deserves to be lauded for accumulating renewable-energy expertise in its ranks from the late 2000s, and then finally bringing out its first MTREMR in 2011. The IEA are tasked with a very difficult job in an era of very rapid and disruptive changes in relative energy costs and technically or economically exploitable resource endowments. At the same time, it has a special responsibility: its annual World Energy Outlook reports, as well as its medium-term reports on coal and other conventional energy as well as renewables (from 2011) and efficiency (from 2012), inform energy policymaking in most countries. And far more than when the IEA was first instituted in 1974, after the first oil shock, energy policymaking is crucial to achieving sustainable and equitable growth in an increasingly resource-scarce and climate-challenged world. So surely the IEA must be very cautious to ensure that its modeling assumptions about the investment costs of solar, the learning curve cost-reduction through each doubling of deployed solar capacity, and other pertinent items are consistent with best practice in specialist agencies as well as with the facts. Yet as Terje Osmundsen details in his February 2014 analysis of “How the International Energy Agency Exaggerates the Costs and Underestimates the Growth of Solar Photovoltaics,”57 the IEA’s analytical tools are clearly not keeping pace with empirical reality. It is to be lamented that the IEA, not unlike Japan’s METI Minister, seems inhibited by the weight of conventional energy staff and their assumptions in its ranks.58
Conclusion
As we have seen, Japan’s FIT has indeed produced some successes and seems set to drive even more productive change. One prominent reason is that the FIT has become linked to other large-scale policy streams, such as Japan’s proliferation of renewable energy and efficiency-centred smart communities. Large swathes of Japan’s business community and local governments appear to have concluded that the promise of cheap nuclear power as the basis for growth is not in the cards. Instead, they have turned to producing energy and innovations locally, especially in the context of smart communities, which afford an attractive base for bolstering local business, fiscal resources, and resilience. Ironically, the Abe regime appears compelled to help. Its Abenomics experiment has not gone as well as voters gambled on and as its boosters claimed it would. As a result, a revised “Local Abenomics” is underway. This is because the Abe regime faces a string of politically important local elections over the next several months.59 Team Abe will have to be careful, as their new emphasis on reviving local economies not only confronts voters doubts60 but also unfolds in the context of a public-private coalition busy implementing “local production and consumption” in energy.
Against the global backdrop of cost compression in solar, as well as similar developments in wind and other renewables, it would be absurd for the managers of the Japanese FIT to respond by maintaining high tariffs. That would mean coddling an expensive solar industry that cannot compete in a world where solar power is – as Citigroup details – already competitive with the retail price of in much of the world, without subsidies, including Japan this year.61 But at the same time, better policy coordination is crucial to further deployment and innovation in the face of monopoly utility opposition. Japan’s remarkable and costly failure on nuclear power has left it with a highly subsidized industry in search of a FIT-like price guarantee62 and monopoly utilities desperate to exclude renewable power and competitors.63 These facts should be uppermost in the minds of FIT managers and the political leadership. Some very politically wrenching choices appear inevitable, with potentially a punishingly high cost for policymaking failure. Surely the last thing one would want to do in the world’s most rapidly ageing society, with the OECD’s worst public-debt burden, is throw good money after bad by failing to exploit an abundance of renewable resources.
Andrew DeWit is Professor in Rikkyo University’s School of Policy Studies and a coordinator of The Asia-Pacific Journal. His recent publications include “Climate Change and the Military Role in Humanitarian Assistance and Disaster Response,” in Paul Bacon and Christopher Hobson (eds) Human Security and Japan’s Triple Disaster (Routledge, 2014), “Japan’s renewable power prospects,” in Jeff Kingston (ed) Critical Issues in Contemporary Japan(Routledge 2013), and (with Kaneko Masaru and Iida Tetsunari) “Fukushima and the Political Economy of Power Policy in Japan” in Jeff Kingston (ed) Natural Disaster and Nuclear Crisis in Japan: Response and Recovery after Japan’s 3/11 (Routledge, 2012). He is lead researcher for a five-year (2010-2015) Japanese-Government funded project on the political economy of the Feed-in Tariff.
Recommended Citation: Andrew DeWit, “A New Japanese Miracle? Its Hamstrung Feed-in Tariff Actually Works”, The Asia-Pacific Journal, Vol. 12, Issue 38, No. 2, September 22, 2014.
Related articles
• Japan’s Rollout of Smart Cities: What Role for the Citizens?
• •Andrew DeWit, Could a US-Japan “Green Alliance” Transform the Climate-Energy Equation?
• Andrew DeWit, Distributed Power and Incentives in Post-Fukushima Japan
• John A. Mathews, The Asian Super Grid
• Andrew DeWit, Japan’s Energy Policy at a Crossroads: A Renewable Energy Future?
• Sun-Jin YUN, Myung-Rae Cho and David von Hippel, The Current Status of Green Growth in Korea: Energy and Urban Security
Notes
1 For the details, see “With Developing Worlds Policy Support, Global Renewable Energy Generation Capacity Jumps to Record Level,” UNEP News Centre, June 3, 2014.
2 On September 10, Japan’s Nuclear Regulation Authority gave its approval for restart of the 2 nuclear reactors at the Sendai plant in Kyushu. Since the assent of local governments is required before actual restart of the plant, they may not come on-line until early 2015. See Kentaro Hamada, “Japan approves nuclear restart amid push to close old reactors,” Reuters, September 10, 2014.
3 For example, note the comments of analysts cited by Jacob Adelman and Chisaki Watanabe in “Japan Rejoining Nuclear Club Leaves Fossil Fuel Appetite,” Bloomberg News, July 29, 2014.
4 On this, see the interview with Wall Street Journal Japanese energy-policy reporter, Mari Iwata, in Clint Richards, “Interview: Japan’s Post-Nuclear Future,” The Diplomat, September 18, 2014.
5 Thomas Gerke, “The debate over restarting nuclear reactors in Japan,” Renewables International, April 9, 2014.
6 See Yuriy Humber, “Nuclear Power-less Japan Must Pay for Fuel Imports in Weak Yen,” Bloomberg Businessweek, September 18, 2014.
7 See (in Japanese) “Mid-Term Report on Conditions and Outlook for SSL, LED and Organic EL Lighting, 2014” EM Data, August 2014.
8 See p. 2 of Christine Holland, “Are LEDs the Next CFL: A Diffusion of Innovation Analysis,” 2014 ACEEE Summer Study on Energy Efficiency in Buildings paper 9-426.
9 “Vending in Japan,” Euromonitor Report, March 2014.
10 These figures are based on the Agency for Natural Resources and Energy “Electricity Survey Statistics,” and compiled by Greenpeace Japan in a September 15, 2014 article celebrating a year without nuclear power. Their summary of the data suggests that compared to 2010, the power savings in 2013 saved YEN 1.7 trillion in fossil fuel costs. See (in Japanese) “Celebrate! One Year of Zero Nuclear Generation,” Greenpeace, September 15, 2014.
11 See “Energy efficiency: a key tool for boosting economic and social development,” IEA Press Release, September 9, 2014.
12 See (in Japanese) Fujinami Takumi, “Making Conservation the Spring for This Country’s Growth: Key Items are Consumers’ Conservation Investment and the Shifting Industrial Structure,” Japan Research Institute New Energy Basic Plan Deliberation Series No. 4, Paper 2014-027, August 21, 2014.
13 For example, as the “Global Cleantech Innovation Index 2014” report comparing 40 countries (including all of the G20 members) notes on its page 8, “Cleantech venture capital is still primarily made up of energy-related technologies (51 percent in 2013), though much less so compared to 77 percent in 2010, and much more of the energy element is around efficiencies, as opposed to renewables generation.” The report is available here.
14 Tawada Yoshihisa, the head of the Japanese Solar Energy Association, stresses this fact in noting that Japanese solar initiatives date back to the mid-1950s. See (in Japanese) “Cutting through the trilemma of the 3 Es and producing a virtuous cycle,” President, September 20, 2014.
15 Masanori Tobita, “Geothermal energy is Japan’s buried treasure,” Nikkei Asian Review, October 30, 2013.
16 The New Energy and Industrial Technology Development Organization (NEDO) is Japan’s top quango for energy R&D. Its September 18, Sunshine Plan 40-Year Anniversary Special Symposium announcement and details (in Japanese) are here.
17 See “Japan’s new minister says energy policy without nuclear difficult,” Reuters, September 21, 2014. Obuchi’s remark came during the regular Sunday debate show on NHK, and the clip is available in the original Japanesehere.
18 Lovins’ profile is available at the Foundation’s web site.
19 Lovins’ comparative figures are nicely visualized (in Japanese) in the first 2 minutes of this November 2, 2012 NHK broadcast “Taking on an Energy Shift”.
20 See Amory Lovins, “How Opposite Energy Policies Turned The Fukushima Disaster Into A Loss For Japan And A Win For Germany,” Japan Renewable Energy Foundation, September 4, 2014.
21 Quirin Schiermier, “Renewable power: Germany’s energy gamble,” Nature, April 10, 2013.
22 See “RECAI Renewable Energy Country Attractiveness Index,” Issue 42, September 2014, p 20.
23 See “Conergy files for insolvency as solar crisis deepens,” Reuters, July 5, 2013.
24 One of the German sites of innovation is Karlsruhe Institute of Technology, or KIT, where storage solutions are a focus of research. See “Largest German Solar Power Storage Park,” KIT Press Release 106/2014.
25 Craig Morris, “German exports of renewable technology,” Energy Transition, August 27, 2014.
26 See Mika Ohbayashi, “Great Achievements of Feed-in Tariff and Challenges for Japan’s Renewable Energy Policy,” Japan Renewable Energy Foundation Renewables Update, September 5, 2014.
27 For the data on Japan’s power, see (in Japanese) “Current conditions and issues concerning renewable energy,” METI Agency for Natural Resources and Energy, June 17, 2014: Agency for Natural Resources and Energy
28 In technical terms, as opposed to regulatory barriers. Fast deployment of onshore wind would require shortening environmental assessments.
29 See Amory Lovins, “How Opposite Energy Policies Turned The Fukushima Disaster Into A Loss For Japan And A Win For Germany,” Japan Renewable Energy Foundation, September 4, 2014.
30 See (in Japanese) Kaneko Kenji, “The JPEA reports that the domestic soalr system market totals YEN 2.5 trillion and 210,000 jobs,” in Nikkei Tekunologii, August 22, 2014.
31 See (in Japanese) “2013 new business starts at about 110,000 firms, 4th year of increases,” Tokyo Shoko Research, August 8, 2014.
32 Its corporate history (in Japanese) is here.
33 See (in Japanese) “2013 new power business starts of 1,799 firms was 2.2 times the previous year,” Tokyo Shoko Research, August 13, 2014.
34 On this, see (in Japanese) “What is a PPS?” Epower-management, August 25, 2013.
35 The number of PPS firms, their power output, and other information is available (in Japanese) here.
36 See (in Japanese) “Orix plans to invest YEN 300 billion in renewable power over the next five years,” Nikkei Shimbun, August 14, 2014.
37 The Orix Group’s very detailed English-language website is here.
38 See (in Japanese) Kaneko Kenji, “Osaka Prefecture Izumisano City is to set up a PPS within the year, using power supplied by megasolar projects at Kansai International Airport,” Nikkei Technology, August 28, 2014.
39 The city describes the details of the contracts and their background, in Japanese, here.
40 On the plan, see (in Japanese) Ishida Masaya, “Energy production and local consumption in Kanagawa Prefecture, cutting power costs by YEN 1.5 million with megasolar,” Smart Japan, August 28, 2014.
41 See (in Japanese) Fujii Kohei and Yamashita Hidetoshi, “The Actual Conditions And Issues of Renewable Energy Use in the Municipalities,” Presentation Overview for Society for Environmental Economics and Policy Studies, SEEPS, September 13-14, 2014.
42 See (in Japanese) “21 prefectures shift power supply for head offices to PPS,” Sankei Shimbun, July 13, 2014.
43 Unfortunately, the article is not accessible online. It is (in Japanese) ““Large firms power cancellations total 11 nuclear reactors worth,” Nikkei Shimbun, August 6, 2014, page 11.
44 See (in Japanese) “Large printing firms in support of PPS,” Nihon Keizai Shimbun, August 15, 2014.
45 See “Green Growth in Kitakyushu, Japan,” OECD, May 23, 2013.
46 See (in Japanese) Tojo Yohei, “Partial supply gives strong following wind to PPS,” Construction News, August 5, 2014.
47 Ari Phillips, “Onshore Wind Power Is Now Cheapest Form Of New Electricity In Denmark,” Climate Progress, July 22, 2014.
48 Ed Crooks, “US solar and wind start to outshine gas,” Financial Times, September 18, 2014.
49 The Agency is investigating whether special purpose companies might be a suitable mechanism for securing grid access fees, construction costs, and other funds from wind producers. On this, see (in Japanese) “The Energy Agency is subsidizing an initiative in 3 areas of Tohoku aimed at expanding grid capacity for wind power,” July 15, 2014.
50 On this, see (in Japanese) “METI Agency for Natural Resources and Energy selects 10 firms for test to cut environmental assessments for wind and geothermal,” Denki Shimbun, August 19, 2014.
51 See “Japan Infrastructure Report: Energy and Utilities, Q4, 2014, Industry Forecast,” BMI Infrastructure Report, October 1, 2014.”
52 On the background, see Andrew DeWit and Iida Tetsunari, “The ‘Power Elite’ and Environmental-Energy Policy in Japan,” The Asia-Pacific Journal Vol 9, Issue 4 No 4, January 24, 2011.
53 See Koben Calhoun and Jesse Morris, “Getting To The Bottom Of US–Germany Solar Soft Cost Differences, & How To Make Solar Cheaper In US Than In Germany,” CleanTechnica, December 6, 2013.
54 See Mika Ohbayashi, “Great Achievements of Feed-in Tariff and Challenges for Japan’s Renewable Energy Policy,” Japan Renewable Energy Foundation Renewables Update, September 5, 2014.
55 The IEA report is available here.
56 See Terje Osmundsen, “Only solar PV is exceeding expectations for clean energy,” REneweconomy, September 11, 2014.
57 See Terje Osmundsen, IEA and Solar PV: Two World’s Apart, Norwegian Climate Foundation Report no. 1/2014.
58 On the anthropological and other problems in energy forecasting in general, including in the IEA, see Steve Yetiv and Lowell Field, “Why Energy Forecasting Goes Wildly Wrong,” Journal of Energy Security, October 23, 2014.
59 On the economic and political challenges for Abenomics, see Linda Sieg and Tetsuji Kajimoto, “Japan’s Abenomics feared in trouble as challenges build,” Reuters, September 2, 2014.
60 See (in Japanese) “Expectations for ‘local revival’ are split 50-50,” Nihonkai Shimbun, September 14, 2014.
61 The July 28, 2014 Citigroup analysis is “Global Energy 2020: The Revolution Will Not Be Televised as Disruptors Multiply,” and it is available here. Note that on pp 46-49 they project an restart of much of the downed nuclear capacity, but do not project nuclear to achieve its 2009 peak of 48.9 Gigawatts of power. Their scenarios for solar, by contrast, see it supplying at least 45.2 Gigawatts of power by 2013 and perhaps as much as 109.7 Gigawatts. They also make note of “wild cards” at the intersection of energy and technology (p. 31), but neglect the items taken up later in this paper.
62 The nuclear village are clearly paying attention to falling renewable prices. On August 21, 2014, the METI formally proposed a UK-style price guarantee for nuclear power, should its cost become uncompetitive. See (in Japanese) “METI is keen to introduce a ‘price guarantee’ for nuclear, but passing costs onto users is meeting stiff criticism,” Reuters, August 21, 2014.
63 For example, on September 19, Kyushu Electric announced that it was considering a halt to purchases of renewable power in its service area, citing concern over capacity of the grid. See (in Japanese) “Kyushu Electric announces that it is considering halting renewable purchases,” Mainichi Shimbun, September 20, 2014.