


All Global Research articles can be read in 51 languages by activating the “Translate Website” drop down menu on the top banner of our home page (Desktop version).
To receive Global Research’s Daily Newsletter (selected articles), click here.
Visit and follow us on Instagram at @crg_globalresearch.
Important study conducted by German Scientists
***
Summary
The correlation between the excess mortality in the federal states and their vaccination rate when weighted with the relative number of inhabitants of the federal state is 0.31. This number is surprisingly high and would be negative if vaccination were to reduce mortality. For the period under consideration (week 36 to week 40, 2021), the following applies: The higher the vaccination rate, the higher the excess mortality. In view of the forthcoming policy measures aimed at reducing the virus, this figure is worrying and needs to be explained if further policy measures are to be taken with the aim of increasing the vaccination rate.
To get started
1. The overall overview of the current excess mortality in Germany as a whole can be found here.
2. And also here, whereby the deviation from the median of the years 2016 -2020 can be read directly here.
These two graphics are interactive, i.e. the numbers are displayed directly as soon as you move the mouse pointer over them. Looking at weeks 36 to 43, the comparison between 2021 and the median 2016 to 2020 shows the excess mortality in these COGs directly in absolute figures. In some of these weeks, there are actually about 2000 deaths more than the median from 2016 to 2020.
Mortality rates and vaccination rates are recorded particularly reliably. Whether someone is vaccinated twice is as indisputable as the question of whether someone has died. If you look at more complex variables such as the cause of death, this is not the case: the determination of causes of death such as “died of Covid-19 infection” depends relatively strongly on interpretations. A positive test is by no means proof of this cause of death. Death rates and vaccination rates, on the other hand, are based only to a small extent on interpretations.
Our data sources
The data we use are taken from
1. STatist Federal Office (see this)
2. Robert Koch Institute (see this)
(The link in question, where you can download the relevant numbers as an Excel file, is given in parentheses.)
What did we do?
1. Calculation of excess mortality
For each of the 16 federal states, we have added up the number of deaths in the KWn 36 to 40 for each year 2016 to 2021. (Newer ones are not yet available for the individual federal states to date, Nov. 16, 2021.) This results in the number of deaths for each federal state and year in the period from week 36 to week 40. For a comparative value of the number of deaths in weeks 36 to week 40 in 2021, we have averaged the death rates in week 36 to week 40 for the years 2016 to 2020. For each federal state, these average values of recent years are the basis for comparisons with 2021. For the comparison, we formed the ratio of the number of deaths in 2021 in the period from week 36 to week 40 by the averaging values just mentioned and then multiplied it by 100. The ratio 100 therefore means that there is neither excess nor under-mortality, the ratio 110 states that in the period under consideration 2021 exactly 10% more people died than in the average of the previous 5 years. The actual figures vary among the 16 states between 102.2 (Saxony) and 115.7 (Mecklenburg-Western Pomerania). The greater the deviation (from 100) upwards, the greater the excess mortality in the respective federal state.
2. Vaccination rate
We were able to find the vaccination rate directly from the table mentioned under Data Sources (point 2). The quota of twice vaccinated people has been chosen.
3. Calculation of the correlation between vaccination rate and excess mortality
The 16 countries have very different populations. The Hanseatic city of Bremen has only about 0.68 million inhabitants, the state of North Rhine-Westphalia, on the other hand, about 17.92 million. (These figures can also be found at the Federal Statistical Office.) When calculating the correlation between vaccination rate and excess mortality, we used relative population size as weights (as well as means and variances). In this way, distortions in favour of the situation in the small countries are avoided.
The following figure shows a scatter plot of the 16 data points (of the federal states). The vaccination rate is on the horizontal axis and the ratio is removed on the vertical axis, where the size of the area of the points represents the relative population.
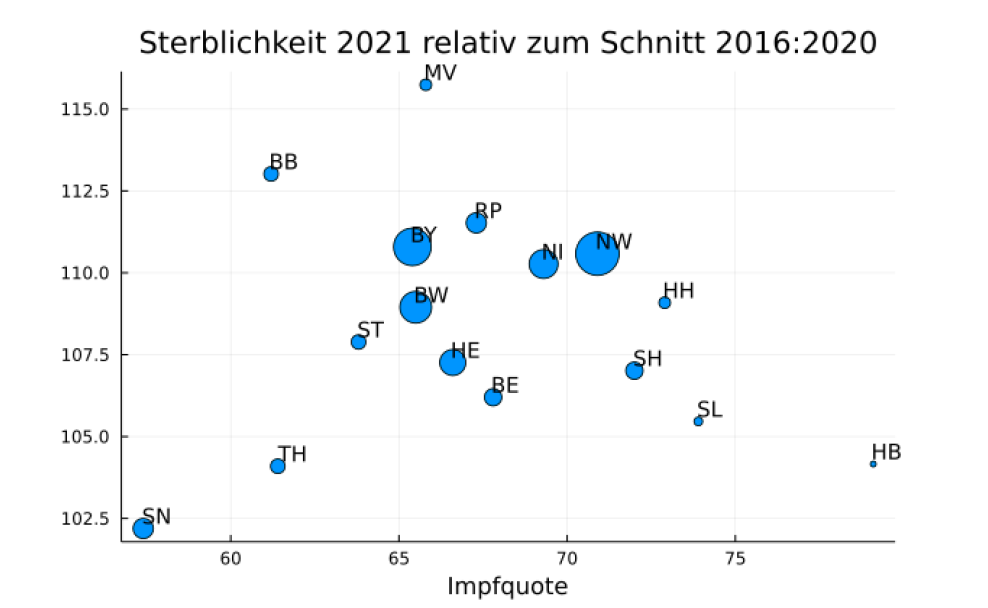
According to this figure, Saxony (SN) and Thuringia (TH) perform best in terms of current excess mortality. They also have the lowest vaccination rates.
4. Interpretation of the result
The correlation is + 0.31, is amazingly high and especially in an unexpected direction. Actually, it should be negative, so that one could say: The higher the vaccination rate, the lower the excess mortality. However, the opposite is the case and this urgently needs to be clarified. Excess mortality can be observed in all 16 countries. The number of Covid deaths reported by the RKI in the period under consideration consistently represents only a relatively small part of mortality and, above all, cannot explain the critical facts:
The higher the vaccination rate, the higher the excess mortality.
The most direct explanation is:
1. Complete vaccination increases the likelihood of death.
Of course, more indirect explanations are possible:
2. The higher the proportion of the elderly, the higher the vaccination rate and excess mortality. Therefore, vaccination rates and excess mortality also correlate. (However, this explanation is not veryplausible, as the proportion of old people would then have changed significantly between 2016-2020 on the one hand and 2021 on the other.)
3. Higher vaccination rates are achieved by increased stress and anxiety in the country concerned and the latter lead to increased numbers of deaths.
Further explanations are by no means excluded. Some of these may also be supported by figures and should be further investigated. We are very grateful for suggestions of this kind.
*
Note to readers: Please click the share buttons above or below. Follow us on Instagram, @crg_globalresearch. Forward this article to your email lists. Crosspost on your blog site, internet forums. etc.
Featured image is from UsforThem