


All Global Research articles can be read in 51 languages by activating the “Translate Website” drop down menu on the top banner of our home page (Desktop version).
To receive Global Research’s Daily Newsletter (selected articles), click here.
Follow us on Instagram and Twitter and subscribe to our Telegram Channel. Feel free to repost and share widely Global Research articles.
***
Section 1: Purpose of the Survey
The purpose of this survey was to gather a high-level view of U.S. Group Term Life Insurance mortality results during the COVID-19 pandemic, as compared to prior period baseline mortality results. This report is an update to the previous Group Life COVID-19 Mortality Survey published in January 2022, which included pandemic data from April 2020 through September 2021. This update includes Group Life mortality results from April 2020 through March 2022 (referred to in this report as the “pandemic period”), representing 24 months of Group Life mortality experience during the COVID-19 pandemic. COVID-19 is caused by the novel coronavirus SARS-CoV-2, which was identified in 2019. As of the writing of this document, complications from COVID-19 have resulted in more than 1.0 million deaths in the U.S. alone, and more than 6.4 million worldwide.
The survey was conducted by the Group Life Experience Committee (the Committee) of the Society of Actuaries and has been structured as a recurring monthly data collection and compilation process from U.S. Group Term Life insurers. The datasets for this report encompass all Group Term Life claims for the calendar years 2017–2022 reported to participating carriers as of March 31, 2022, and include more than 2.3 million claims and more than $103 billion in earned premium. The Committee is grateful that 20 of the top 21 U.S. Group Term Life insurers focused on employer groups are participating in this survey, with market share representing roughly 90% of the employer-based Group Term Life industry. Thus, the Committee believes the findings herein are representative of the COVID-19 mortality impact on the U.S. Group Term Life industry as a whole.
Guiding principles for the survey include the following:
- Providing timely information on total high-level Group Life mortality results versus baseline expectations during the pandemic is the most important goal. Thus, the survey is not a seriatim mortality study. Rather, it is a synopsis of monthly Group Life exposures, death counts and amounts.
- It is critical for this survey to compare current Group Life mortality from all causes of death to the baseline expected all-cause mortality levels. The Committee recognizes that there are limitations in the ability to code deaths as COVID-19 related, within both the general population and Group Life exposures. Also, the survey seeks to analyze whether the pandemic has had indirect impacts on population mortality, beyond deaths associated directly with the COVID-19 virus. Thus, tracking just Group Life deaths coded with a cause of COVID-19 may not accurately measure the total impact of the pandemic.
- The Committee asked carriers to provide segmentation data when feasible. However, the Committee did not want the additional detailed data request to become so onerous that it materially delayed the survey reporting process or shrank the number of carriers willing and able to participate. Thus, the survey includes high-level exposure and claims data for all 20 carriers, but much of the segmentation data are based on results for just subsets of carriers.
Section 2: Overview
2.1 Background
Carriers provided a complete set of monthly Group Life exposures dating back to January 2017, along with all Group Life death claims reported in January 2017 or later. The reported death claims also identified the months of death, i.e., incurred months.
Exposures and deaths during the three-year period of 2017–2019 were used to set baseline mortality expectations. The dataset for this report encompasses all Group Life claims reported to participating carriers as of March 31, 2022. Reported claims are easier to measure than incurred claims, but they do not tell the full story about Group Life mortality through March 2022 because the reported claims in a given month include deaths from prior periods. Therefore, claim reporting patterns from prior periods have been analyzed to develop completion factors, which are used to estimate incurred but not yet reported (IBNR) claims for each month. This enabled the Committee to estimate incurred claims for each month up through March 2022.
As in prior reports, the most recent one-to-two incurral months should not be fully relied upon because of the maturity of the completion of reported claims, with the completion factors for the most recent two months falling in the 30%–35% and 70%–75% ranges, respectively. The Committee has observed significant reporting lag volatility over the course of the study, resulting in volatility of incurred incidence development over time, especially in the most recent incurred months.
2.2 Scope
The following specifications were used to define claims and exposures within the survey:
- Include Group Term Life only. Exclude Group Whole Life, Group Universal Life, Company-Owned Life Insurance, 10- or 20-year Group Term, etc.
- Include both list billed and self-administered business.
- Include employee, spouse and child exposures and deaths.
- Include both active and retired lives and claims.
- Include death benefits only; exclude riders, interest payments and claims expenses.
- Include only the life insurance benefit for accidental deaths; exclude any additional Accidental Death and Dismemberment rider amounts.
- Exclude Waiver of Premium disabilities but include deaths from persons on Waiver of Premium status.
- Portability and Conversion exposures and claims may be either included or excluded based on each company’s internal reporting procedures.
2.3 Survey Highlights
Tables 2.1 through 2.41 display high-level incidence results for the second quarter of 2020 through the first quarter of 2022 compared to the 2017-2019 baseline period for each combination of (a) incurred/reported basis and (b) count/amount basis as of March 31, 2022. In these tables, the number of COVID-19 claims has not been adjusted for seasonality, but the ratios to baseline have been adjusted for seasonality.
Note that additional data reported in April and May 2022 indicated that the 1Q 2022 excess mortality would likely complete downward from the 19.9% shown below using March data. The fully complete 1Q 2022 excess mortality is expected to remain above 15%.

Group Life carriers generally started receiving a small number of COVID-19 death claims during March 2020, but April 2020 was the first month in which the Group Life industry saw a material number of reported COVID-19 death claims. This drove April 2020 Group Life reported incidence to be measurably larger than baseline expected reported incidence. Reported incidence has remained materially higher than baseline in almost all months during the pandemic period. The lone exception was May 2021, during which reported incidence was approximately 1% lower than baseline.
It is important to note that incurred estimates for the most recent months lack credibility because of the low level of completion of the data used at the time of this analysis. Group Life claim completion has been especially volatile during the pandemic waves, driven both by the ultimate incurred levels fluctuating from month to month and by company-specific claim processing speeds fluctuating up and down because of increases or decreases in staffing levels and build-up or build-down of claim backlogs.
From an incurred mortality viewpoint, all 24 months from April 2020 through March 2022 showed excess mortality2 versus baseline expectations. December 2020, August 2021, and September 2021 each had very high incurred mortality spikes of 40% or more, whereas the other 21 months ranged from a low of 5% excess incurred mortality to a high of 29% excess incurred mortality above baseline.
The 24-month period of April 2020 through March 2022 showed the following Group Life mortality results:
- Estimated reported Group Life claim incidence rates were up 20.0% on a seasonally-adjusted basiscompared to 2017–2019 reported claims.
- Estimated incurred Group Life incidence rates were 20.9% higher than baseline on a seasonally-adjusted basis. As noted above, the incurred incidence rates in February and March 2022 are based on fairly incomplete data, so they are subject to change and should not be fully relied upon at this point.Additional highlights include the following:
- Approximately 13% of all reported Group Life claims with death dates in the pandemic period were determined to have a cause of death of COVID-19.
- The Grey-collar group had the lowest actual-to-expected ratios (A/Es) relative to baseline over the pandemic period at around 17%, followed by the Blue-collar group at 19%. The White-collar group continues to have the highest mortality A/E relative to baseline at 23% during the pandemic period.
- Group Life mortality patterns by region have changed over time during the COVID-19 pandemic. The Midwest region had the highest excess mortality for the two most recent quarters included in this update. The following regions had the highest excess mortality in each quarter shown:
- Q2 2020: Northeast (48%)
- Q3 2020: Southeast (33%)
- Q4 2020: Midwest (38%)
- Q1 2021: Southeast (39%)
- Q2 2021: Southeast (16%)
- Q3 2021: Southeast (70%)
- Q4 2021: Midwest (38%)
- Q1 2022: Midwest (34%)
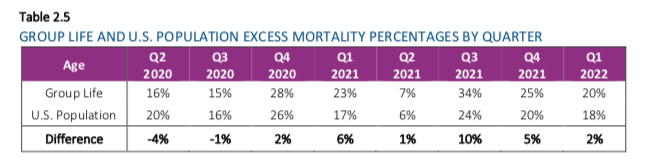
- Relative to prior years, the Group Life insured population studied within this survey experienced a greater percentage increase in deaths than the U.S. population as a whole. The percentage of excess deaths in the Group Life survey data was observed to be 105% – 125% of the percentage of excess deaths in the U.S. population.
- Early quarters of the pandemic period (Q2 and Q3 2020) showed the Group Life insured population studied within this survey experienced a lower percentage of excess deaths than the U.S. population. Beginning in the fourth quarter of 2020, this relationship flipped, with subsequent quarters indicating higher excess mortality for the Group Life insured population by a percentage difference ranging from 2% to 10% (additive) by quarter. The Q1 2022 relationship appears to be reverting back toward the pattern from 2020, as shown in Table 2.5.
- Note that additional data reported in April and May 2022 indicated the Q1 2022 Group Life excess mortality would likely complete downward from the 20% shown below using March data. It is expected that the fully complete Group Life excess mortality will be lower than U.S. population excess mortality for Q1 2022.
- In the third quarter of 2021, a moderate negative correlation was seen between vaccination rate and excess mortality by state. However, this correlation weakened during the fourth quarter of 2021 and the first quarter of 2022. Other factors potentially influencing this relationship are climate, seasonality, preventative measures (e.g., social distancing and masking), deaths from causes other than COVID-19, varying degrees of vaccine effectiveness against different variants of the virus, and a higher degree of natural immunity due to past infections in the later period. This is explained in further detail in subsection 8.3.
Section 3: Group Life Mortality Results—Reported Death Claims
3.1 Reported Claim Incidence by Count — All Causes
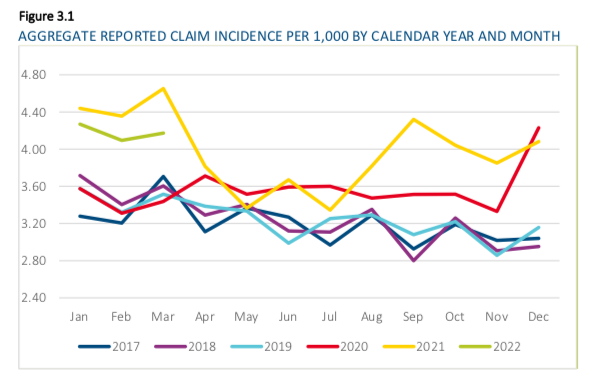
Excess reported-basis mortality was observed in almost every month of the pandemic period, with May 2021 being the lone month where reported incidence was consistent with or less than the corresponding baseline months.
Reported overall Group Life claim incidence rates during the pandemic period, as shown in Figure 3.1, are up roughly 20% compared to 2017–2019 reported claims. Reported claims are easier to measure than incurred, as no estimation of completeness is required. However, reported claims do not tell the true economic impact of what is happening in the claim experience of a particular reported period, because those reported claims include deaths associated with prior periods, which may or may not have been accurately expected and accrued in prior period claim liabilities.
Note that incidence rates shown here are higher than in the January 2022 report. This is due to data corrections from participating companies that lowered the exposure by approximately 8% versus the previous report. It is not due to claim runout versus previous expectations. The corrections applied to both the baseline period and the pandemic period, so excess mortality calculations were not materially affected.
3.2 Reported Claim Incidence by Count — COVID-19 versus All Other Causes
A total of 135,567 COVID-19 death claims were reported during the pandemic period. Roughly 75% of the COVID-19 claims were for Basic Group Life coverage and roughly 25% for Supplemental/Voluntary coverage, with both figures including active employees and retirees. Note that the exposures and claim counts for insureds with both Basic and Supplemental/Voluntary coverage were included in both product lines. Thus, some deaths were counted as both Basic and Supplemental/Voluntary deaths, so the total number of Group Life insureds with COVID-19 deaths is less than 135,567.
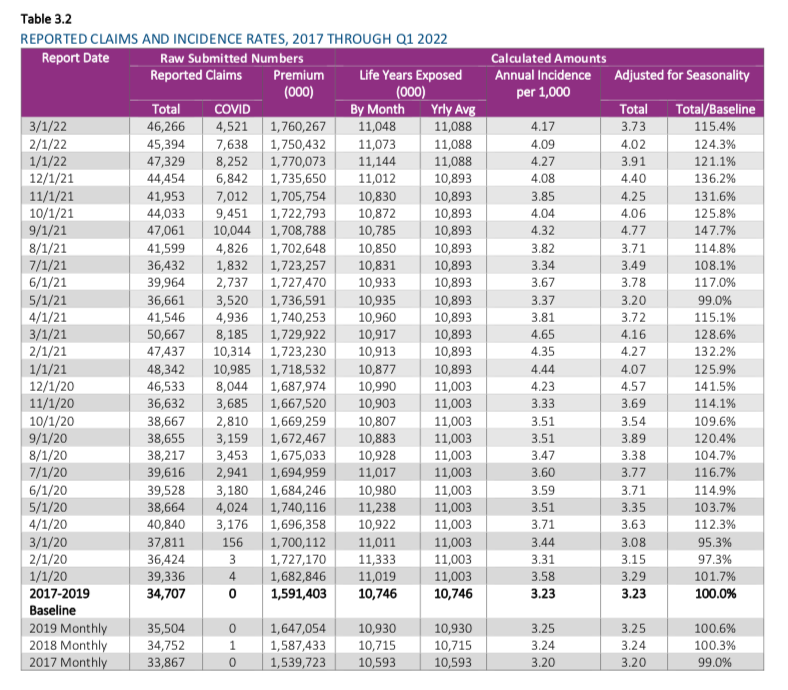
Table 3.1 shows the total death claim incidence level (mortality rate) for each quarter during the pandemic relative to the baseline period metric. The table also shows a relativity for COVID-19 claims and non-COVID claims. As the table illustrates, COVID-19 claims do not fully explain the increase in reported claim incidence over the baseline period.

Reported claim details by month are shown in Table 3.2, along with calculated monthly reported incidence rates. Note that a small number of COVID-19 claims have reported dates of death in 2019 or prior, which are likely due to data errors.
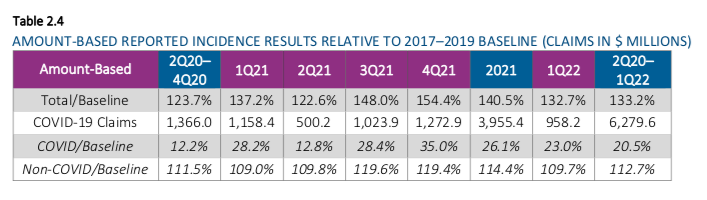
3.3. Reported Claim Incidence by Amount — All Causes
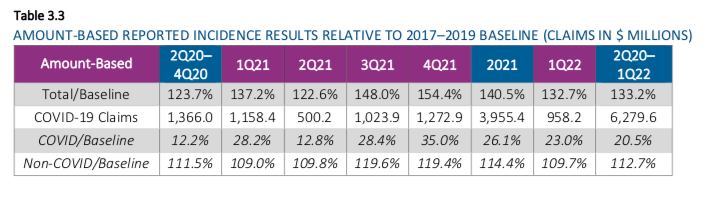
Reported overall Group Life claim incidence rates by amount during the pandemic period were up roughly 33% compared to 2017–2019 reported amounts. This increase in incidence rates by amount is notably higher than the corresponding incidence rate increase by count. The Committee estimates that roughly half the difference is due to changes in age and gender mix, and the remainder is likely due to salary and face amount inflation over the four- year period.
3.4 Reported Claim Incidence by Amount — COVID-19 versus All Other Causes
Click here to read the full report.
*
Note to readers: Please click the share buttons above or below. Follow us on Instagram and Twitter and subscribe to our Telegram Channel. Feel free to repost and share widely Global Research articles.
Featured image is from NaturalNews.com