|
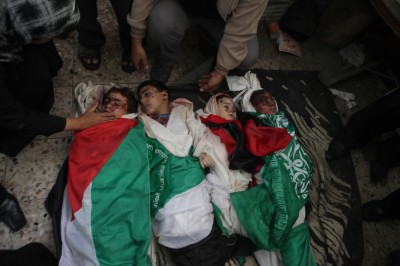
Funeral for four children of the al-Dalu family, killed when an Israeli airstrike leveled their Gaza City home on November 19, 2012. (Electronic Intifada and Anne Paq / ActiveStills)
The tables below are updated monthly. For more detailed statistics, please contact the DCI-Palestine ‘s Documentation Unit.
Tables 1 to 4 show the number of children killed as a result of Israeli military and settler presence in the Occupied Palestinian Territory since the beginning of the second Palestinian uprising against occupation, or Intifada, according to DCI-Palestine’s documentation. These tables do not include children killed while involved in hostilities.
Table 5 shows the number of children killed while involved in hostilities since 2008, according to DCI-Palestine’s documentation.
1. Distribution of Palestinian child fatalities by month:
| Year |
Jan |
Feb |
Mar |
Apr |
May |
Jun |
Jul |
Aug |
Sep |
Oct |
Nov |
Dec |
Total |
| 2000 |
0 |
0 |
0 |
0 |
0 |
0 |
0 |
0 |
3 |
35 |
45 |
11 |
94 |
| 2001 |
3 |
3 |
8 |
12 |
9 |
5 |
8 |
8 |
12 |
6 |
9 |
15 |
98 |
| 2002 |
3 |
9 |
35 |
36 |
15 |
10 |
13 |
10 |
12 |
19 |
16 |
14 |
192 |
| 2003 |
11 |
12 |
18 |
14 |
17 |
8 |
1 |
6 |
7 |
15 |
9 |
12 |
130 |
| 2004 |
6 |
3 |
15 |
14 |
36 |
8 |
13 |
9 |
25 |
21 |
6 |
6 |
162 |
| 2005 |
20 |
4 |
2 |
3 |
2 |
1 |
6 |
6 |
3 |
4 |
1 |
0 |
52 |
| 2006 |
3 |
3 |
5 |
6 |
2 |
9 |
40 |
14 |
10 |
5 |
24 |
3 |
124 |
| 2007 |
4 |
1 |
5 |
2 |
9 |
10 |
2 |
8 |
4 |
2 |
3 |
0 |
50 |
| 2008 |
6 |
10 |
22 |
21 |
4 |
4 |
2 |
1 |
2 |
0 |
0 |
40 |
112 |
| 2009 |
301 |
4 |
1 |
1 |
0 |
2 |
1 |
1 |
2 |
1 |
1 |
0 |
315 |
| 2010 |
1 |
0 |
2 |
0 |
1 |
0 |
0 |
0 |
2 |
0 |
0 |
2 |
8 |
| 2011 |
2 |
0 |
4 |
2 |
1 |
0 |
0 |
4 |
1 |
0 |
0 |
1 |
15 |
| 2012 |
0 |
0 |
4 |
0 |
0 |
3 |
0 |
0 |
0 |
0 |
35 |
1 |
43 |
| 2013 |
2 |
0 |
0 |
0 |
0 |
0 |
0 |
1 |
0 |
0 |
0 |
2 |
5 |
| 2014 |
1 |
0 |
1 |
0 |
2 |
2 |
1 |
|
|
|
|
|
7 |
Total: 1407
2. Distribution of Palestinian child fatalities by age group:
| Year |
0-8 |
9-12 |
13 – 15 |
16 – 17 |
Total |
| 2000 |
4 |
9 |
34 |
47 |
94 |
| 2001 |
13 |
21 |
31 |
33 |
98 |
| 2002 |
50 |
33 |
62 |
47 |
192 |
| 2003 |
16 |
22 |
47 |
45 |
130 |
| 2004 |
13 |
29 |
58 |
62 |
162 |
| 2005 |
2 |
10 |
19 |
21 |
52 |
| 2006 |
26 |
12 |
40 |
46 |
124 |
| 2007 |
3 |
8 |
17 |
22 |
50 |
| 2008 |
22 |
13 |
38 |
39 |
112 |
| 2009 |
93 |
63 |
83 |
76 |
315 |
| 2010 |
0 |
0 |
3 |
5 |
8 |
| 2011 |
2 |
3 |
6 |
4 |
15 |
| 2012 |
18 |
8 |
8 |
9 |
43 |
| 2013 |
1 |
0 |
2 |
2 |
5 |
| 2014 |
0 |
1 |
2 |
4 |
7 |
Total: 1407
3. Distribution of Palestinian child fatalities by region:
| Year |
Gaza
|
Hebron |
Bethlehem |
Jericho |
Jerusalem |
Ramallah |
Salfit |
Nablus |
Tulkarm |
Qalqilia |
Jenin |
Inside Israel |
Total
|
| 2000 |
43 |
9 |
4 |
0 |
3 |
7 |
3 |
8 |
6 |
5 |
5 |
1 |
94 |
| 2001 |
64 |
9 |
5 |
0 |
4 |
6 |
0 |
1 |
0 |
3 |
6 |
0 |
98 |
| 2002 |
84 |
13 |
6 |
0 |
3 |
11 |
0 |
33 |
10 |
1 |
31 |
0 |
192 |
| 2003 |
74 |
3 |
1 |
0 |
3 |
5 |
2 |
16 |
9 |
3 |
14 |
0 |
130 |
| 2004 |
130 |
2 |
0 |
0 |
1 |
2 |
0 |
19 |
3 |
0 |
5 |
0 |
162 |
| 2005 |
28 |
4 |
0 |
1 |
0 |
5 |
1 |
3 |
4 |
1 |
5 |
0 |
52 |
| 2006 |
105 |
0 |
2 |
1 |
1 |
1 |
0 |
9 |
1 |
0 |
4 |
0 |
124 |
| 2007 |
33 |
2 |
0 |
0 |
2 |
7 |
0 |
0 |
2 |
0 |
4 |
0 |
50 |
| 2008 |
101 |
4 |
2 |
0 |
0 |
3 |
0 |
1 |
0 |
0 |
1 |
0 |
112 |
| 2009 |
310 |
3 |
0 |
0 |
0 |
0 |
0 |
0 |
0 |
0 |
2 |
0 |
315 |
| 2010 |
5 |
0 |
0 |
0 |
0 |
1 |
0 |
2 |
0 |
0 |
0 |
0 |
8 |
| 2011 |
14 |
1 |
0 |
0 |
0 |
0 |
0 |
0 |
0 |
0 |
0 |
0 |
15 |
| 2012 |
40 |
3 |
0 |
0 |
0 |
0 |
0 |
0 |
0 |
0 |
0 |
0 |
43 |
| 2013 |
1 |
0 |
1 |
0 |
0 |
2 |
0 |
0 |
0 |
0 |
1 |
0 |
5 |
| 2014 |
2 |
2 |
0 |
0 |
1 |
2 |
0 |
0 |
0 |
0 |
0 |
0 |
7 |
Total: 1407
4. Distribution of Palestinian child fatalities according to circumstances of death:
| Year |
Clashes |
Air and Ground Attacks
|
During Assassination Attempts
|
Gun Fire Opened Randomly
|
Closures |
Unexploded Ordnance |
Other |
Total |
| 2000 |
80 |
4 |
0 |
9 |
1 |
0 |
0 |
94 |
| 2001 |
42 |
17 |
12 |
17 |
3 |
7 |
0 |
98 |
| 2002 |
30 |
67 |
19 |
50 |
9 |
12 |
5 |
192 |
| 2003 |
36 |
37 |
14 |
38 |
3 |
2 |
0 |
130 |
| 2004 |
36 |
76 |
9 |
39 |
0 |
2 |
0 |
162 |
| 2005 |
6 |
10 |
7 |
23 |
0 |
6 |
0 |
52 |
| 2006 |
10 |
66 |
22 |
23 |
0 |
3 |
0 |
124 |
| 2007 |
6 |
19 |
4 |
15 |
1 |
5 |
0 |
50 |
| 2008 |
9 |
86 |
1 |
13 |
1 |
2 |
0 |
112 |
| 2009 |
2 |
270 |
21 |
15 |
1 |
5 |
1 |
315 |
| 2010 |
3 |
3 |
0 |
0 |
0 |
2 |
0 |
8 |
| 2011 |
0 |
12 |
0 |
2 |
0 |
1 |
0 |
15 |
| 2012 |
0 |
39 |
0 |
2 |
0 |
2 |
0 |
43 |
| 2013 |
3 |
1 |
0 |
1 |
0 |
0 |
0 |
5 |
| 2014 |
3 |
0 |
1 |
2 |
0 |
0 |
1 |
7 |
Total: 1407
5. Distribution of Palestinian Children killed while participating in hostilities:
| Year |
Jan |
Feb |
Mar |
Apr |
May |
Jun |
Jul |
Aug |
Sep |
Oct |
Nov |
Dec |
Total |
| 2008 |
4 |
0 |
7 |
0 |
3 |
0 |
0 |
0 |
1 |
1 |
0 |
0 |
16 |
| 2009 |
15 |
0 |
1 |
1 |
0 |
0 |
0 |
1 |
0 |
0 |
0 |
0 |
18 |
| 2010 |
0 |
0 |
0 |
0 |
2 |
0 |
0 |
0 |
0 |
0 |
0 |
0 |
2 |
| 2011 |
0 |
0 |
0 |
0 |
1 |
0 |
0 |
0 |
0 |
0 |
0 |
0 |
1 |
| 2012 |
0 |
0 |
1 |
1 |
0 |
0 |
0 |
0 |
0 |
0 |
1 |
0 |
3 |
| 2013 |
0 |
0 |
0 |
0 |
0 |
0 |
0 |
0 |
0 |
0 |
0 |
0 |
0 |
| 2014 |
0 |
0 |
0 |
0 |
0 |
0 |
|
|
|
|
|
|
0 |
Total: 40
|