where m is the slope of the best-straight-line fit through the original ACM by time unit (day, week, month…) versus numbered time unit, ΔT is the number of time units between Y(0) and Y(−1) (i.e., between the start of the Y(0) integration window and the start of the Y(−1) integration window), and W is the inclusive width of the integration window in number of time units. This assumes that the ACM by time varies on a straight line, notwithstanding seasonal variations, on the near segment used to obtain the best-straight-line fit. The resulting excess mortality for the integration window or period, xACM(0), is then:
where ACM(0) is the integrated ACM in the period of interest. The statistical error (standard deviation) in xACM(0) is then given by:
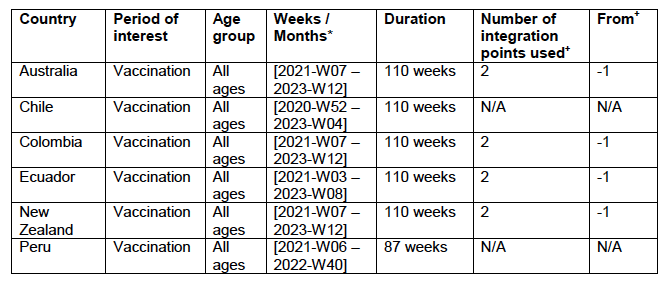
where sig(m) is the nominally statistical error in m. If there is no seasonal variation in ACM, as occurs in equatorial-latitude jurisdictions, then sig(m) is the actual statistical error in m. With seasonal variations in ACM, sig(m) extracted from the least squares fitting to a straight line does not have a simple meaning. In this case, sig(m) will incorporate uncertainty arising from seasonal variations, and increases with increasing amplitude of the seasonal variation. 4.3 Application of the Methods to the Specific CountriesThe parameters for applying the methods (Methods 1 and 2) to the data are given in Appendix C: Technical and specific information for applications of the methods to the data.
5. Results
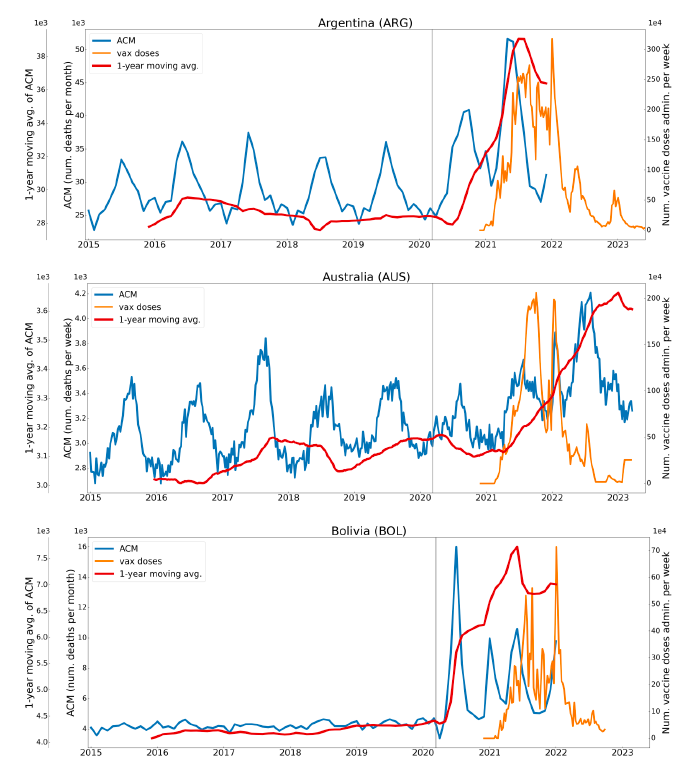
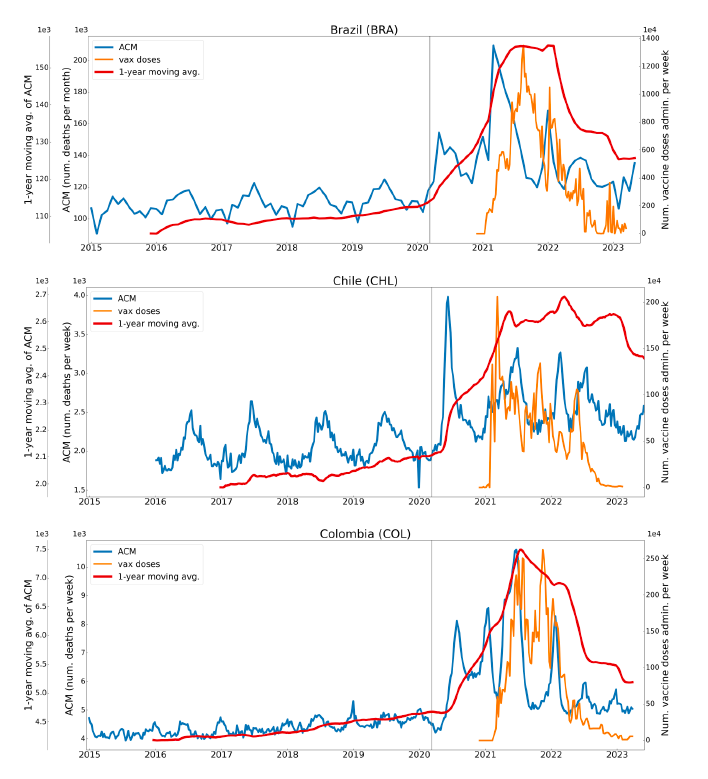
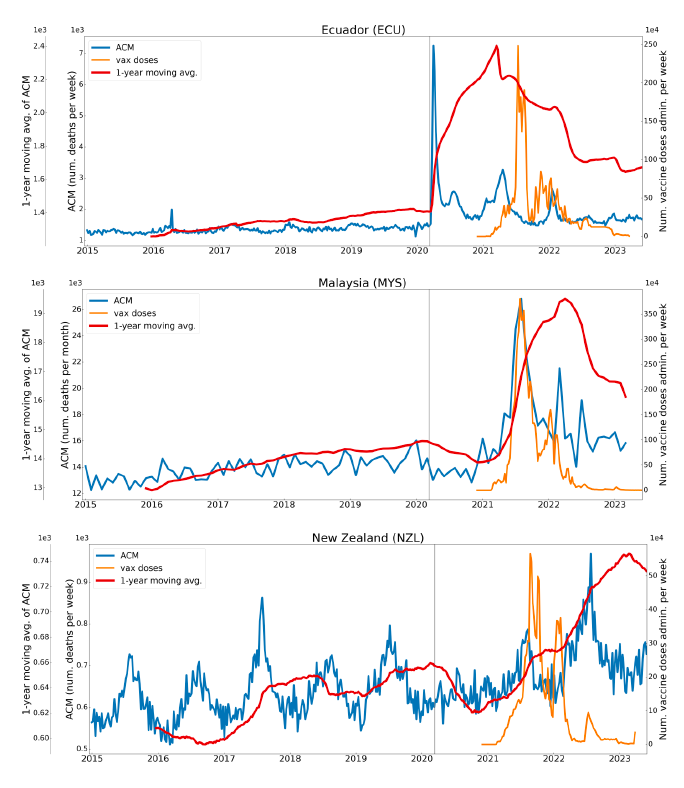
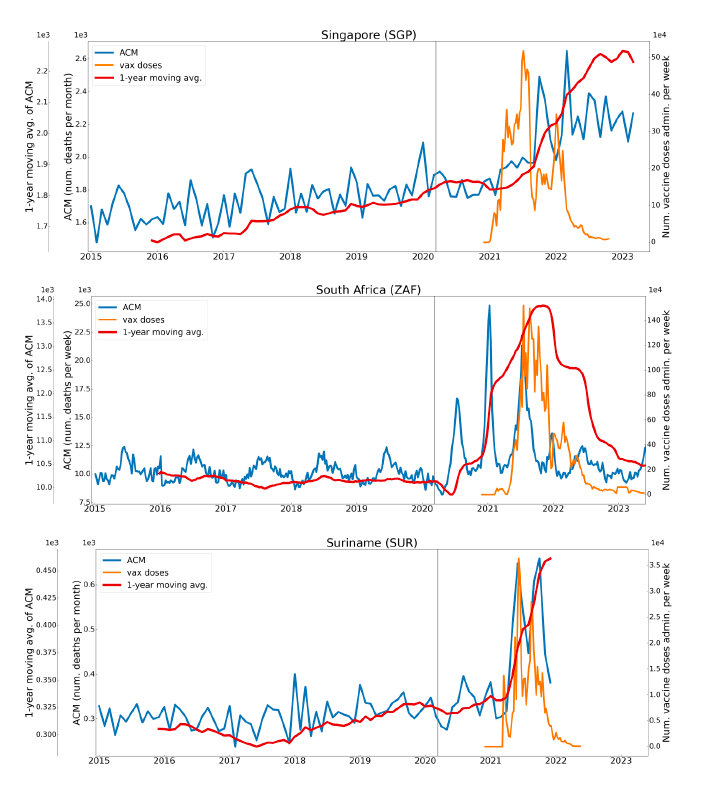
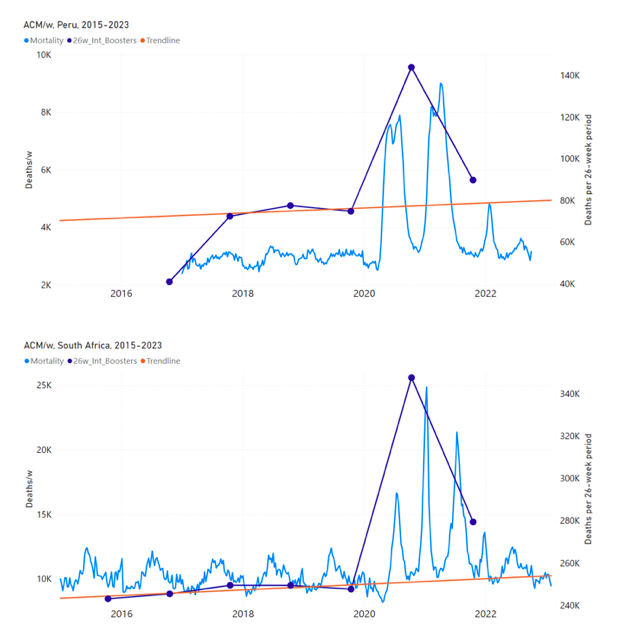
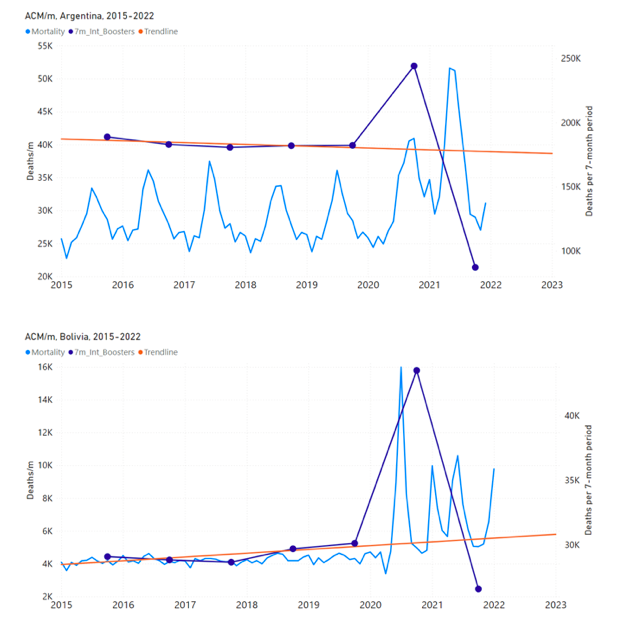
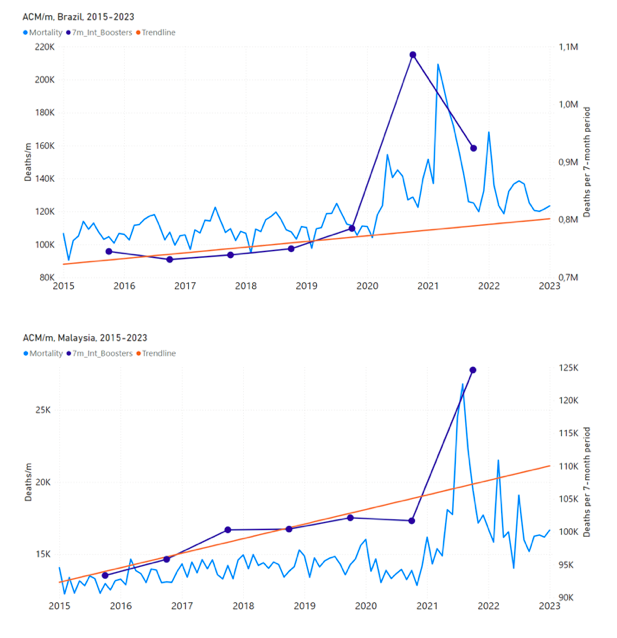
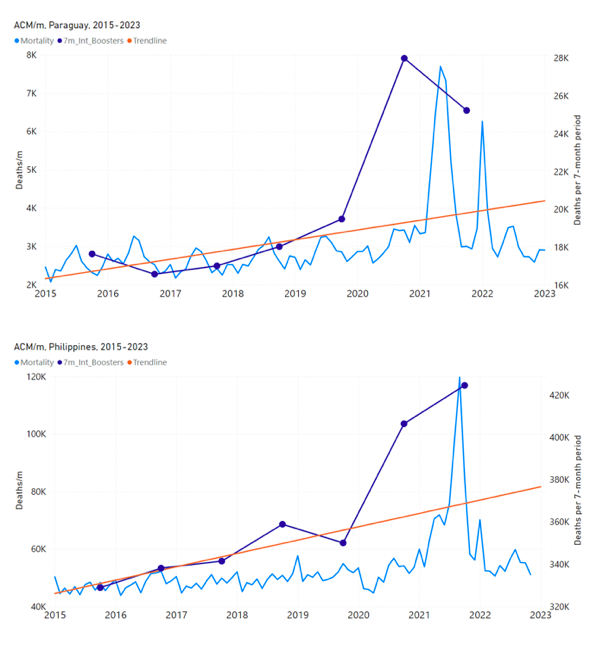
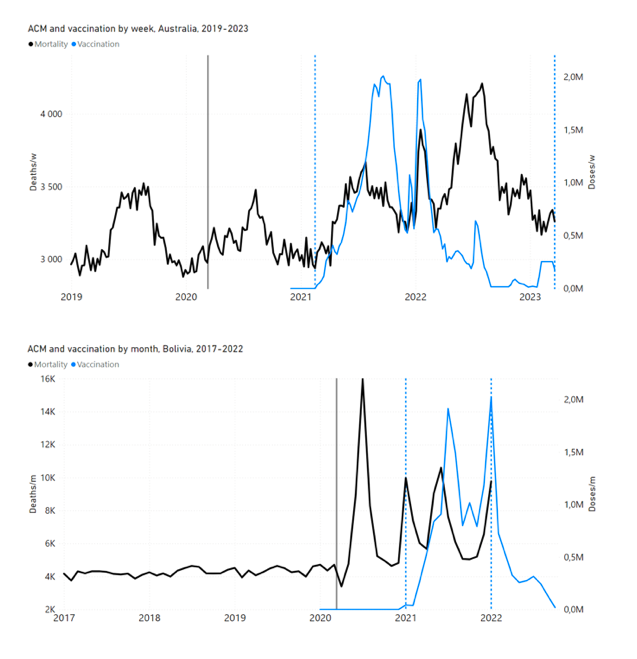
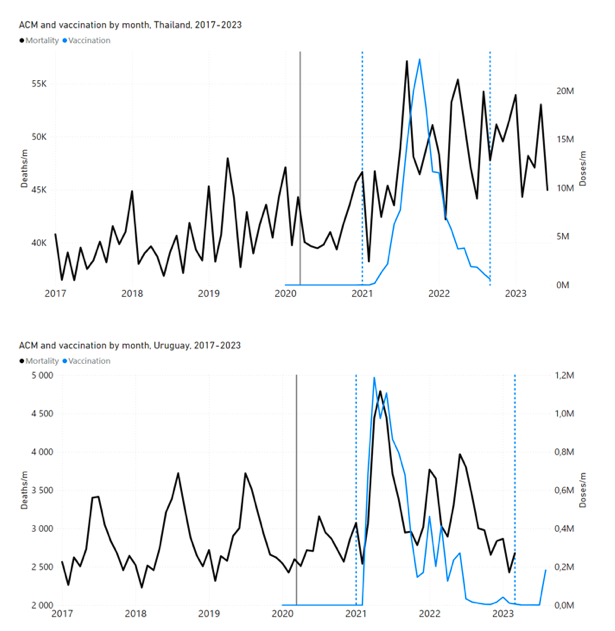
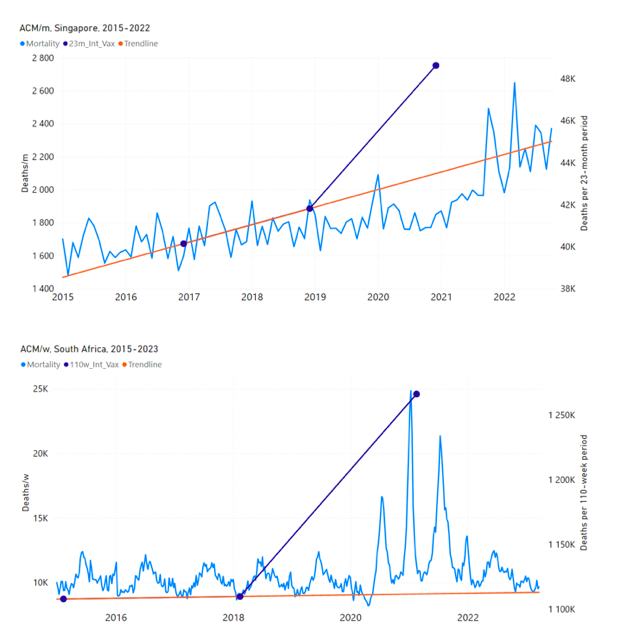
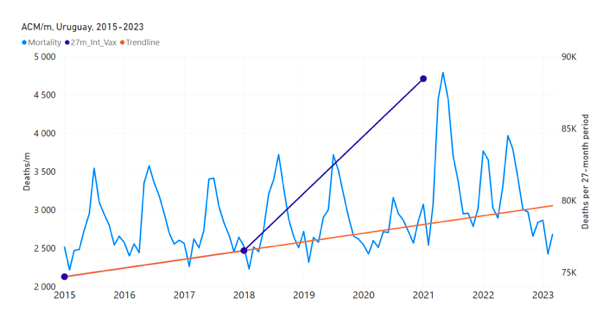
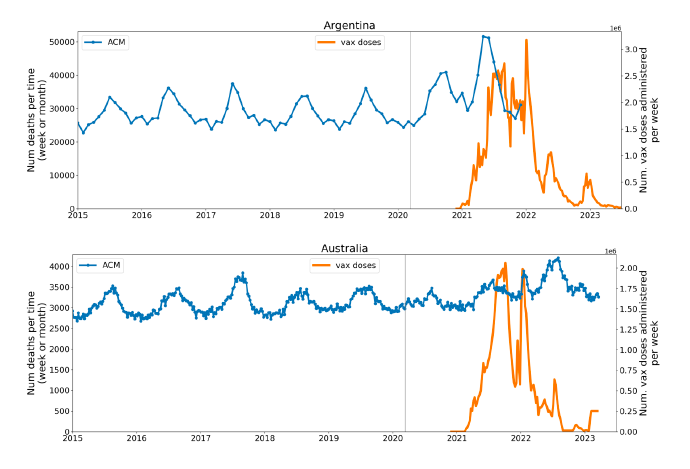
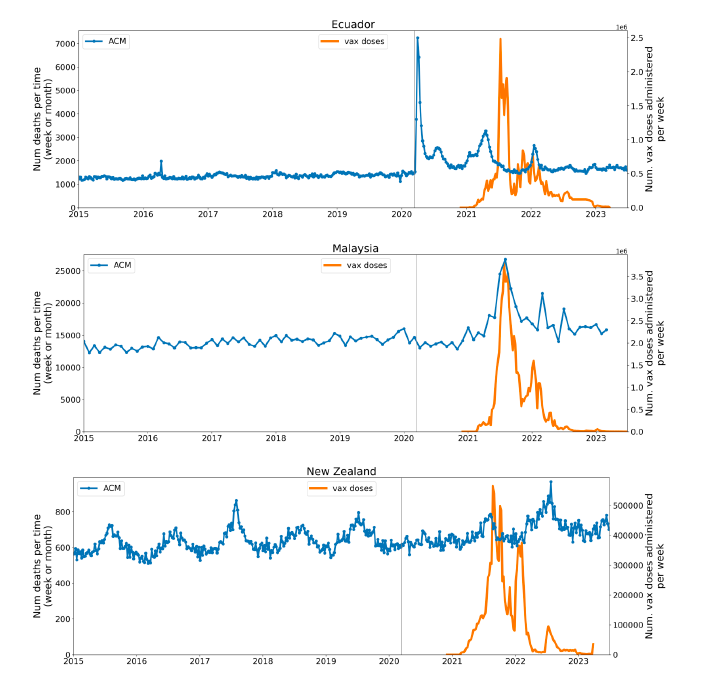
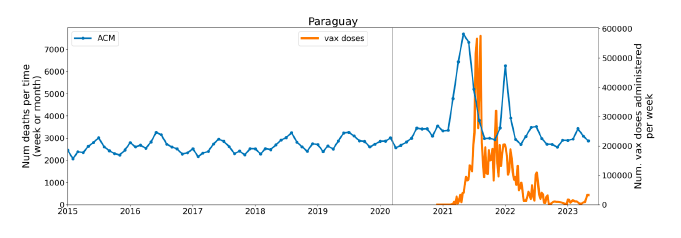
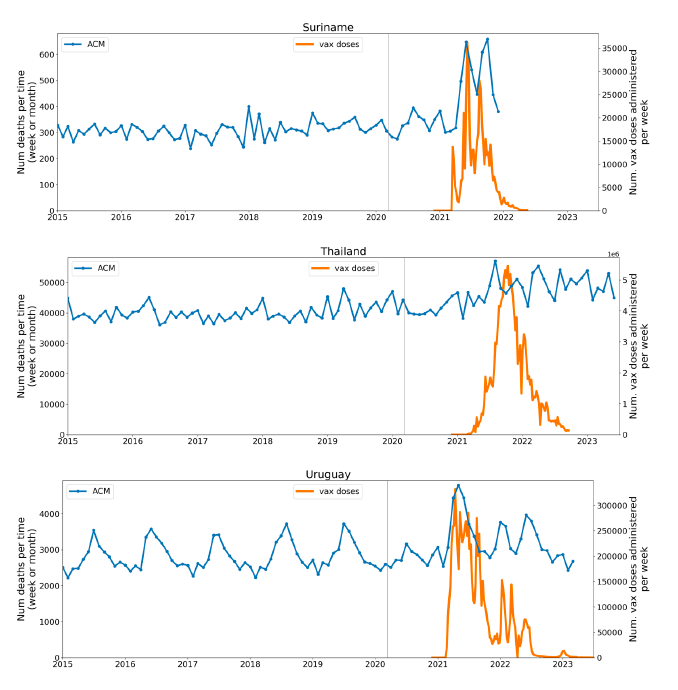
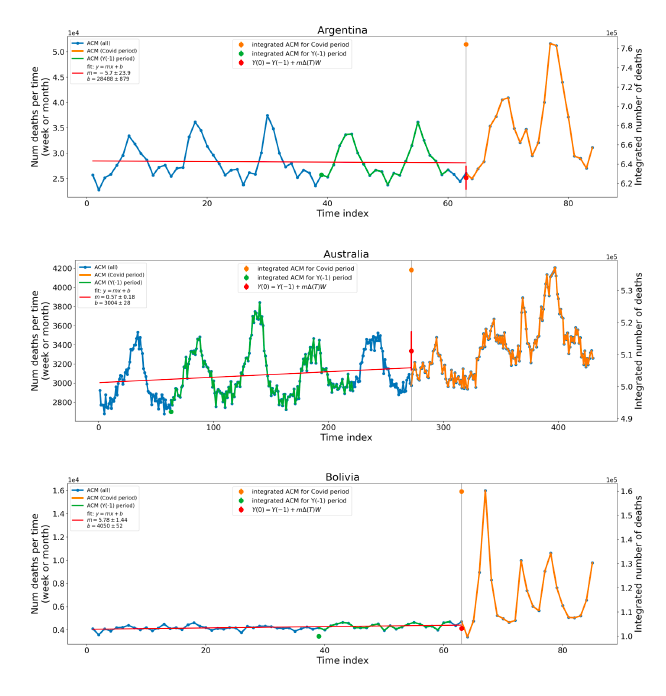
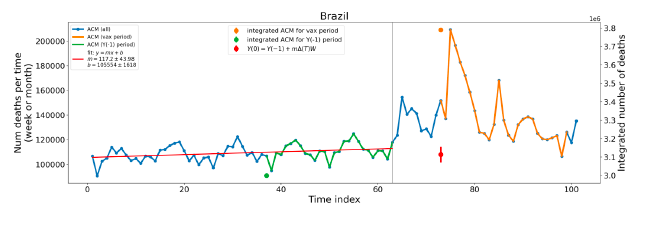
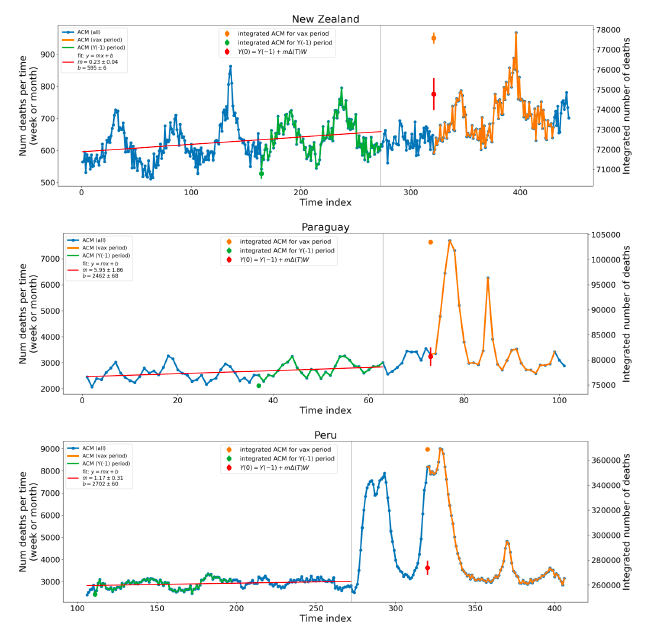
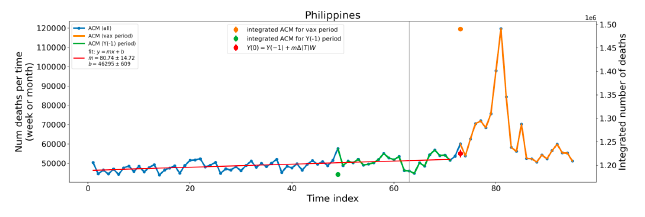
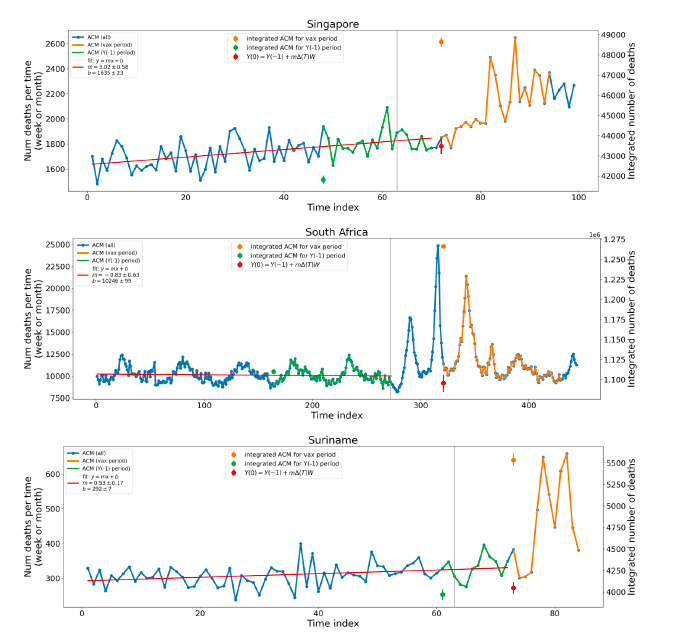
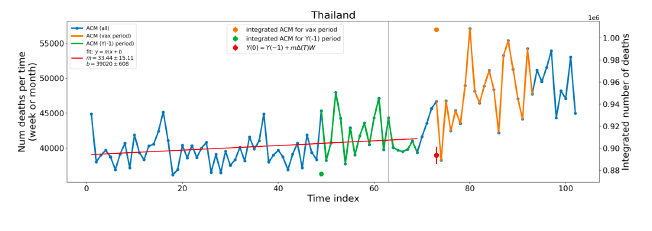
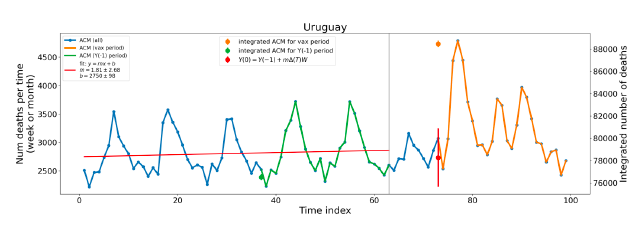
5.1 Transitions to regimes of high ACMFigure 2 shows the ACM by time (week or month) (blue), vaccine administration by time (week) (orange) (source: OWID, 2023a), and the 1-year backward moving average of the ACM by time (week or month, respectively) (red), for the 17 countries in this study. The 11 March 2020 pandemic declaration date is shown by a vertical grey line in each panel. The vaccine administration by week (e.g., orange, Figure 2), for all-ages analyses in the present paper, is obtained from the original cumulative data (OWID, 2023a) by interpolating to obtain all dates, and then summing by week. As a result, where there are sudden jumps in the cumulative data, this can produce a large weekly value as an artifact, such as for the Philippines (Figure 2). Similarly, drops in cumulative values can produce artificial negative weekly values, as seen in a few cases, below.
Figure 2: Transitions between regimes of mortality ― ACM by time (week or month) (blue), vaccine administration by time (week) (orange), and the 1-year backward moving average of the ACM by time (week or month) (red), as per the legend, for the 17 countries in this study. The 11 March 2020 pandemic declaration date is shown by a vertical grey line in each panel. The data sources are specified in Appendix A.
Here (Figure 2), 9 of the 17 countries have no detectable excess mortality in the year or so between when a pandemic is announced on 11 March 2020 and the starting time of the first vaccine rollout in each country. That is, in 9 of the 17 countries, there is no detectable excess mortality until the vaccines are rolled out (Australia, Malaysia, New Zealand, Paraguay, Philippines, Singapore, Suriname, Thailand, Uruguay). In the other 8 of the 17 countries, a new regime of higher mortality is initiated after 11 March 2020 and prior to any COVID-19 vaccine administration (Argentina, Bolivia, Brazil, Chile, Colombia, Ecuador, Peru, South Africa). In all 17 countries, vaccination is associated with a regime of high mortality, and there is no association in time between COVID-19 vaccination and proportionate reduction in ACM.
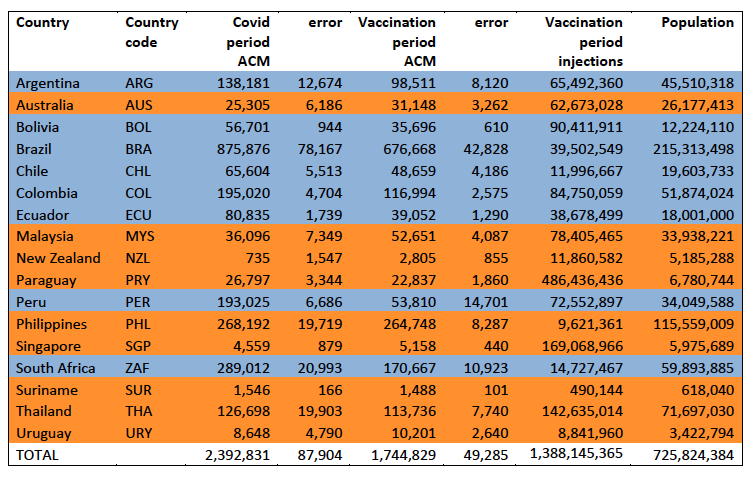
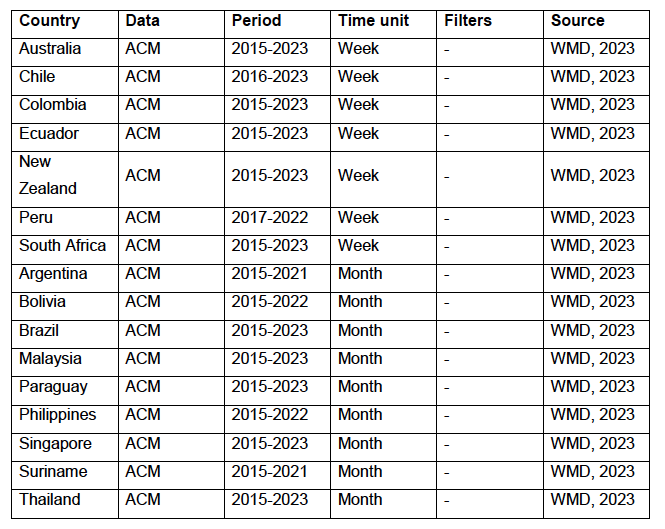
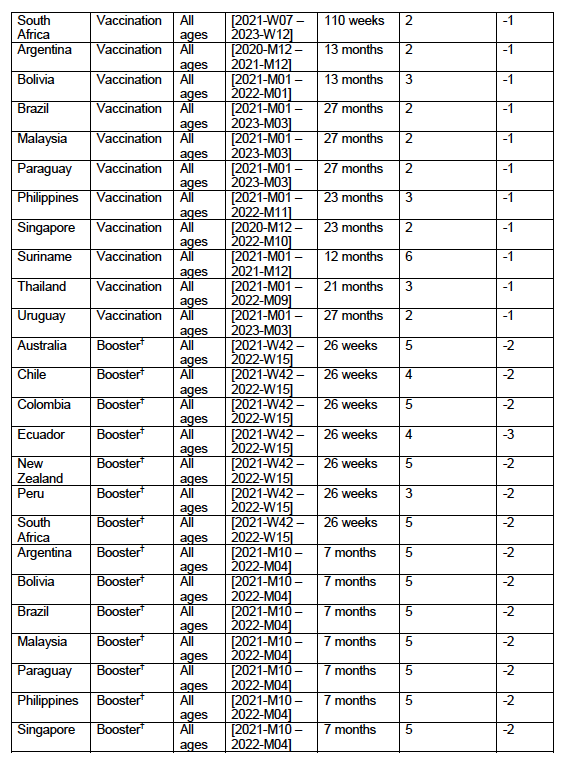
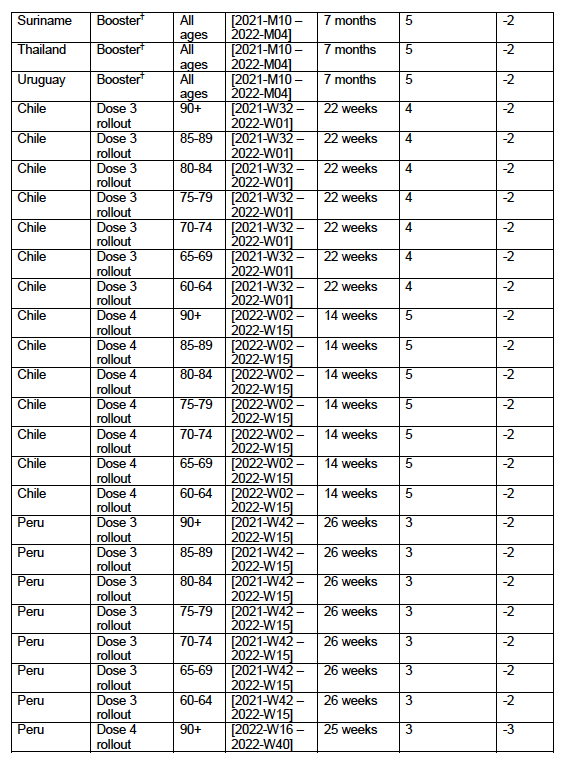
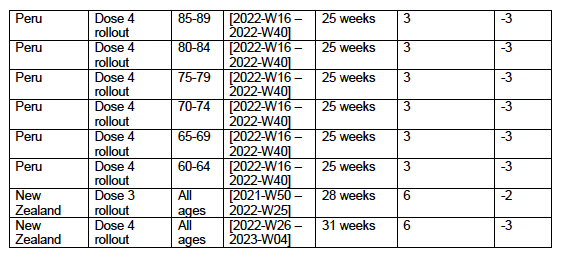
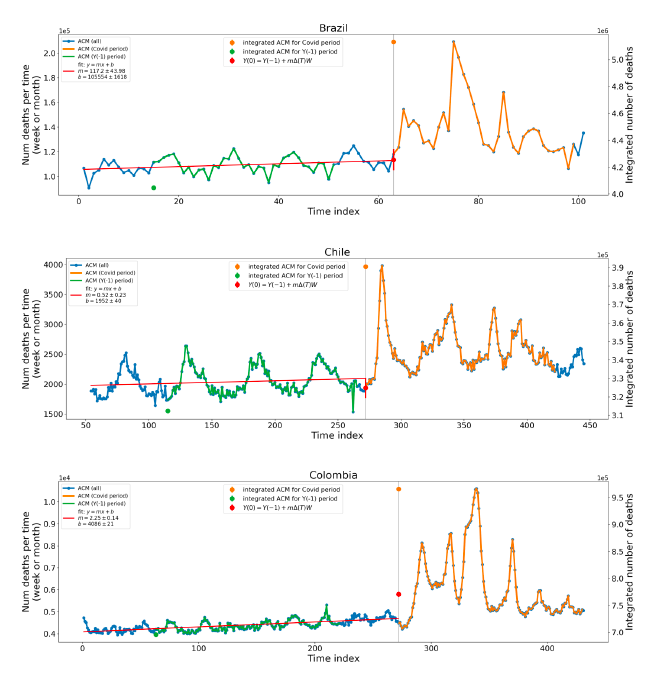
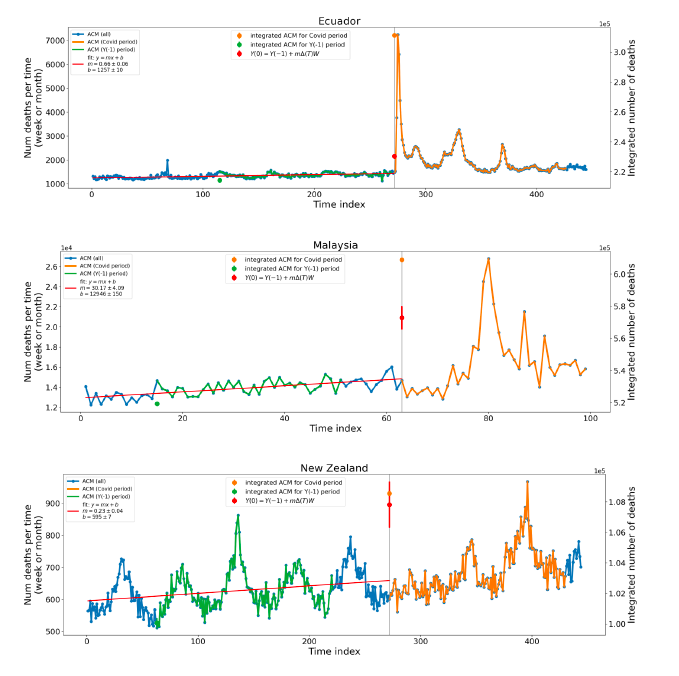
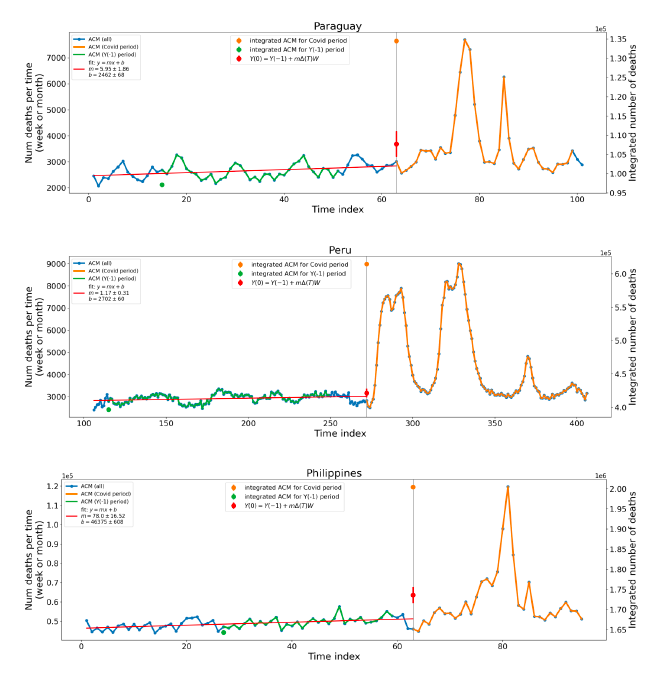
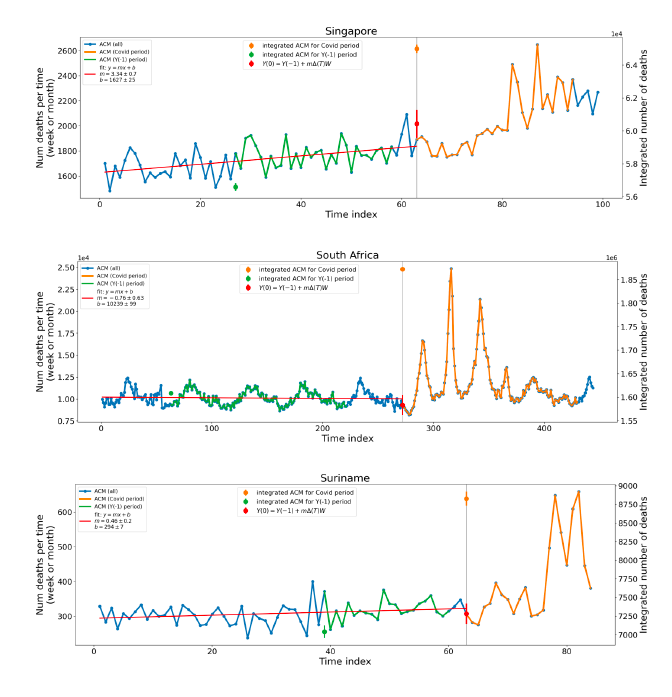
5.2 Covid-period Excess Mortality Compared to COVID-19-vaccination-period Excess Mortality, in the 17 Countries of this StudyWe apply the “Special case of a single historic integrated point” method (Method 2, or “single-point method”, Equations 1 to 3, see Methods) to quantify the excess ACM in the entire Covid period (or “Covid period”), from the week or month of 11 March 2020 to the week or month, respectively, of the last (most recent) usable or chosen point in the ACM by time data. This method takes into account the recent decadal linear change in historic ACM in the needed extrapolation for the reference mortality. The method and calculation of the Covid-period excess ACM are illustrated in Appendix D: Single-point method quantification of the excess mortality in the Covid period, for all 17 countries in this study. We perform the same calculation for the entire COVID-19-vaccination-period (or “vaccination period”) excess ACM, from the first week or month of COVID-19 vaccination to the same week or month, respectively, which was taken to be the last week or month, respectively, of the Covid period for each country, which is illustrated in Appendix E: Single-point method quantification of the excess mortality in the vaccination period. The results of the calculations are given in Table 1, for the excess ACM in the Covid period (column labelled “Covid period ACM”) and for excess ACM in the vaccination period (column labelled “Vaccination period ACM”), and their associated errors (Equation 3, Methods). Total numbers of COVID-19 vaccine injections for the same vaccination periods are also given(column labelled “Vaccination period injections”), as are projected populations for 2022 (United Nations, 2023). Both the Covid and vaccination periods end on the same date for each country. The totals are also given, with propagated errors. The orange shading corresponds to those countries that have no apparent excess ACM prior to the start of vaccination, pursuant to Figure 2, whereas the blue shading is for countries that exhibit excess ACM prior to the start of vaccination (and after a pandemic is declared on 11 March 2020). Table 1: Total excess mortalities in the Covid and vaccination periods,number of injections in thevaccination period, population
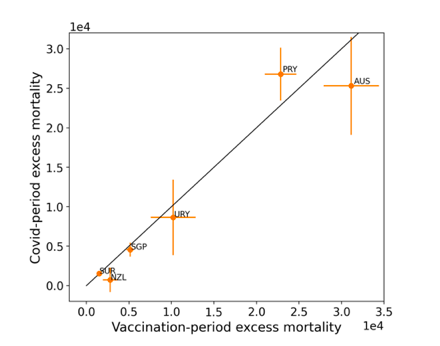
The results of Table 1 are illustrated in Figure 3. Here, the same colour coding of the symbols as for Table 1 is used: orange points for countries that have no apparent excess ACM prior to the start of vaccination, pursuant to Figure 2, and blue points for countries that exhibit excess ACM prior to the start of vaccination (and after a pandemic is declared on 11 March 2020).
Figure 3: (three panels) Covid-period excess ACM versus vaccination-period excess ACM (top), first expanded view (middle), second expanded view (bottom), with 1:1 line as a reference.
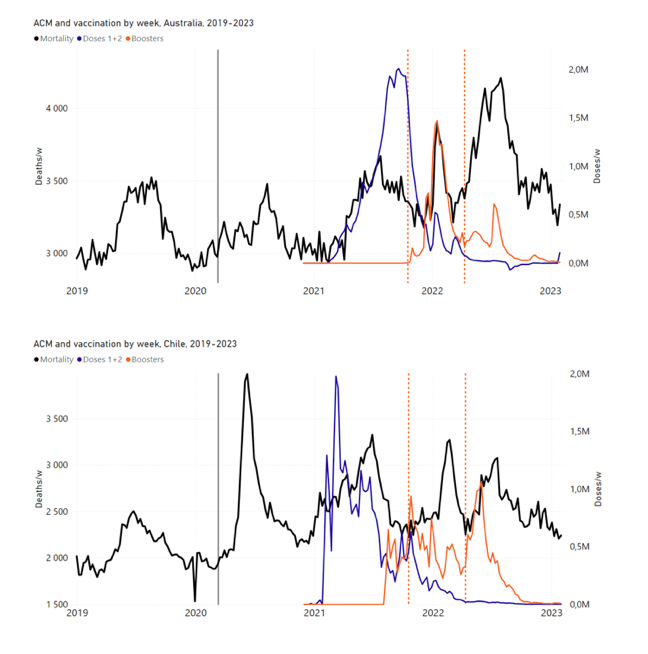
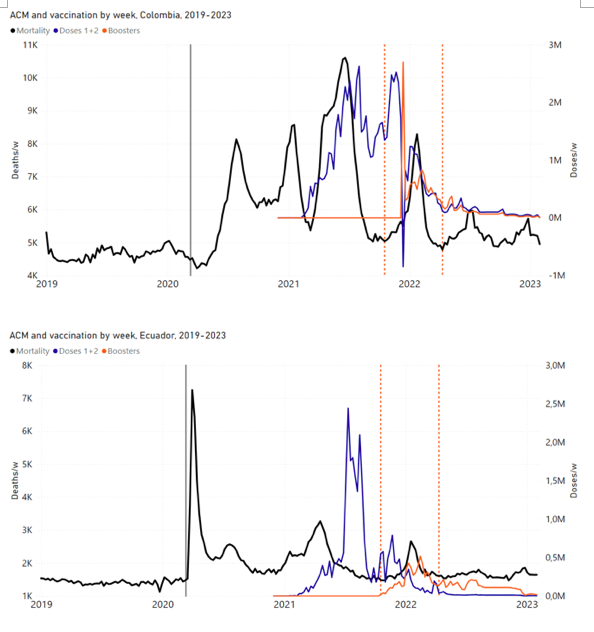
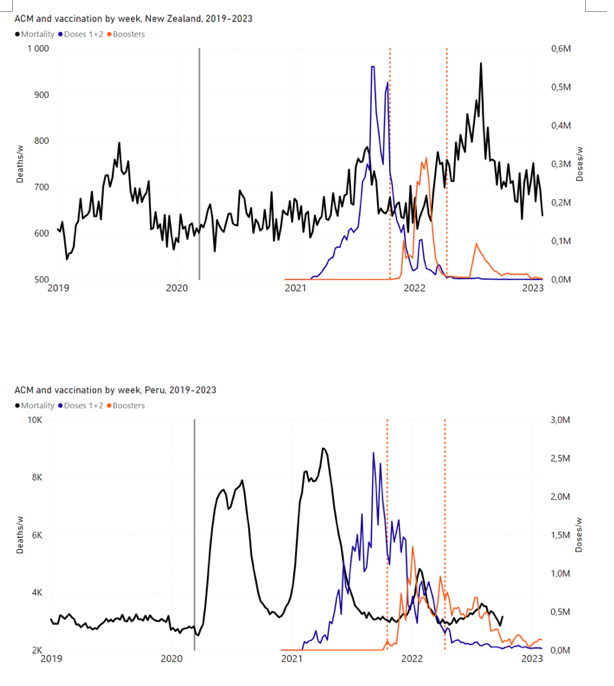
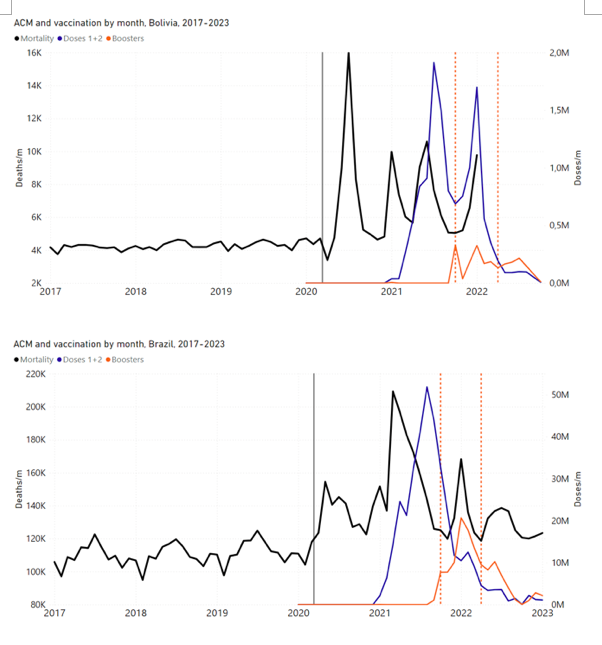
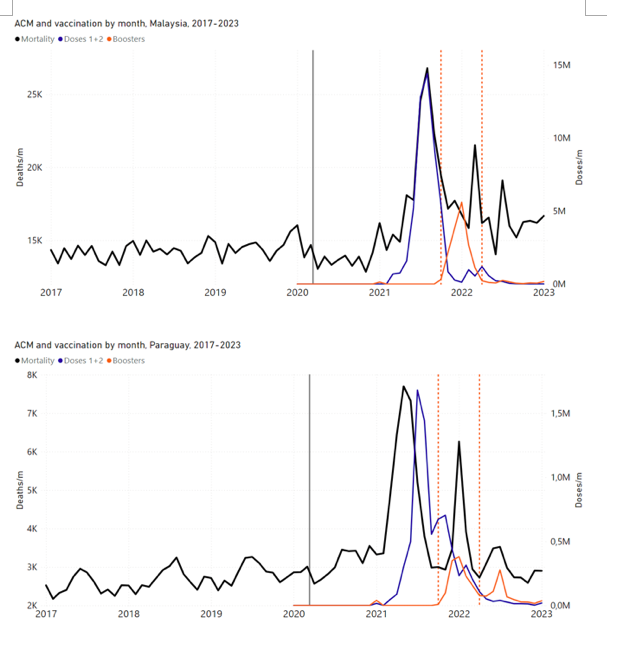
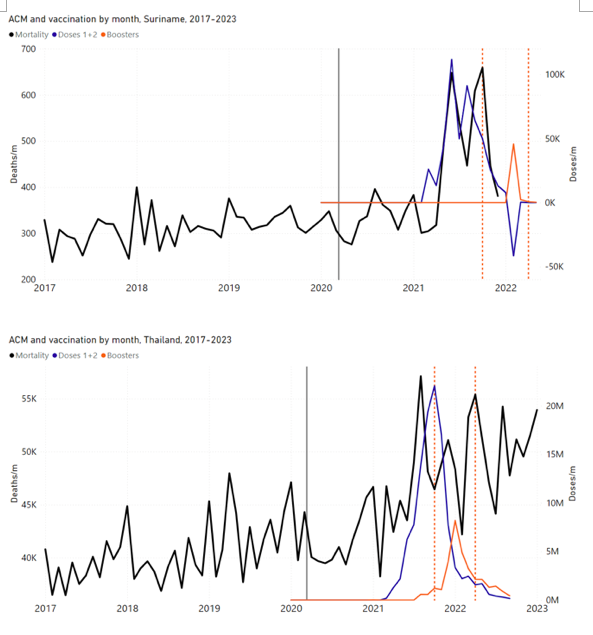
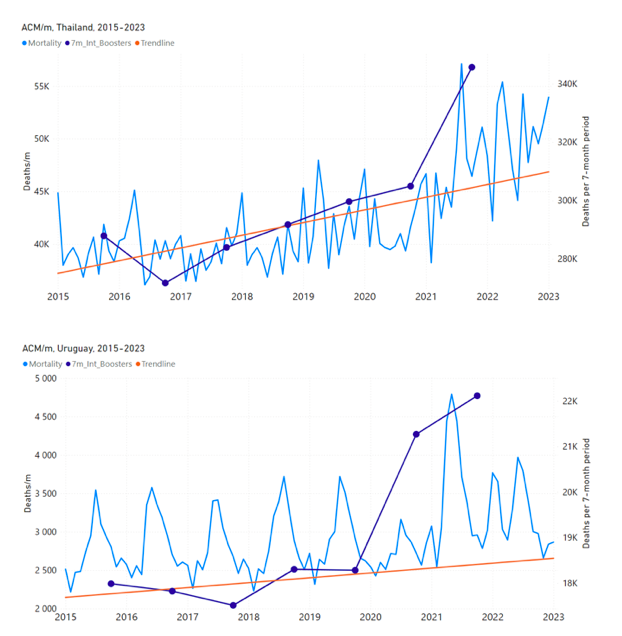
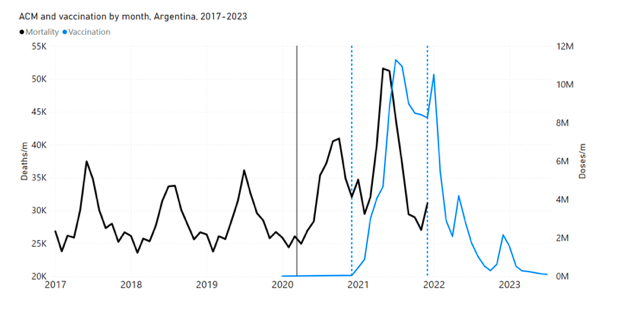
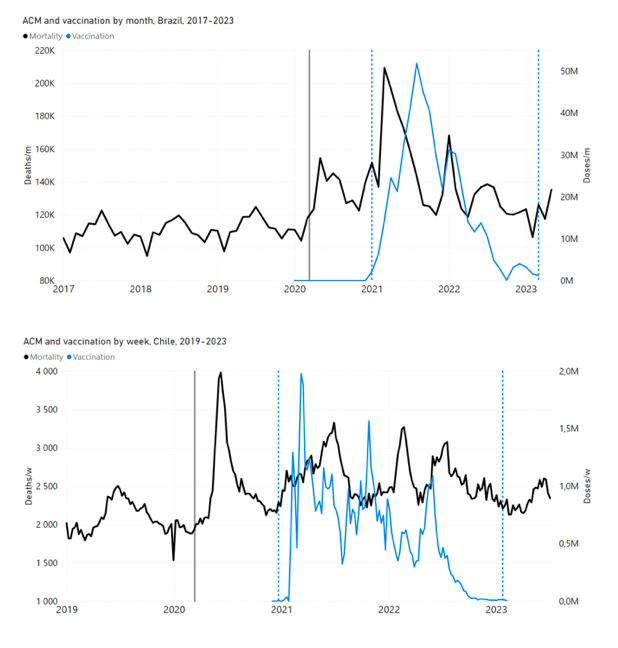
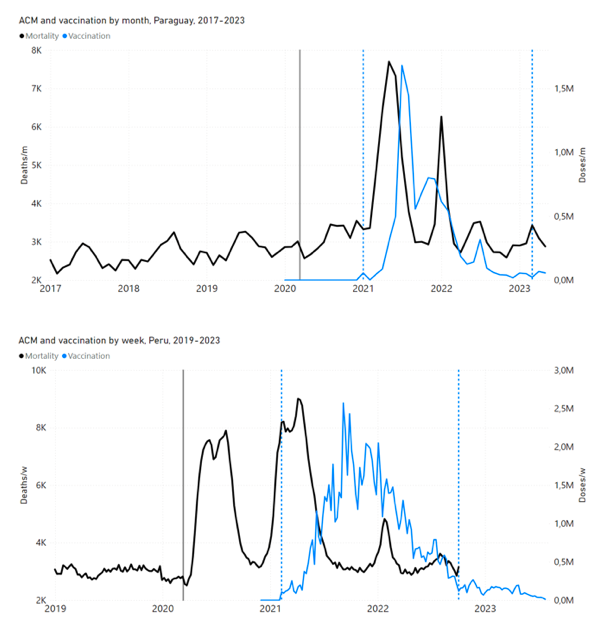
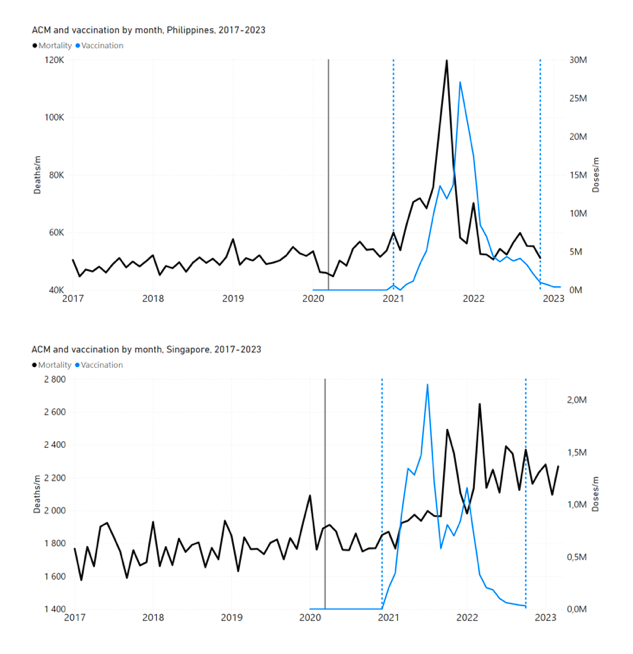
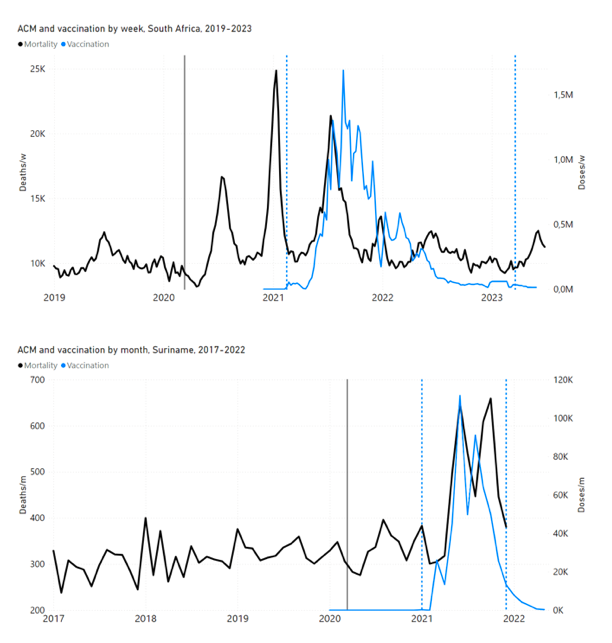
5.3 All Studied Countries All-ages National ACM and Vaccine RolloutsFigure 4 shows the available all-ages national ACM (black) by month (2017-2023) or by week (2019-2023), compared to the COVID-19 vaccine-dose rollouts, for: Australia, Chile, Colombia, Ecuador, New Zealand, Peru, South Africa (by-week ACM data); and Argentina, Bolivia, Brazil, Malaysia, Paraguay, Philippines, Singapore, Suriname, Thailand, and Uruguay (by-month ACM data). Grey vertical lines indicate the 11 March 2020 World Health Organization (WHO) announcement of a pandemic, and orange dashed vertical lines show the bounds of the integration window for the January-February 2022 peak of interest (same bounds as for Figure 5, and Table 2). Vaccine administration for dose 1 and dose 2 by week or by month is in blue; whereas booster administration (doses beyond dose 2) by week or by month is in orange. The vaccine data is from Our World in Data (2023a), where the dose1 and dose 2 data (blue) was obtained by subtracting the booster doses (orange) from the all-doses data.
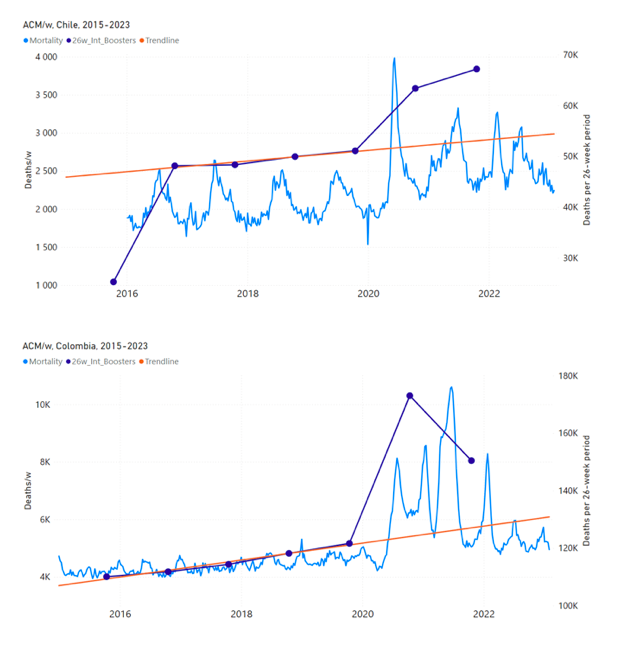
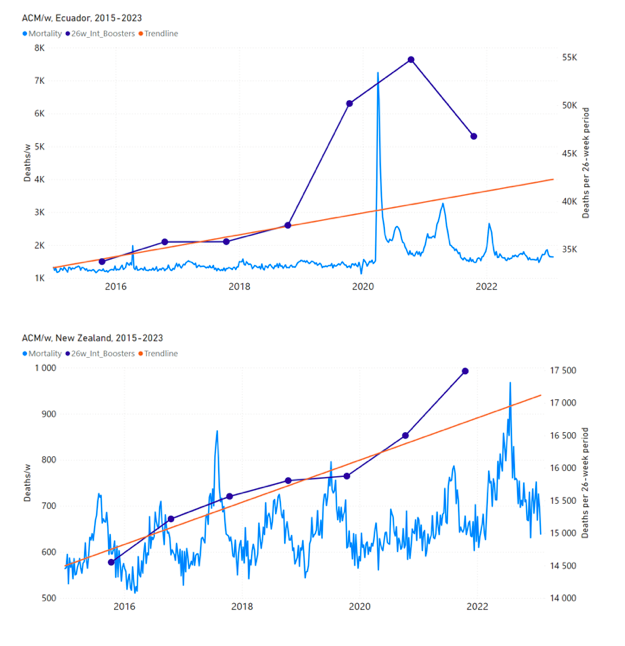
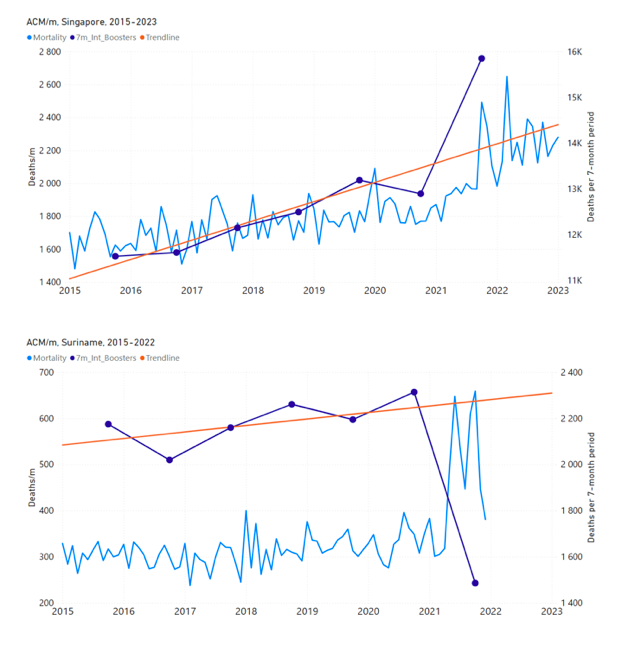
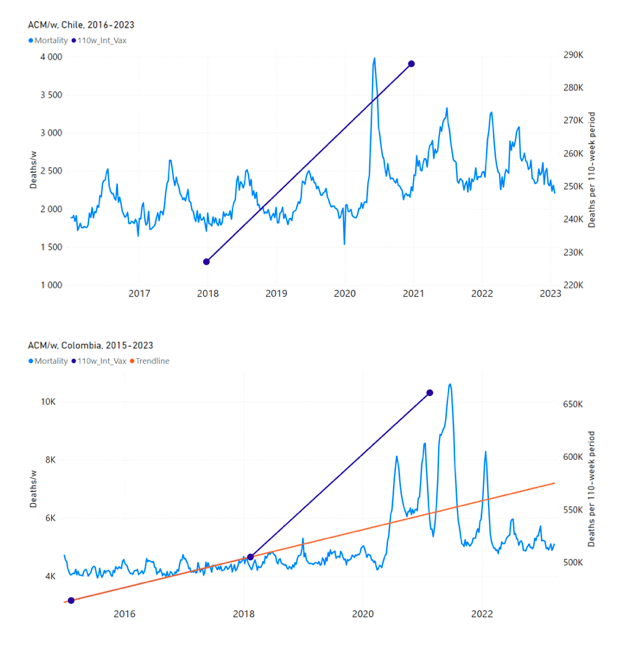
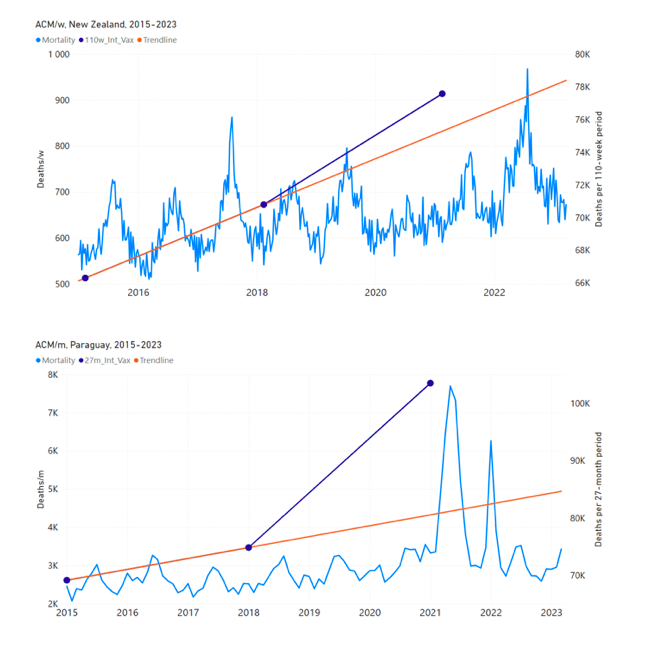
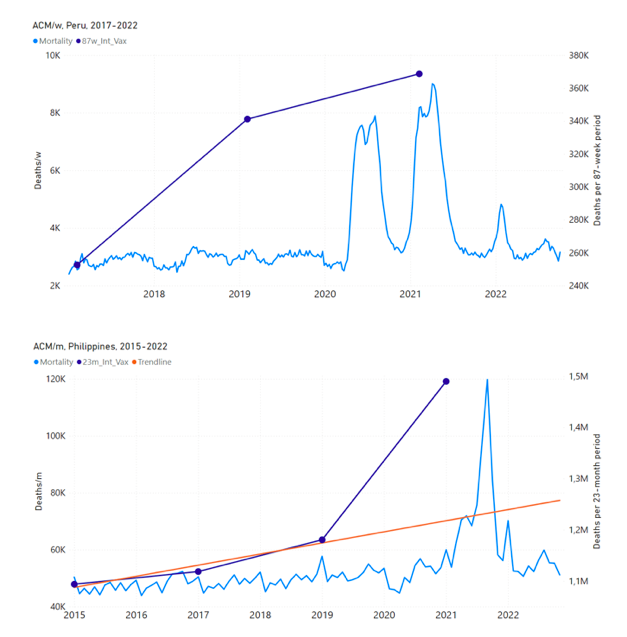
Figure 4: All-ages ACM by week (2019-2023) or by month (2017-2023) (black), with all-ages vaccine rollouts doses 1 and 2 (blue) and boosters (orange), for the 17 countries in this study (as labelled); also showing the 11 March 2020 date and limits of integration for the nominally January-February 2022 peak in ACM (vertical lines). The data sources are specified in Appendix A. Figure 5 shows the available all-ages national ACM by time (week or month), from 2015 to 2023, the integration points that were used to quantify excess ACM in the January-February 2022 peak of interest, and the linear trend lines that were used to extrapolate to the expected values (“Historical-trend baseline for a period (or peak) of mortality” method, Method 1, see Methods), for: Australia, Chile, Colombia, Ecuador, New Zealand, Peru, South Africa (by-week ACM data); and for Argentina, Bolivia, Brazil, Malaysia, Paraguay, Philippines, Singapore, Suriname, Thailand, and Uruguay (by-month ACM data). The figure has: ACM by week or by month (light blue); integrated ACM by 26‑week or 7-month vaccination-period integration window (dark blue, points), the last point being for the actual period of interest itself; extrapolation line used to calculate the excess ACM in the booster period (orange). An integration point is positioned in time at the start of the integration window. See Methods. For completeness, in Figure 5 and Figure 4, we include those countries for which the calculation cannot be completed because of insufficient ACM data in the January-February 2022 region of interest. Argentina, Bolivia and Suriname have incomplete ACM data in the integration region of interest, causing a low integration value as an artifact (Figure 5). For simplicity and comparison, in Figure 5 and Figure 4 (and in Table 2), we standardized to essentially the same integration window for all countries (see Appendix C): 26-week window with by-week ACM data (2021-week-42 through 2022-week-15, which is 182 days) or 7-month window with by-month ACM data (2021-month-10 through 2022-month-04, which is 212 days).
Figure 5: All-ages ACM by week or by month (light blue), 2015-2023, with integrations for the nominally January-February 2022 peak in ACM (dark blue), for the 17 countries (as labelled). The data sources are specified in Appendix A. Figure 6 shows the same kind of graph as depicted in Figure 4, except that the entire available COVID-19 vaccine period is highlighted, instead of just the booster-rollout region related to the nominally January-February 2022 peak in ACM, for all 17 countries in this study (Argentina, Australia, Bolivia, Brazil, Chile, Colombia, Ecuador, Malaysia, New Zealand, Paraguay, Peru, Philippines, Singapore, South Africa, Suriname, Thailand, Uruguay). Here (Figure 6 and Figure 7), the vaccination period is defined to start at the first week or month of COVID-19 vaccine administration, and to end at effectively the latest time of vaccine administration or at the latest date of available ACM data. See Appendix C: Technical and specific information for applications of the methods to the data for the specified ranges used. The idea is to capture the all-ages all-doses long-time impact of vaccination in each country, with a corresponding calculated value of vDFR, and to compare it with the value obtained from the targeted focus on the booster-associated nominally January-February 2022 peak in ACM.
Figure 6: All-ages ACM by week (2019-2023) or by month (2017-2023) (black), with all-ages all-doses COVID-19 vaccine rollout (blue), for the 17 countries in this study; also showing the 11 March 2020 date (grey) and limits of integration (dashed, blue) for the vaccination period. The data sources are specified in Appendix A. Figure 7 shows the integrations corresponding to the vaccination periods illustrated in Figure 6.
Figure 7: All-ages ACM by week (ACM/w) or by month (ACM/m) (light blue), 2015-2023, with integrations (dark blue), and trend lines (orange), for the for the vaccination period, for the 17 countries in this study (as labelled). The data sources are specified in Appendix A. We also applied our alternative method (Method 2: Equations 1 to 3; “Special case of a single historic integrated point” method) to obtain the excess mortality in the vaccination periods of all 17 countries, using all the same integration limits as used in applying the first method (Method 1), above. These calculations are illustrated in Appendix E: Single-point method quantification of the excess mortality in the vaccination period. Table 2 compares calculated all-ages values of vDFR, for the 17 countries in the study, for two different time periods of interest, and using two different quantification methods:
Table 2: All-ages national vaccine dose fatality rates (vDFR) extracted from the time period of the nominal January-February 2022 ACM peak (“S22-peak”) and from the entire time period of vaccination (“v-period”), for the 17 countries in this study.
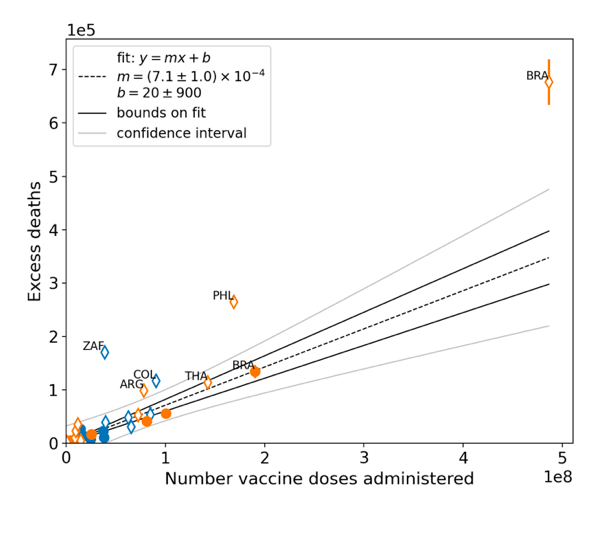
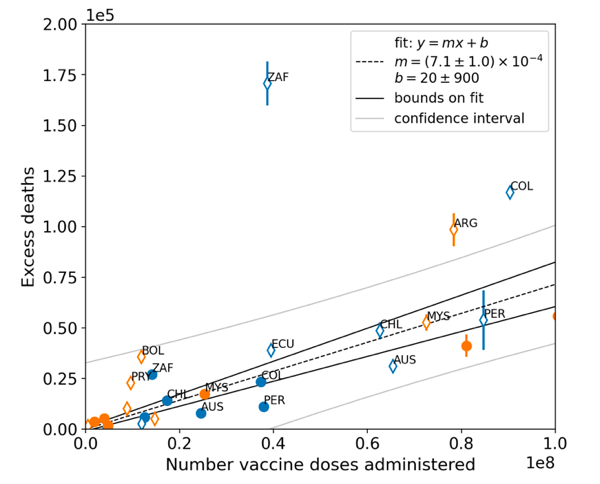
Figure 8 shows all-ages national excess ACM in the time period of the nominal January-February 2022 ACM peaks (filled circles) or in the time periods of vaccination (open diamonds), as obtained from the analyses illustrated in Figure 5 or Figure 23, respectively, versus the all-ages all-doses national total vaccine injections in each of the same time periods as the time windows of ACM integration, as obtained from the analyses illustrated in Figure 4 or Figure 6, respectively, for the 17 countries of the study, subject to data availability. The full range is shown in the top panel, and an expanded view near the origin is shown in the bottom panel. The results from by-week ACM data (blue symbols) and by‑month ACM data (orange symbols) are comparable, even though they use different integration-window widths, because they are excess mortalities in anomalous peaks rather than total mortalities. The overall (all points in Figure 8) Pearson correlation coefficient is r = +0.94. As per its legend, Figure 8 also shows:
The best-line fit parameters are as specified in the figure: Y-intercept = +20 ± 900 deaths, slope = (7.1 ± 1.0) x 10−4 deaths per injection (r = +0.94). For comparison, if only the data for the time period of the nominal January-February 2022 ACM peak is used (filled circles in Figure 8), one obtains: Y-intercept = −500 ± 1,000 deaths, slope = (6.4 ± 0.9) x 10−4 deaths per injection (r = +0.97).
Figure 8: All-ages national excess ACM in the time period of the nominal January-February 2022 ACM peaks (filled circles) or during the vaccination period (open diamonds, Method 2 calculation method) versus the all-ages national total vaccine injections in the same time period, using both by-week (blue) and by-month (orange) ACM data, for all 17 countries (as labelled). Full range (top panel). Expanded view (bottom panel). Pearson correlation coefficient is r = +0.94. In Figure 8, the points for the vaccination period (open diamonds) have generally larger Y-values than the points for the time period of the nominal January-February 2022 ACM peak (filled circles), relative to the overall trend line. This would correspond to generally larger values of country-specific all-ages vDFR, since vDFR = Y‑value/X‑value for each point. This systematic difference is analyzed in Figure 9.
Figure 9: vDFR (vaccination period) versus vDFR (January-February 2022 ACM peak period), with correlation analysis. The vDFR values are expressed as fractions, not %, and the scale is x1e−3, so “4” is 0.4 %, and so on. The analysis lines have the same meanings as in Figure 8. Pearson correlation coefficient is r = +0.74. As per its legend, in Figure 9 the slope is 1.8 ± 0.6 and the intercept is zero, within error (−3 ± 30). The Pearson correlation coefficient is +0.74. South Africa has the largest value of all-ages vDFR (0.44 %), of the 17 study countries, followed by Suriname (0.30 %), Bolivia (0.301 %), Paraguay (0.24 %), and Philippines (0.157 %). This is illustrated in Figure 10, for all the countries and both integration-time periods, compared to the lists of vaccine manufacturers by country (OWID, 2023b).
Figure 10: All-ages vDFR values for the vaccination period (orange, meth. 2) and for the period of the January-February 2022 peak in ACM (blue), by country, in decreasing order, compared to the lists of vaccine manufacturers. Values of all-ages vDFR are from Table 2.
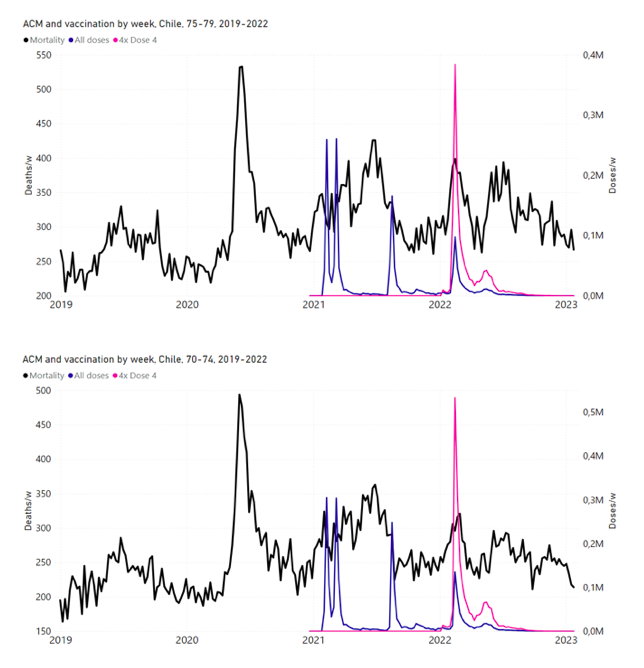
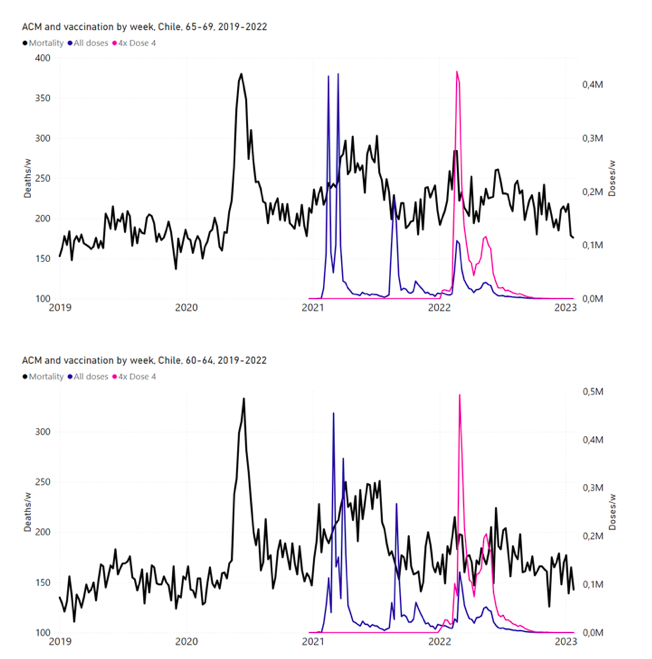
5.4 Chile by Age Group Dose 4 ― National ACM and Vaccine Dose 4 Rollouts (90+, 85-89, 80‑84, 75-79, 70-74, 65-69, and 60-64 Years)Figure 11 shows the national ACM by week for Chile (black), from 2019 to 2023, and all‑doses (blue) and dose-4 (x4 amplification) (pink) COVID-19 vaccine rollouts, for all ages and for each of the age groups analyzed (90+ years through 60-64 years), as labelled. For many of the age groups, the four different doses are visually resolved as distinct peaks in the all-doses data, which is confirmed by the dose-specific data (not shown).
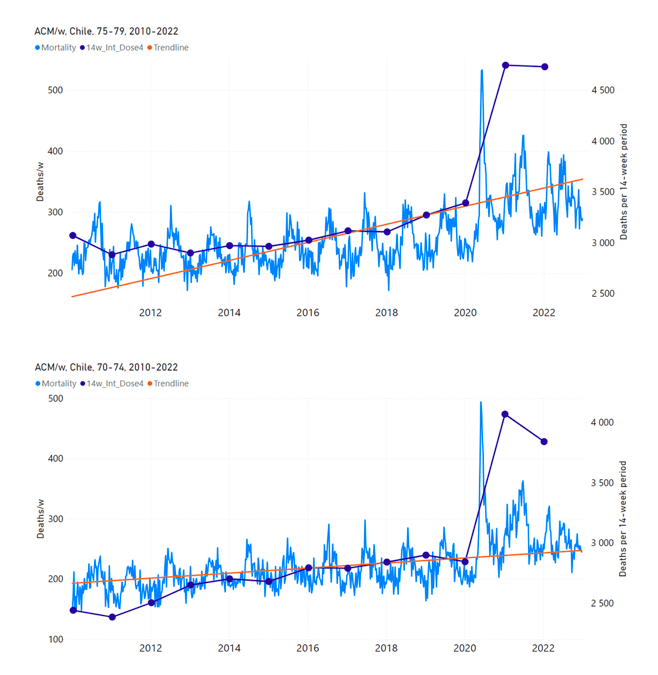
Figure 11: Chile (with rollouts), ACM by week (black), 2019-2023, by age group (90+, 85-89 … 60-64 years), with vaccine rollouts all-doses (blue) and dose-4 (x4 amplified, pink). The data sources are specified in Appendix A. Figure 12 shows the national ACM by week for Chile (light blue), from 2010 to 2023, and the 14-week integration points (dark blue) and trend line (orange) that were used to quantify excess ACM in the January-February 2022 peak of interest (“Historical-trend baseline for a period (or peak) of mortality” method, Method 1, see Methods), corresponding to the vaccine dose 4 rollout, for each of the age groups (90+ years through 60-64 years, as indicated). Here the integration windows (14 weeks) are selected for the age-group data, and are therefore different than the integration window used for all-ages (Figure 5 and Figure 4) (see Appendix C). The last integration point (in 2022) is for the vaccine dose 4 period itself, and each integration point is positioned in time at the start of the integration window. See Methods for details.
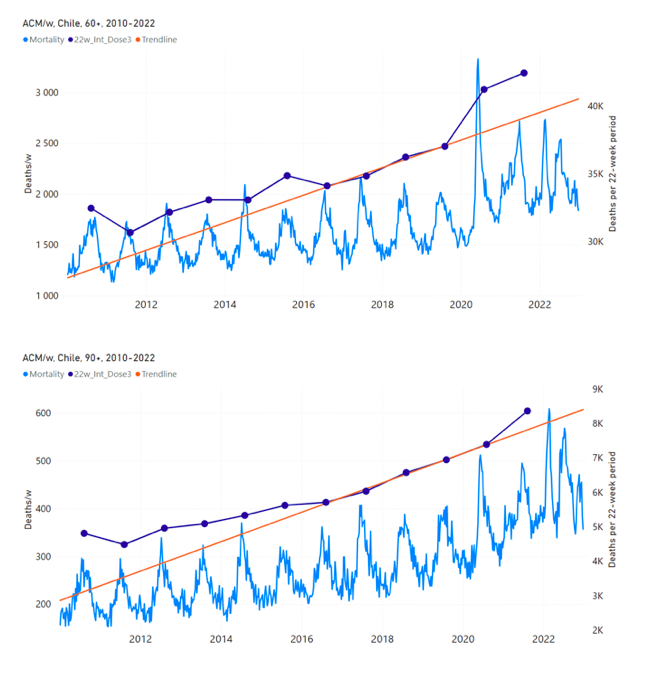
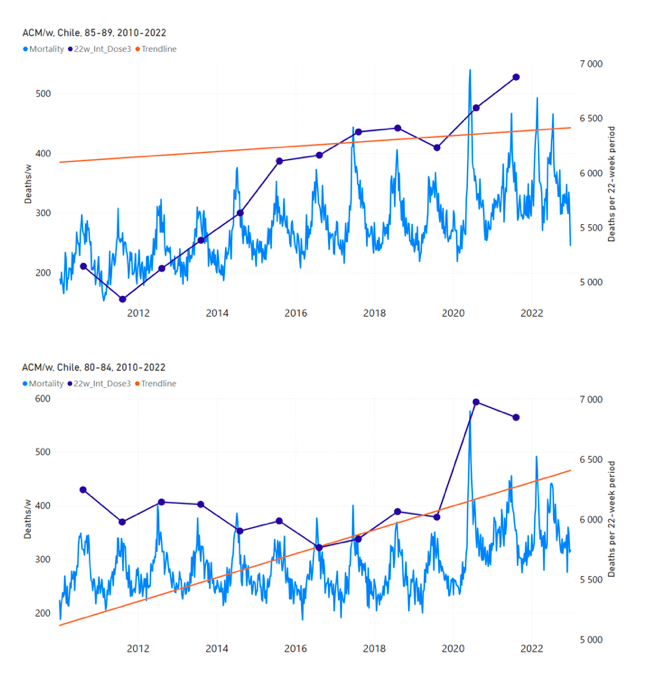
Figure 12: Chile (dose 4), ACM by week (light blue), 2010-2022, by age group (90+, 85-89 … 60-64 years), with integrations, 14-week dose-4-vaccination-period (dark blue, points) and trend line (orange). The data sources are specified in Appendix A. 5.5 Chile by Age Group Dose 3 ― National ACM and Vaccine Dose 3 Rollouts (90+, 85‑89, 80-84, 75-79, 70-74, 65-69, and 60-64 Years)Since the dose-3 rollout is well defined and distinct from the other rollouts, in specific age groups in Chile (Figure 11), and since there is excess mortality over the time period of the dose-3 rollout, we additionally quantified for dose 3 in Chile, even though there is conflation with a seasonal peak in ACM and no sharp and distinct isolated associated peak in ACM, although 90+ years does show a well-formed shoulder (Figure 11) (see Methods, and see below). Figure 13 shows the national ACM by week for Chile (light blue), from 2010 to 2023, and the 22-week-integration points (dark blue) and trend line (orange) that were used to quantify excess ACM in the nominal July-August 2021 region of interest (“Historical-trend baseline for a period (or peak) of mortality” method, Method 1, see Methods), corresponding to the vaccine dose 3 rollout, for each of the age groups (60+ years, and 90+ years through 60-64 years, as indicated). Here, as in Figure 12 and Figure 11, the integration windows (22 weeks) are selected for the age-group data (Appendix C). The last integration point (in 2021) is for the vaccine dose 3 period itself, and each integration point is positioned in time at the start of the integration window. See Methods for details.
Figure 13: Chile (dose 3), ACM by week (light blue), 2010-2022, by age group (60+, 90+, 85-89 … 60-64 years), with integrations, 22-week dose-3-vaccination-period (dark blue, points) and trend line (orange). The data sources are specified in Appendix A.
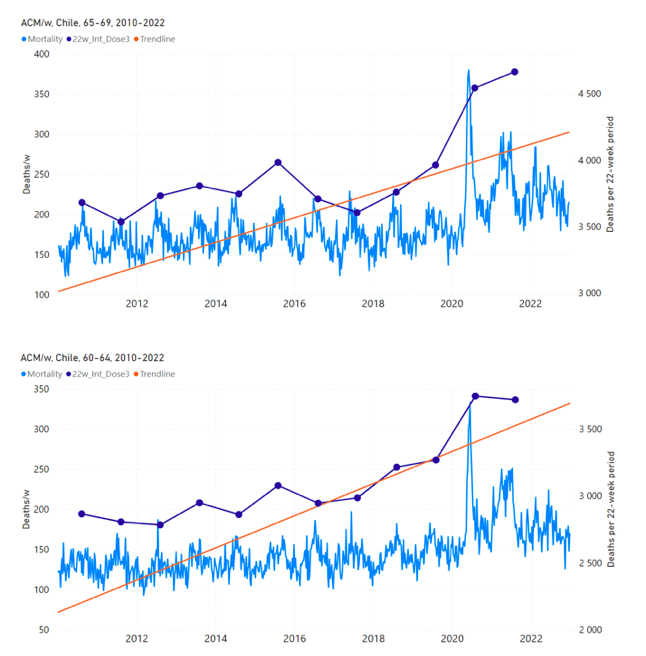
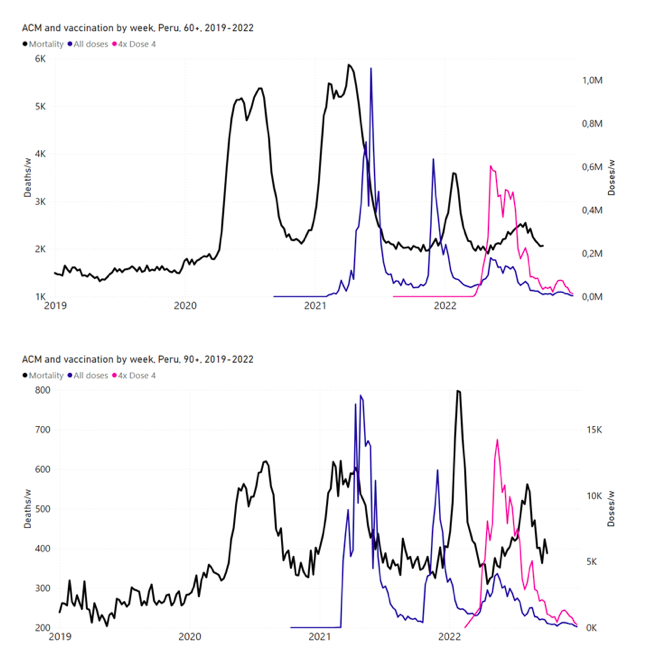
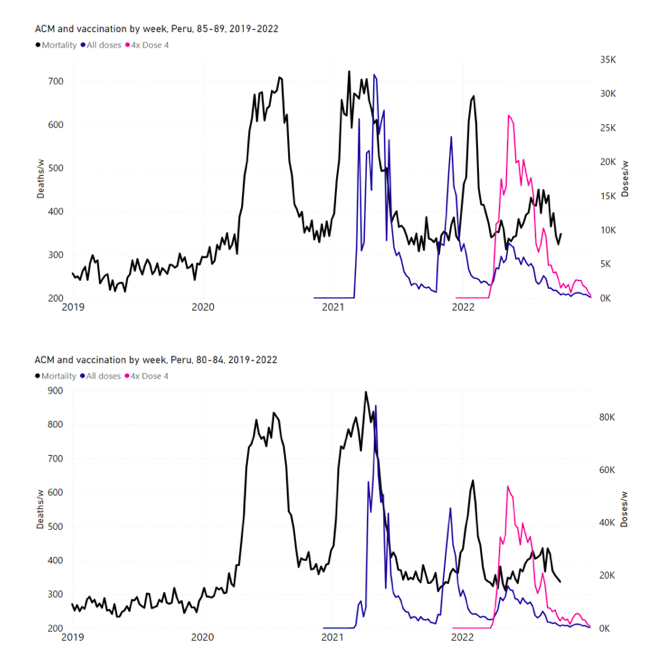
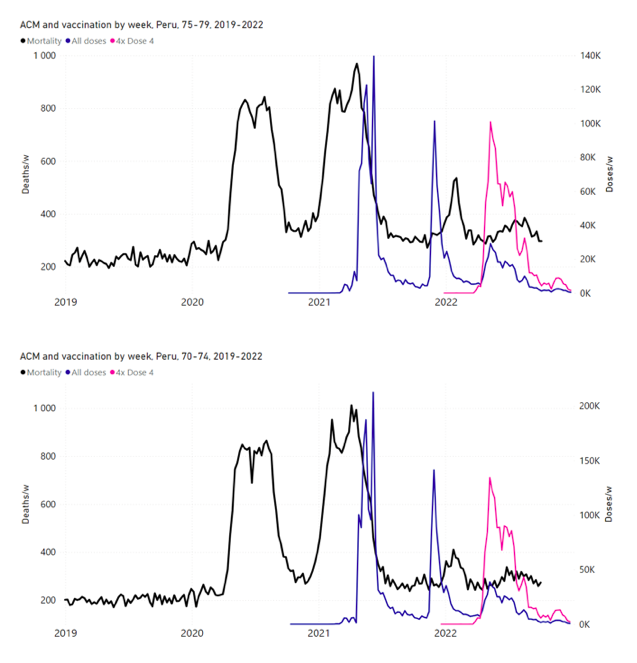
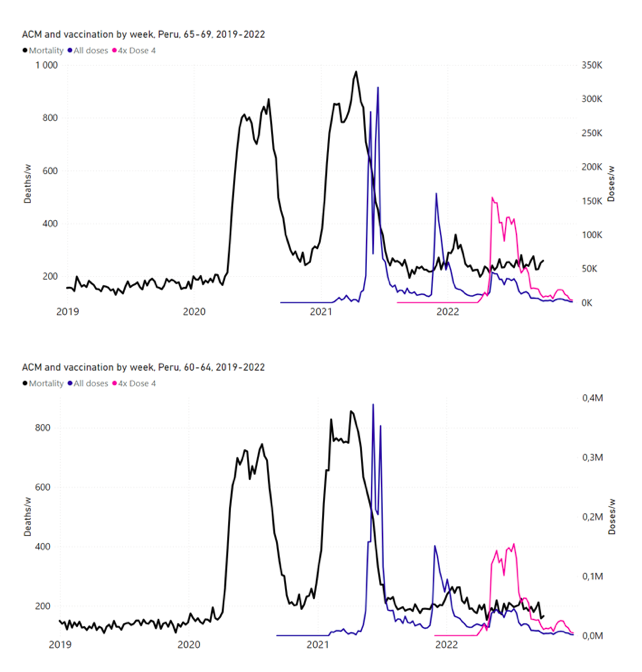
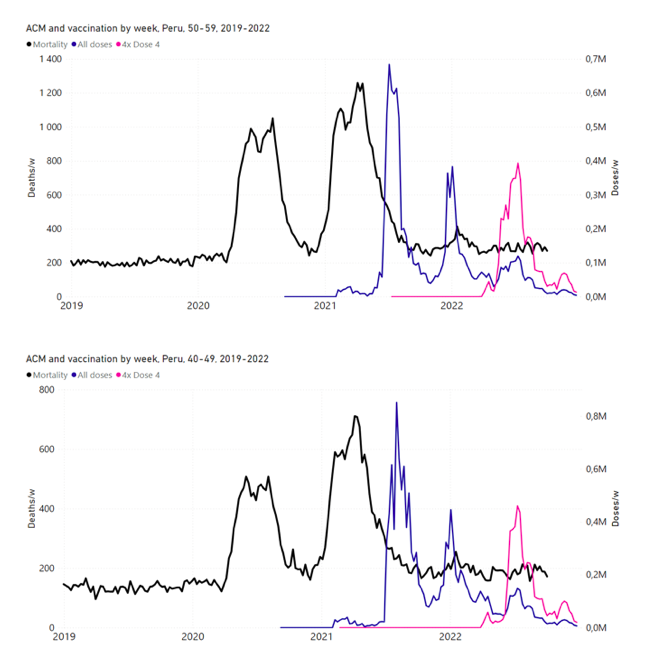
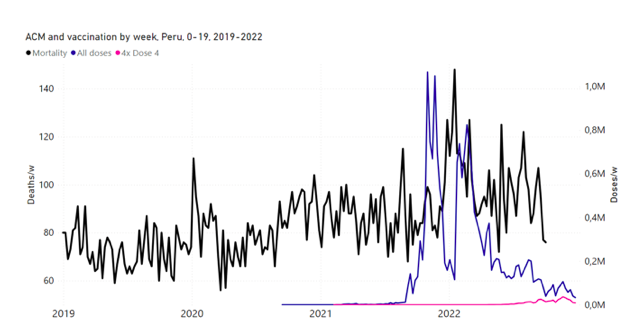
5.6 Peru by Age Group Dose 3 ― National ACM and Vaccine Dose 3 Rollouts (90+, 85‑89, 80-84, 75-79, 70-74, 65-69, and 60-64 Years)Figure 14 shows the national ACM by week for Peru (black), from 2019 to 2022, and dose-specific (all doses, blue; and dose 4, pink) COVID-19 vaccine rollouts, for all-ages and for each of the age groups examined (60+, 90+, 85-89, 80-84, 75-79, 70-74, 65-69, 60-64, 50-59, 40-49, 30-39, 20-29, and 0-19 years), as labelled. All-doses vaccine administration by week is in blue, dose-4 vaccine administration by week (x4 amplification) is in pink. For many of the age groups, the four different doses are visually resolved as distinct peaks in the all-doses data, which is confirmed by the dose-specific data (not shown).
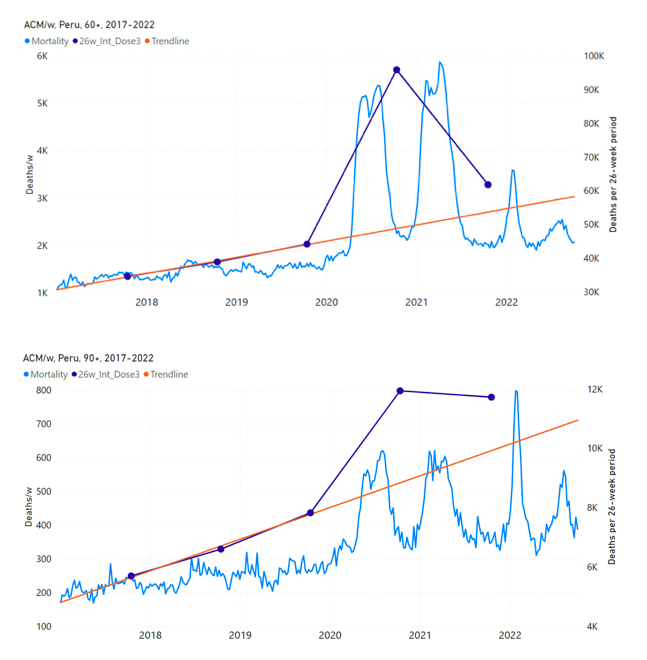
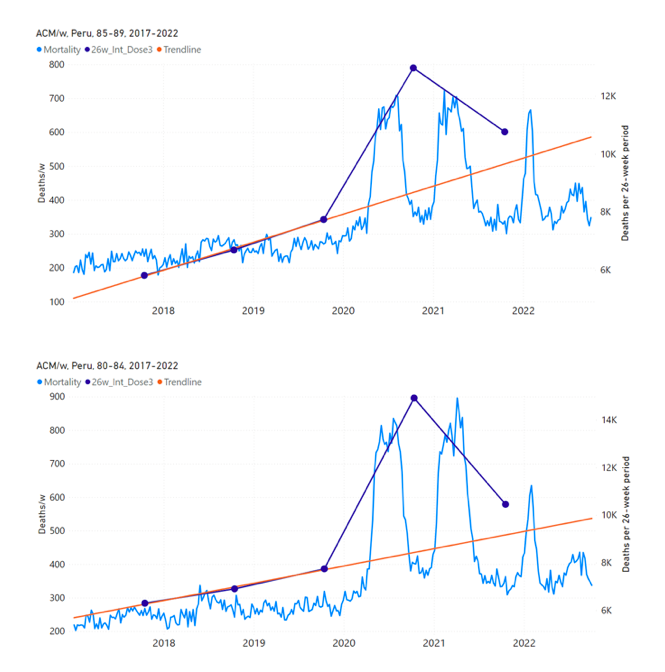
Figure 14: Peru (with rollouts), ACM by week (black), 2019-2022, by age group (60+, 90+, 85-89 … 60-64, 50-59 … 20-29, 0-19 years), with vaccine rollouts all-doses (blue) and dose-4 (x4 amplified, pink). The data sources are specified in Appendix A. Figure 15 shows the national ACM by week for Peru (light blue), from 2017 to 2022, and the 26-week integration points (dark blue) and trend line (orange) that were used to quantify excess ACM in the January-February 2022 peak of interest (“Historical-trend baseline for a period (or peak) of mortality” method, Method 1, see Methods), associated with Peru’s dose-3 rollout, for the 60+ year age group, and for each of the more specific age groups analyzed (90+, 85-89, 80-84, 75-79, 70-74, 65-69, and 60-64 years). The last point (positioned in late 2021) is for the dose-3 vaccination period itself, and each integration point is positioned in time at the start of the integration window. See Methods for details.
Figure 15: Peru (dose 3), ACM by week (light blue), 2017-2022, by age group (60+, 90+, 85-89 … 60-64 years), with integrations, 26-week dose-3-vaccination-period (dark blue, points) and trend line (orange). The data sources are specified in Appendix A.
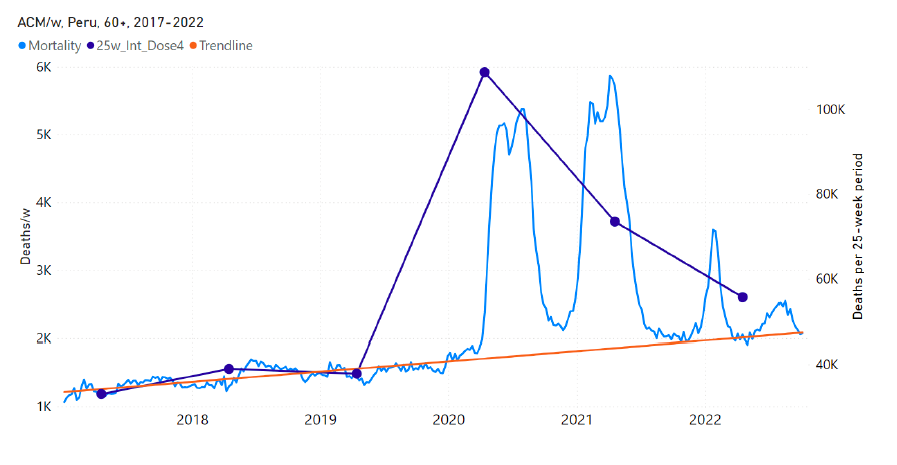
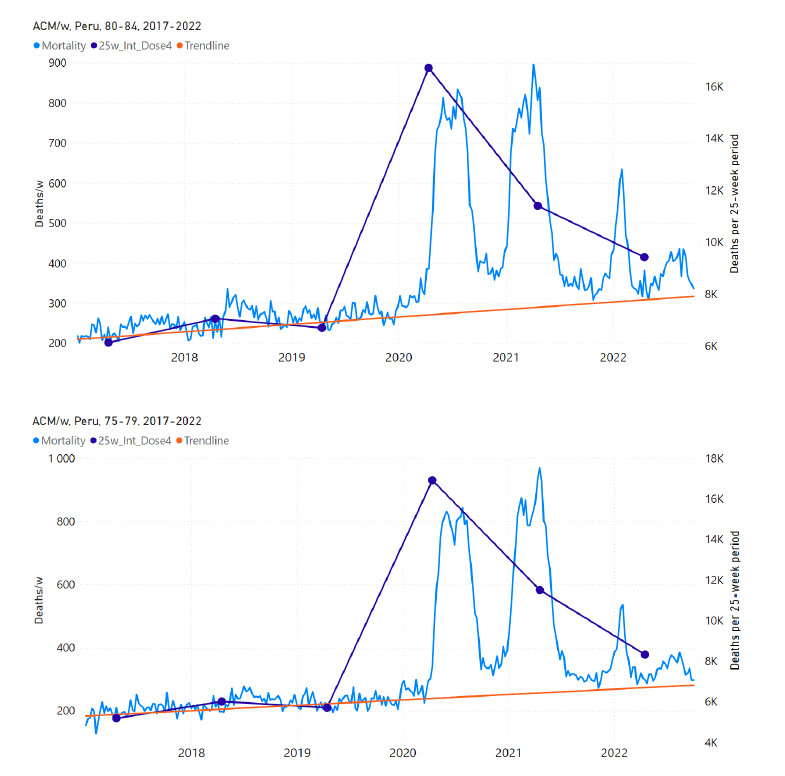
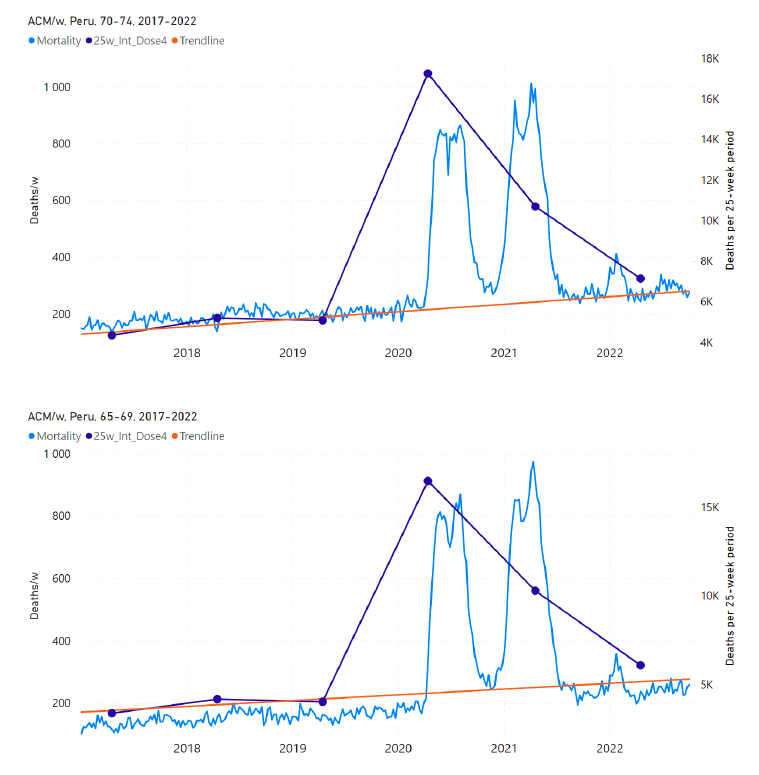
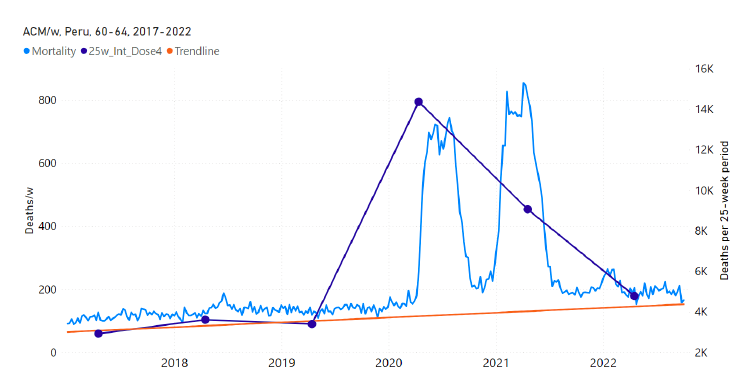
5.7 Peru by Age Group Dose 4 ― National ACM and Vaccine Dose 4 Rollouts (90+, 85-89, 80-84, 75-79, 70-74, 65-69, and 60-64 Years)Similarly to Figure 15, Figure 16 shows the national ACM by week for Peru (light blue), from 2017 to 2022, and the 25-week integration points (dark blue) and trend line (orange) that were used to quantify excess ACM in a peak (nominally, July-August 2022) (“Historical-trend baseline for a period (or peak) of mortality” method, Method 1, see Methods) associated with Peru’s dose-4 rollout, for the 60+ year age group, and for each of the more specific age groups analyzed (90+, 85-89, 80-84, 75-79, 70-74, 65-69, and 60-64 years). The last point (positioned in early 2022) is for the dose-4 vaccination period itself, and each integration point is positioned in time at the start of the integration window. See Methods for details.
Figure 16: Peru (dose 4), ACM by week (light blue), 2017-2022, by age group (60+, 90+, 85-89 … 60-64 years), with integrations, 25-week dose-4-vaccination-period (dark blue, points) and trend line (orange). The data sources are specified in Appendix A.
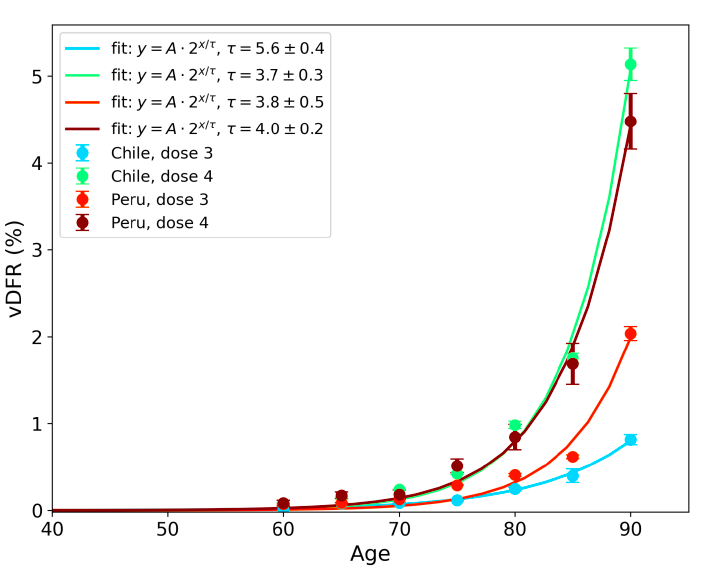
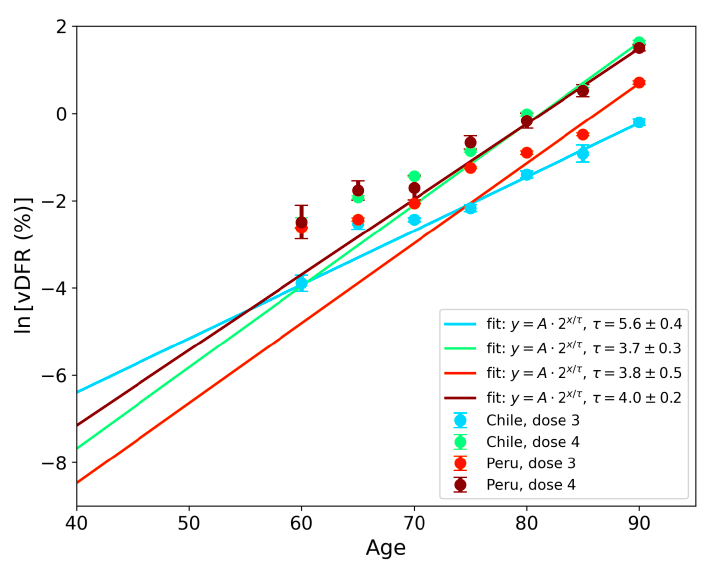
5.8 vDFR by Age ― Age-stratified Vaccine Dose Fatality Rates for Doses 3 and 4 in Chile and PeruFigure 17 (top panel) shows national vDFR (linear scale) versus age (“Historical-trend baseline for a period (or peak) of mortality”, Method 1, see Methods), for Chile and for Peru, for the January-February 2022 peak of interest (Chile dose 4; Peru dose 3), for the peak (nominally, July-August 2022) associated with Peru’s dose-4 rollout, and for the peak (nominally, July-August 2021) associated with Chile’s dose 3 rollout, with exponential fits. Figure 17 (bottom panel) shows the same data using a logarithmic scale for vDFR. Each point is positioned in time at the starting age of the age group. The exponential fits were performed without using the Y-specific errors (i.e., errors in vDFR) shown. Therefore, the resulting error on the doubling-time fit parameter T2 (τ, tau, in the figure legends) is based on the unweighted residual Y-values.
Figure 17: vDFR versus age, for Chile and for Peru, for the January-February 2022 peak (Chile dose 4, Peru dose 3), for the July-August 2022 peak (Peru, dose 4), and for the July-August 2021 peak (Chile, dose 3), with exponential fits. Linear scale (top), log scale (bottom). In Figure 17, the age (X-axis value, in years) assigned to a given age group is the starting age of the window of ages for the age group. This particular choice makes little difference because translating the x values by any constant number, for example, does not affect the doubling time obtained by fitting an exponential function, and only slightly affects the y intercept at x = 0 (the prefactor in the exponential).
5.9 New Zealand All-ages Doses 3 and 4 ― National ACM and Vaccine Dose RolloutsNew Zealand is the case, among our 15 countries having sufficient ACM data, in which a nominally January-February 2022 peak in ACM is the least prominent. Nonetheless, the peak is measurably present for New Zealand, especially in the 80+ years age group. Figure 18 shows the all-ages national ACM by week for New Zealand (black), from 2019 to 2023, compared to the COVID-19 vaccine-dose rollouts. Vertical lines indicate the 11 March 2020 World Health Organization (WHO) announcement of a pandemic (grey), and the bounds of the integration windows for the regions of interest corresponding to the rollouts of doses 3 and 4 (orange and pink, respectively). The bottom panel shows the ACM data for the 80+ years age group, and the same vertical lines, as references.
Figure 18: (top) New Zealand (with rollouts), all-ages ACM by week (black), 2019-2023, with all-ages vaccine rollouts dose 1 to dose 4 (colours). (bottom) ACM by week for 80+ years age group (black), and same integrations bounds (dashed vertical lines). The 11 March 2020 pandemic declaration date is shown by a grey vertical line. The data sources are specified in Appendix A. Figure 19 has the all-ages national ACM by week for New Zealand (light blue), from 2011 to 2023, and the 28-week-integration points that were used to quantify excess ACM in the January-February 2022 peak of interest (“Historical-trend baseline for a period (or peak) of mortality” method, Method 1, see Methods) (dark blue points and orange trend line), associated with New Zealand’s dose-3 rollout (28-week period, orange dashed vertical lines bounds shown in Figure 18).
Figure 19: New Zealand (dose 3), all-ages ACM by week (light blue), 2011-2023, with integrations, 28-week dose-3-vaccination-period (dark blue, points) and trend line (orange). The data sources are specified in Appendix A. Figure 20 shows the all-ages national ACM by week for New Zealand (light blue), from 2011 to 2023, and the 31-week-integration points that were used to quantify excess ACM in a July-August 2022 peak (“Historical-trend baseline for a period (or peak) of mortality” method, Method 1, see Methods) (dark blue points and orange trend line), associated with New Zealand’s dose-4 rollout (31-week period, pink dashed vertical lines bounds shown in Figure 18).
Figure 20: New Zealand (dose 4), ACM by week (light blue), 2011-2023, with integrations, 31-week dose-4-vaccination-period (dark blue, points) and trend line (orange). The data sources are specified in Appendix A. The corresponding dose-specific all-ages vDFR values for New Zealand are: (0.05 ± 0.01) % (nominally January-February 2022, dose 3) and (0.21 ± 0.03) % (nominally July-August 2022, dose 4).
6. Discussion
6.1 COVID-19 Vaccines Can Cause DeathIt is important to discern the question of whether a COVID-19 vaccine injection can cause the death of the patient and the question of whether excess ACM (population level, by definition) is causally associated with the COVID-19 vaccine rollouts. Even if there is clinical and pathological proof that injections can cause the deaths of individual subjects, this does not demonstrate a causal relation between a rapid vaccine rollout and a temporally associated peak in excess ACM. With necessarily limited numbers of documented cases of individual deaths, it only proves that the said causal relation is possible. A formal consideration of causality in excess mortality must nonetheless be made, which is done in sections below. In this context, it is well established that COVID-19 vaccine injections have caused and are likely to cause the deaths of individuals, as shown by:
These data and circumstances support but do not in themselves prove the conclusion of a likely causal link, which is made in several population-level studies, including:
Finally, there are detailed explanations based on principles of immunology as to the cellular, molecular and systems mechanisms for severe harm from COVID-19 vaccines, and as to why, for example, repeated doses can engender non-linearly-more-severe reactions (Palmer et al., 2023).
6.2 Absence of Excess Mortality Until the COVID-19 Vaccines Are Rolled OutPreviously, we have demonstrated that in several countries and states there is no detectable or virtually no excess ACM during the declared pandemic, compared to the recent historic record, until the COVID-19 vaccines are rolled out, followed by large excess mortality during and after vaccine rollout: 1. India (Rancourt, 2022) 2. Australia, and each of its eight states (Rancourt et al., 2022a) 3. Israel (relatively less excess mortality) (Rancourt et al., 2023) 4. Canada (relatively less excess mortality) (Rancourt et al., 2021b, 2022c; Rancourt, 2023) Likewise, in the present paper, we show that 9 of the 17 countries studied have no detectable excess ACM until the vaccines are rolled out: Australia, Malaysia, New Zealand, Paraguay, Philippines, Singapore, Suriname, Thailand, and Uruguay. This is conclusively shown in Figure 2, and corresponding quantifications are given in Table 1 and Figure 3. This means that, in these 9 countries (Australia, Malaysia, New Zealand, Paraguay, Philippines, Singapore, Suriname, Thailand, Uruguay), for approximately one year after the 11 March 2020 WHO declaration of a pandemic, there were no net extra deaths that could be attributed to a pandemic or to pandemic-response medical or government measures. These countries had no extra deaths until they were subjected to rapid mass COVID-19 vaccine administration (Figure 2). This is part of the strong evidence for a causal link, described below.
6.3 The COVID-19 Vaccines Did Not Save Lives and Appear to be Lethal Toxic AgentsSince excess mortality occurred solely after initiating (and during) vaccine rollouts in 9 countries (Australia, Malaysia, New Zealand, Paraguay, Philippines, Singapore, Suriname, Thailand, Uruguay; Figure 2), the vaccines did not reduce serious illness (as claimed by manufacturers) enough to reduce any risk of death. In the 17 countries of the present study, there is no evidence in ACM by time data of any beneficial effect of COVID-19 vaccines. There is no association in time between COVID-19 vaccination and any proportionate reduction in ACM. On the contrary, vaccine administration exhibits known epidemiological characteristics of sudden population-wide exposure to a lethal toxic substance, in all of the 17 countries, and the age groups studied: i. A transition to a regime of higher ACM on initiation of prolonged challenge with the lethal toxic agent (Figure 2, Figure 6, Figure 7) ii. Specific peaks of ACM temporally associated with (synchronous with or immediately following) all sharp peaks in mass challenge with (population-wide administration of) a lethal toxic agent (booster rollouts) (Figure 5, Figure 4, Figure 12, Figure 11, Figure 13, Figure 15, Figure 16, Figure 14, Figure 18, Figure 19, Figure 20) iii. Proportionality between the number of population-wide individual assaults with the presumed lethal toxic agent (individual injections) and the temporally associated excess mortality (Figure 8, Figure 9) iv. An exponentially or near-exponentially increasing lethal toxicity (vDFR) with age of the individuals subjected to the toxic agent (Figure 17) v. Consistent values of the calculated lethal toxicity of the toxic agent (values of vDFR) across many populations and for different episodes of sudden rollouts (all doses, and booster rollouts) (Table 2, Figure 8, Figure 9, Figure 10) vi. Apparent dependence of fatal toxicity on the toxicological nature of the administered agent (vDFR dependence on vaccine type/manufacturer) Regarding point-iv, increasing and exponentially increasing lethal toxicity with age is known from animal and human studies of poisoning and overdoses (e.g., Wiberg et al., 1970; Rogers and Heard, 2007; Chen et al., 2009; Phua et al., 2009; Shively et al., 2017). Regarding point-v, the values of all-ages vDFR, in the 17 countries studied, are consistent within one order of magnitude (Table 2, Figure 9, Figure 10). In Figure 9, the generally larger values in all-ages vDFR for the vaccination period compared to the January-February 2022 ACM peak period may be due to such factors as: different populations being preferentially vaccinated, fragile individuals being eliminated prior to the peak period, differences in vaccine type used, booster policy or societal pressure wherein fragile individuals are avoided in the peak period, a larger contribution from non-COVID-19-vaccine all-ages deaths (i.e., from medical and government measures) in the earlier stages of COVID-19 vaccination, and so forth. The USA Vaccine Adverse Events Reporting System (VAERS) data also shows smaller all-ages fatal vaccine toxicity per injection for boosters relative to pre-booster injections (Hickey and Rancourt, 2022; their Table 1). Other factors that could affect the systematic difference between booster and pre-booster doses include: smaller quantities of active ingredients used in boosters compared to pre-booster doses, and changing immune response on being subjected to repeated challenges (Palmer et al., 2023). Regarding point-vi (in relation to points iv and v), country-to-country differences in values of all-ages vDFR will be dependent on the age structure of the elderly population (> 60 years) and on health status of the elderly. Despite these large confounding effects, there is some evidence of the possible effect of COVID-19 vaccination type or manufacturer:
6.4 Strong Evidence for a Causal Association and Vaccine Lethal ToxicityFirst: Some of the strongest evidence for a causal association and vaccine lethal toxicity is the remarkable temporal associations between rapid first-doses and booster rollouts and immediate peaks in ACM, in specific elderly age groups, including peaks of mortality occurring at times in seasonal cycles when peaks virtually never occur. This was previously graphically illustrated for Israel (Rancourt et al., 2023; their Appendix 2: Figure A2 F1). In the present paper, there are multiple examples of this type of evidence, for Chile (Figure 12, Figure 11, Figure 13) and for Peru (Figure 15, Figure 16, Figure 14), in every case where age-stratified mortality and age-stratified (and dose-specific) vaccination data are available. These findings are conclusive. The associations are numerous and systematic, and there are no counter examples. We have found no evidence in our extensive research on ACM that COVID-19 vaccines had any beneficial effect. If vaccines prevented transmission, infection or serious illness, then there should be decreases in mortality following vaccine rollouts, not increases, as in every observed elderly age group subjected to rapid booster rollouts. And, mortality would not increase solely when vaccines are rolled out, where no excess mortality occurs prior to vaccine rollouts, as we have documented here, in 9 countries across 3 continents. Second: Another strong line of evidence for a causal association and vaccine lethal toxicity is present in data that is not stratified by age. Such mortality and vaccination data is partially confounded by the lack of age stratification. This is mostly because of spread and overlap of vaccine administration to different age groups. Nonetheless, there are several clear examples in non-age-stratified data of temporal associations between peaks in all-ages ACM and peaks in all-ages vaccination rollouts. This was previously demonstrated for Australia and each of 5 of its 8 states (Rancourt et al., 2022a), regarding the January-February 2022 features studied again here (Figure 5, Figure 4, Figure 8, Figure 9, Figure 10). In the present paper, every country with sufficient mortality data (15 countries: Australia, Bolivia, Brazil, Chile, Colombia, Ecuador, Malaysia, New Zealand, Paraguay, Peru, Philippines, Singapore, South Africa, Thailand, Uruguay) exhibits an unprecedented and relatively sharp peak or surge in all-ages ACM during or near January-February 2022 (mid-summer in the Southern Hemisphere), which is synchronous with or immediately preceded by a rapid rollout (all-ages) of a COVID-19 vaccine booster (dose 3 or dose 4, depending on the country), while non-booster doses are also administered at the same time: Figure 5, Figure 4, Figure 11 (top panel), Figure 14 (top two panels), Figure 18, Figure 19, and Figure 21 (Appendix B: Examples of all-cause mortality and vaccination data). Third: Regarding evidence in support of causality and toxicity, we must include the striking examples described above (“Absence of excess mortality until the COVID-19 vaccines are rolled out” section) where no detectable excess mortality occurs until the COVID-19 vaccines are rolled out, in many countries, on several continents. Fourth: And we must include the reproducible and consistent nature of the phenomenon (“The COVID-19 vaccines did not save lives and appear to be lethal toxic agents” section). We should also include prior studies of the same phenomenon, in different jurisdictions, which find compatible results with the present study. In addition to India (Rancourt, 2022), Australia (Rancourt et al., 2022a, 2023), Canada (Rancourt et al., 2021b, 2022c; Rancourt, 2023), and Israel (Rancourt et al., 2023), the USA has a seasonally anomalous peak in ACM occurring in late-summer or fall-2021, which is prominent in the 25-64 years age group in 21 states of the USA, most notably including Alabama, Mississippi, Georgia, Florida and Louisiana. This peak in ACM is synchronous with a rapid surge in vaccine administration (seen as a step-wise increase in cumulative all-dose vaccine administration), in the period corresponding to the so-called “vaccine equity” campaigns in the USA (Rancourt et al., 2022b; their Figures 10C, 10D, and 11A-F). For the entire USA and all-ages, the said late-summer or fall-2021 peak in ACM corresponds to an excess mortality of approximately 160 K deaths, during a period of more than 2 months when approximately 60 M injections (all-doses) were administered. This corresponds to a national all-ages vDFR value of approximately 0.3 % for that period, which would be larger for the states and ages contributing most to the excess mortality (high poverty, most elderly).
6.5 Causality in Excess Mortality Is Amply DemonstratedThe above-described heads of evidence in support of a causal relation between COVID-19 vaccine administration and temporally associated excess ACM can be summarized as follows: i. There is no evidence in ACM-by-time data of any beneficial effect of COVID-19 vaccines. There is no association in time between COVID-19 vaccination and any proportionate reduction in ACM. ii. On the contrary, there occurs an onset or increase of a large excess ACM on rolling out the COVID-19 vaccines, in every country and state or province, studied to date, on virtually all continents, including for initial rollouts occurring at significantly different times (by several months). iii. The said onset manifests itself as a new sustained regime of high excess ACM — punctuated by additional peaks in ACM associated with specific rapid rollouts (boosters) — which surges at the start of vaccination, irrespective of whether or not there was excess mortality prior to vaccination. iv. In many jurisdictions (including each state in Australia), there is no detectable excess ACM until the vaccines are rolled out, when new regimes of high excess ACM are initiated. v. In all studied cases in which available ACM and vaccine rollout data is resolved by age (Israel, Chile, Peru), there is synchronicity between every booster rollout and a sharp peak or feature in ACM, in every elderly age group (> 60 years ages), which is some 30 separate events of synchronicity, at different times in seasonal patterns, in both hemispheres. vi. With ACM and vaccination data that is not resolved by age, there are nonetheless several examples of synchronicity between a burst of vaccination and an anomalous peak in ACM, especially the nominally January-February 2022 peak in ACM, in all 15 countries having sufficient ACM data in the present study, and in 5 of the 8 states of Australia (Rancourt et al., 2022a). vii. There is observed proportionality (not mere correlation) between number of COVID-19 vaccine injections (all ages) and temporally associated all-ages excess ACM, whether one uses specific peaks in ACM or the nominally entire vaccination period. This is shown in Figure 8. viii. The corresponding all-ages toxicities (vDFR, excess-ACM/number-vaccine-injections) for specific ACM peaks and for the vaccination period are proportional to each other, irrespective of the country-to-country differences in their values. This is shown in Figure 9. ix. The values of all-ages vDFR vary from country to country, as one would expect from national differences in population health status and its domestic heterogeneity, and possibly from national differences in vaccine type used, but always lie in the range of approximately 0.02 % to 0.40 % (Figure 8, Figure 9, Figure 10, and Table 2), attaining 1 % in the exceptional case of India (Rancourt, 2022). x. The inferred toxicity (vDFR) increases significantly with age (Figure 17), which is a known characteristic of dose-dependent severe outcomes and fatality from poisons (Wiberg et al., 1970; Rogers and Heard, 2007; Chen et al., 2009; Phua et al., 2009; Shively et al., 2017). xi. The COVID-19 vaccines are known to be intrinsically dangerous and have caused deaths in individuals of all ages (see: “COVID-19 vaccines can cause death” section, and references therein). xii. There is evidence of the possible effect of COVID-19 vaccination type or manufacturer (see: “The COVID-19 vaccines did not save lives and appear to be lethal toxic agents” section). As such, the robust criteria described by Ioannidis (2016) for proving causality are amply satisfied: Experiment: The same phenomenon is independently observed in distinct jurisdictions, for distinct age groups, and at different times, which constitutes ample verification in independent real-world large-scale experiments. Temporality: The many step-wise increases and anomalous peaks in ACM are synchronous with vaccine rollouts; including in jurisdictions in which excess mortality did not occur until vaccination was implemented after approximately one year into the declared pandemic. Consistency: The phenomenon is qualitatively the same and of comparable magnitude each time it is observed. There can be little doubt that the mass COVID-19 vaccination campaigns caused the temporally associated excess mortality in the 17 countries of the present study, and in other countries studied to date. Regarding quantification (calculation of all-ages vDFR), a main uncertainty arises when the nominally entire vaccination period is used. In this case, when there is excess ACM prior to the start of COVID-19 vaccination, due to causes other than COVID-19 vaccination (i.e., medical and government measures), one should consider whether these causes continue, to some degree, into the COVID-19 vaccination period. There is some evidence for this. For example, three countries having among the largest vaccination-period all-ages vDFR to peak-period all-ages vDFR ratios (Peru, Ecuador, Colombia; Figure 9) also have very large pre-vaccination all-ages excess ACM features (Figure 2, Figure 6). Three countries having the smallest vaccination-period all-ages vDFR to peak-period all-ages vDFR ratios (Uruguay, Singapore, Malaysia; Figure 9) have no pre-vaccination all-ages excess ACM (Figure 2, Figure 6). However, of the five countries having the largest values of vaccination-period all-ages vDFR (South Africa, Suriname, Bolivia, Paraguay, Philippines; Figure 10, Table 2), three have no all-ages excess ACM in the pre-vaccination period (Suriname, Paraguay, Philippines; Figure 2, Figure 6). Overall, there is no consistent and systematic variation between all-ages vDFR values and pre-vaccination period all-ages excess ACM, and there is essentially the same proportionality (with zero intercept) between all-ages excess ACM and injections administered for both integration periods examined (Figure 8). Importantly, we must also keep in mind, with all-ages evaluations, that pre-COVID-19-vaccination-period interventions causing excess ACM (e.g., government measures) can have large contributions in the younger age groups, whereas vaccine deaths (for boosters in particular; doses 3 and 4) are essentially confined to 60+ year-olds (Figure 11, Figure 14; and see Rancourt et al., 2021a, 2022b, 2023). Furthermore, COVID-19 vaccination is intended to alleviate or eliminate the need for measures other than COVID-19 vaccination, and to reduce mortality, which should reduce non-COVID-19-vaccination measures in the vaccination period. And, finally, it is possible that some of the countries had increased seasonal-flu-vaccination campaigns at the end of 2020. When an ACM-peak integration region is used (in quantifying an all-ages vDFR), an uncertainty might arise from a non-optimized region of integration for counting the injections that are temporally associated with the peak in ACM, which can lead to some undercounting or overcounting. Generally, it appears that all such uncertainties are small compared to the large country-to-country variability of all-ages vDFR values, which is reported below. Therefore, the total number of deaths inferred in the present study of 17 equatorial and Southern-Hemisphere countries to have been caused by the COVID-19 vaccine injections is 1,745,000 ± 49,000, for a total of 1,388,145,365 injections over the same nominally entire vaccination periods of the 17 countries, compared to the overall Covid-period excess mortality of 2,393,000 ± 88,000 (Table 1). As such, the overall, vaccination-period value of all-ages vDFR for the 17 countries in the study is: vDFR = (1,745,000 ± 49,000 deaths) / (1,388,145,365 injections) = (0.1257 ± 0.0035) %. The mean country-to-country variability, relative to this overall value of all-ages vDFR is 0.079 % (Table 1, see also Table 2). Therefore, the all-ages vDFR results from the 17 countries can be summarized as:
Previously, we estimated that a representative global value would be 0.1 %, and that this would represent approximately 13 million deaths from the COVID-19 vaccines, from 13.25 billion injections up to 24 January 2023 (Rancourt et al., 2023). This can be updated as follows: (0.1257 ± 0.0035) % x 13.50 billion injections (2 September 2023, OWID, 2023a) = (16.97 ± 0.47) million COVID-19 vaccine deaths worldwide, to date. This current estimate is based on: 10.3 % of worldwide COVID-19 injections, 9.10 % of worldwide population, and a vaccination rate of 1.91 injections per person (all ages), in 17 countries. This implies that 17.0 ± 0.5 million COVID-19 vaccine deaths would have occurred globally, up to 2 September 2023. In other words, analysis of ACM by time in the 17 countries studied shows that the global COVID-19 vaccination campaign was in effect a mass iatrogenic event that killed (0.213 ± 0.006) % of the world population, and did not measurably prevent any deaths. Keeping in mind the caveats mentioned above, Table 1 also suggests that, overall, in the 17 countries studied, (1,744,829 ± 49,285) / (2,392,831 ± 87,904) = (73 ± 3) % of excess deaths of the entire nominal Covid period (from 11 March 2020 to the end, usually in 2023, of available data, see Appendix C) were early deaths causally induced by the COVID-19 vaccine injections, keeping in mind that in 9 of the 17 countries this fraction was 100 % (“Absence of excess mortality until the COVID-19 vaccines are rolled out” section). This occurred in circumstances in which there is no evidence in any ACM-by-time data that the vaccination rollouts prevented any deaths whatsoever.
6.6 Assessing Other Interpretations of the Cause of the Excess MortalityCompeting interpretations of the cause or causes of the excess mortality in the nominally January-February 2022 ACM peaks occurring in equatorial-latitude and Southern-Hemisphere countries are stated (in italics) and discounted as follows: I. The peaks are seasonal peaks or are confounded by seasonal variations in ACM. Unlikely. The peaks are relatively narrow and occur during the Southern-Hemisphere summer period, normally a trough in mortality. There is no seasonal component of increased mortality corresponding to increased mortality in January-February in the Southern Hemisphere; and equatorial countries do not exhibit seasonal patterns of mortality. II. The peaks are due to intense summer heat waves. Unlikely. Heat-wave mortality peaks, when they occur, are much narrower and never occur synchronously in a global hemisphere. There were no such climatic events recorded in January-February 2022 in the countries included in this study. III. The peaks are due to one or several earthquakes. Unlikely. Earthquake peaks are initially very narrow, from people crushed in falling buildings, and they occur locally, near the earthquake epicenter. IV. The peaks are due to simultaneous and short-lived outbreaks of war, famine or some deadly disease in January-February 2022, across equatorial latitudes and the Southern Hemisphere. Unlikely. No such events occurred in the countries studied. (Sudden emergence of deadly COVID-19 variants is addressed in point-VII, and below.) V. The peaks are due to aggressive Covid measures, treatments or responses (other than vaccine booster administration) applied in January-February 2022. Unlikely. Covid measures, treatments or responses vary widely from jurisdiction to jurisdiction, as do the demographics of the populations at highest risk (e.g., Johnson and Rancourt, 2022). No measures, treatments or responses were uniformly and synchronously applied in January-February 2022 in the equatorial regions and the Southern Hemisphere. VI. The peaks are due to underlying population health conditions and/or comorbidities of the deceased. Unlikely. The fatal consequences of underlying health conditions and the presence of chronic conditions among those with the shortest life expectancies cannot suddenly arise by accident, at the population level, to cause a sharp peak in mortality. Rather, these underlying circumstances will participate in causing country-to-country variability in fatal response to any rapidly introduced toxic agent. Furthermore, there is no evidence in the ACM data of a so-called dry tinder effect: Those who died in the mortality peaks would not have died in a short time that followed, and the excess mortalities are large net excesses on the timescale of several years. VII. The peaks are due to the emergence of one or more variant(s) of SARS-CoV-2 causing synchronous mortality peaks in January-February 2022, across the equatorial regions and the Southern Hemisphere. Unlikely. Epidemiological theory of a contact-spreading viral respiratory disease predicts a wide range of delay (months, years) between seeding of a new variant and measurable exponential growth of mortality (or peak of new infections), depending sensitively on characteristics of the society (e.g., Parham and Michael, 2011; Hasegawa and Nemoto, 2016; Ma et al., 2022). On the question of comorbidities, it is known that newly imposed conditions or challenges against frail or susceptible individuals can induce premature death. Premature death is death. The higher the frailty, the more likely and immediate the fatal response. In such circumstances, the said newly imposed conditions or challenges unambiguously caused the death. This would be true of a violent traffic accident and it is equally true for challenges with a toxic substance or with newly imposed circumstances causing significant psychological stress. Regarding logically attributing the cause of death, it is irrelevant, for example, that in all cases the heart ultimately stopped functioning and breathing stopped. Regarding the theory of emergence of one or more variant(s) of SARS-CoV-2, this emergence would have to cause simultaneous peaks and surges of mortality in 17 countries across 4 continents (Figure 1, Figure 2, Figure 4, Figure 11, Figure 14, Figure 18), which is a statistically impossible occurrence if we accept the theories of spontaneous viral mutations and contact spreading of viral respiratory diseases; and all the resulting peaks of mortality would have the remarkable coincidence of occurring precisely when vaccine boosters were rolled out. In advancing interpretations of excess mortality based on changing variant predominances, one should be wary that variant predominance evaluation based on data from genomic surveillance networks is a new methodology in its tentative infancy, essentially introduced during the latest (COVID-19) pandemic declared by the WHO, which may be driven by institutional and industry interests, rather than rigorous efforts to determine analytic reliability. At this stage, the public health establishment relies in part on surveys of experts to gauge robustness of the method, and even these selected experts opine confidence scores in the broad range from “very low” to “very high”, depending on methodological details and intended application (Worp et al., 2023). A main limitation of genomic surveillance, which has not been quantified or resolved, is that the genomic measurements, assumed to be valid and intended to represent a given region at a given time, are taken from small non-randomized cohorts. Randomization is essential because people go into clinics and hospitals (where samples for genomic measurement are volunteered) precisely because they have particular concerns or conditions. In the words of the many authors of a recent overview of genomic surveillance: “The findings of this report are subject to at least four limitations. First, estimates might be biased by nonrandom sampling of specimens or differential timing of reporting…” (Lambrou et al., 2022). Also, the surveillance itself targets so-called “consensus variants”, which are arbitrarily chosen (Lambrou et al., 2022). In addition, the viral characteristics that are assigned by authors to a particular variant believed to be predominant are generally assigned by circular reasoning to achieve the desired interpretation of epidemiological data, rather than obtained in controlled clinical trials. This was the case in a recent attempt to explain an excess mortality event in India: Dhar et al. (2021) postulated that the April-July 2021 “second wave” event in Delhi (India) was due to the Delta variant, which would have quickly swept Delhi to become predominant because it would have had higher transmissibility and larger immune escape than concomitantly circulating variants. However, Dhar et al. estimated the needed characteristics of Delta by fitting a model to the epidemiological data and to the variant predominance (estimated by genomic measurements from small non-randomized cohorts). The inferred characteristics of Delta were obtained by fitting the said characteristics to the epidemiological data, rather than being independently determined via any clinical, animal-model or in vitro study.
6.7 Implications Regarding Age-dependence of Fatal Toxicity of COVID-19 VaccinesThe detailed age and dose-discriminated data for Chile and Peru is remarkable and allows unprecedented certainty in assigning temporal associations between sharp peaks in ACM and sharp peaks in specific booster rollouts to specific age groups. It also allows unprecedented certainty in quantifying the age dependence of the fatal toxicity from COVID-19 vaccines. The risk of death per injection (vDFR) increases exponentially with age, for 60+ years ages, doubling approximately every 4 years in age, and attains values of approximately 5 % for 90+ year-olds subjected to dose 4 (2nd booster) in both Chile and Peru (Figure 17), for which age and dose-discriminated data is available. vDFR = 5 % corresponds to 1 death per 20 injections of dose 4 for 90+ year-olds in Chile and Peru (Figure 11, Figure 14, Figure 17). The exponential increases of vDFR with age found for Chile and Peru in the present study (Figure 17) are essentially the same as those previously measured for Israel and Australia (Rancourt et al., 2023; their Figure 3), and the extracted doubling ages (T2) (increases in age to double the risk of death per injection, vDFR) are consistent between all values determined to date: Table 3: Extracted doubling ages, increases in age to double risk of death per injection
In Table 3, the quoted errors are 1-sigma errors. For Australia and Israel, the dose numbers were not discriminated, and the calculation is based on the nominally entire vaccination periods, rather than specific ACM peaks (Rancourt et al., 2023). This doubling age (T2) of approximately 4-5 years for risk of dying per injection of the COVID-19 vaccines (Table 3) is approximately half of the doubling age of 10 years for risk per year (or per any sufficiently small fixed unit of time) of dying of all causes in a modern human population, and of the main old-age diseases cancer, pneumonia and heart disease (Strehler and Mildvan, 1960). This difference between doubling age for risk of dying per injection and risk per year of dying of all causes means that the age effect is greater on risk of dying from being challenged by injection with the COVID-19 vaccines than on the risk of dying (per fixed unit time) of old age in general. A doubling age may be a characteristic of the type of challenge. For example, risk of death from challenge by violent automobile accident would be relatively age-independent, corresponding to a large T2. Likewise, if the risk of death from the challenge is tied to a physiological system that degrades more rapidly with age, for advanced ages, than overall death-causing aging itself, then T2 would be smaller than its value for risk (per fixed unit time) of dying of all causes. Therefore, doubling age (T2) provides information about the mechanism of death from challenge by COVID-19 vaccine injection, for elderly subjects. More importantly and concretely, our results establish large and age-dependent values of vDFR in elderly people, as large as 5% (1 death per 20 injections) measured for 90+ year-olds in Chile and Peru (Figure 17), 1 % (1 death per 100 injections) (nominally all ages) in India (Rancourt, 2022), 0.55 % (1 death per 180 injections) for 80+ year-olds in Israel (Rancourt et al., 2023; their Table 2), and 0.93 % (1 death per 110 injections) for 85+ year-olds in Australia (Rancourt et al., 2023; their Table 1). This turns the public health policy of prioritizing elderly people for injection with COVID-19 vaccines on its head, in actual circumstances in which there were no reliable controlled clinical trials focussing on representative elderly subjects. The public health notion that elderly and vulnerable individuals must be prioritized for COVID-19 vaccination assumes: i. a constant age-independent vDFR ii. a small value of vDFR (optimistically estimated from managed trials, funded by the pharmaceutical industry) Our research shows that both assumptions (i and ii) are false, and far from reality in the field, on the scale of nations. The said public health notion has always been baseless since it was not anchored in any sufficient evaluation of age-stratified risk of fatality from the COVID-19 injections (e.g., Veronese et al., 2021; Abbatecola et al., 2022; Gao et al., 2022), and is now proven to be incorrect. Prioritizing elderly people for COVID-19 vaccination, in the absence of relevant data, was reckless. Norway may be the only jurisdiction that immediately and publicly recognized a problem and changed its policy regarding vaccinating the most elderly and frail (Reuters, 18 January 2021; Fortune, 15 January 2021). The same criticism may be valid for other treatments supposedly intended to protect the elderly, such as seasonal influenza vaccines, or any medication having intrinsic toxicity and not sufficiently (and independently) tested on elderly cohorts having age-related chronic conditions. Some will be tempted to compare our results (Figure 17, Table 3) with published age-stratified COVID-19 infection fatality rates (IFR) (e.g., COVID-19 Forecasting Team, 2022; Pezzullo et al., 2023). While in principle this is a correct approach of risk-benefit analysis, we believe that the IFR studies are not reliable, for the following reasons: i. The deaths in the numerator of IFR are “COVID-19 deaths”, and this cause of death assignation is susceptible to bias and is highly uncertain (Rancourt, 2020; Rancourt et al., 2020, 2021a, 2021b, 2022c; and the present study, esp. Figure 2). ii. The number of infections, in the denominator of IFR, is reliant on molecular antibody tests, which are not specific and have not been sufficiently validated (e.g., Rancourt, 2021). iii. If the IFR evaluations were valid, then it would be virtually impossible for jurisdictions like Australia, Canada, India, Israel, Malaysia, New Zealand, Paraguay, Philippines, Singapore, Suriname, Thailand, and Uruguay to have no detectable or relatively very little excess ACM in the pre-vaccination period of the declared pandemic. iv. We do not detect any excess ACM that can be attributed to COVID-19 in the jurisdictions that we have studied in detail (USA and all its states; Canada and its provinces; France and its departments and regions; Australia and its states) (Rancourt, 2020, 2022; Rancourt et al., 2020, 2021a, 2021b, 2022a). At this stage, we would urge the WHO and governments to pause the misguided and baseless public health policy of prioritizing elderly people for injection with COVID-19 vaccines, and with influenza vaccines, until valid risk-benefit analyses are made and publicly reported.
6.8 Excess ACM by Time Prior to COVID-19 Vaccine RolloutsNone of the 17 countries studied have anomalous excess mortality peaks prior to the WHO’s 11 March 2020 declaration of a pandemic (Figure 2, Figure 12, Figure 15, Figure 20, Figure 21, Figure 22), as is generally true for all countries studied previously. Eight of the 17 countries studied have significant excess ACM peaks in the approximately one year period between 11 March 2020 and the first COVID-19-vaccine injections (hereafter, “pre-vaccination period”) (Figure 2, Figure 6, Figure 21): Argentina, Bolivia, Brazil, Chile, Colombia, Ecuador, Peru, and South Africa. Two of the 8 countries with significant excess ACM peaks in the pre-vaccination period (Argentina and Brazil) simply have larger seasonal peaks in mid-2020, and no other anomalous excess ACM features in the pre-vaccination period (Figure 6). The other 6 of the 8 countries with significant excess ACM peaks in the pre-vaccination period (Bolivia, Chile, Colombia, Ecuador, Peru, South Africa) have very large, unprecedented, and relatively sharp peaks in ACM in the pre-vaccination period (Figure 6):
Also, Australia, Malaysia, New Zealand and Uruguay appear to have somewhat smaller ACM in the approximately-one-year-duration pre-vaccination period, compared to the recent historic trend (Figure 2, Figure 6, Figure 20, Figure 21). These depressed mortalities in the pre-vaccination period are near the limit of statistical significance compared to historic behaviours of ACM by time. If they are real, and if they are due to institutional and government measures implemented after 11 March 2020, then some questions arise: i. Why did this occur in only 4 of the 17 countries studied, and the opposite in 8 of the countries? ii. Why did these countries implement coerced COVID-19 vaccination, after one year of such positive observations? Overall, the patterns and magnitudes of ACM by time vary tremendously, from country to country, in the pre-vaccination period (Figure 6):
In addition, a country such as Bolivia, which has an extraordinarily large peak of excess ACM in the pre-vaccination period, can share a major land border with a country such as Paraguay, which has no detectable excess ACM in the pre-vaccination period. We attribute this variability in the pre-vaccination period to large country-to-country differences in aggressive medical and government measures, convoluted with underlying population structures of fragile individuals, similarly to the large state-to-state differences in the USA (Rancourt et al., 2021a; Johnson and Rancourt, 2022). By comparison, the patterns and magnitudes of ACM by time are relatively consistent, from country to country, in the vaccination period (Figure 6):
For Singapore, both vaccination-period peaks are later, but each is immediately preceded by a maximum in vaccine-injection administration (Figure 6). For Suriname, the first vaccination-period peak in ACM actually has a two-peak structure, but each peak in the pair is preceded by a maximum in vaccine-injection administration (Figure 6). We attribute this relative constancy from country to country of excess ACM by time of the vaccination period as being due to the large uniformity in timing of COVID-19 vaccine and booster rollouts across the 17 countries; whereas medical and government measures were generally more disparate in the pre-vaccination period.
7. Conclusion
7.1 Causality ProvenThe 17 countries studied (Argentina, Australia, Bolivia, Brazil, Chile, Colombia, Ecuador, Malaysia, New Zealand, Paraguay, Peru, Philippines, Singapore, South Africa, Suriname, Thailand, Uruguay) comprise 9.10 % of worldwide population, 10.3 % of worldwide COVID-19 injections (vaccination rate of 1.91 injections per person, all ages), virtually every COVID-19 vaccine type and manufacturer, and span 4 continents. The scientific tests for causality are amply satisfied, as extensively demonstrated in these sections of the present paper:
Also, there are no known facts that disprove the inferred and quantitative causal relation between the observed excess ACM peaks and the temporally associated COVID-19 vaccine and booster rollouts.
7.2 Actual Vaccine Mortality Much Larger Than that Incorrectly Inferred from Faulty DataThere can be little doubt that the peaks in excess ACM are caused by the COVID-19 vaccinations, with a mean all-ages fatal toxicity by injection of vDFR = (0.126 ± 0.004) %, or approximately 1 death per 800 injections, which is reasonably expected to be globally representative. This is a staggering number, compared to what is generally believed about traditional vaccines, which is approximately one serious adverse effect per million (Malhotra, 2023). It is three orders of magnitude (one thousand times) larger. In contrast to this large number from ACM data, the effective all-ages vDFR values inferred from other sources — the small number of autopsy confirmations, adverse effect monitoring of deaths, the small number of national vaccine injury compensation payments for deaths, pharmaceutical-industry clinical trial reports, and death-certificates and corresponding government-reported cause-of-death statistics — for COVID-19 vaccines are significantly smaller, again by orders of magnitude. Therefore, we conclude with a high degree of certainty that adverse-effect monitoring, clinical trial reports, and death-certificate statistics greatly underestimate the fatal toxicity of the injections. The large gap between incorrectly inferred and actual population-level vDFR values probably occurs because of systemic avoidance of admitting the injections as a possible cause of death in frail and vulnerable patients. For example, the cause(s) of death will be attributed to particular organ or system failures, without reference to the vaccine, even if the injection was recent and the patient was previously stable. The measured all-ages vDFR of (0.126 ± 0.004) % implies that 17.0 ± 0.5 million COVID-19 vaccine deaths would have occurred globally, up to 2 September 2023. It appears that the global COVID-19 vaccination campaign was in effect a mass iatrogenic event that killed (0.213 ± 0.006) % of the world population (1 death per 470 living persons, in less than 3 years), and did not measurably prevent any deaths.
7.3 The Policy of Prioritizing Elderly Residents for COVID-19 Vaccination Must be EndedThe detailed age and dose-discriminated data for Chile and Peru allows unprecedented certainty in quantifying the age dependence of the fatal toxicity from COVID-19 vaccines. The risk of death per injection (vDFR) increases exponentially with age, for 60+ years ages, doubling approximately every 4 years in age, and attains values of approximately 5 % for 90+ year-olds subjected to dose 4 (2nd booster). vDFR = 5 % corresponds to 1 death per 20 injections of dose 4 for 90+ year-olds. These vDFR values are consistent with all prior evaluations based on ACM:
The population-level age-dependence of vDFR (doubling every 4 years in age) and its large magnitude should induce governments to immediately implement an absolute pause on the baseless public health policy of prioritizing elderly people for injection with COVID-19 vaccines, until valid risk-benefit analyses are made and publicly reported. The same may be true of seasonal influenza vaccines.
References
Aaby et al. (2020): Aaby, P., Benn, C.S., Flanagan, K.L. et al. /// The non-specific and sex-differential effects of vaccines /// Nature Rev Immunol 20, 464–470 (2020). https://doi.org/10.1038/s41577-020-0338-x Aarstad and Kvitastein (2023): Aarstad, J.; Kvitastein, O.A. /// Is there a Link between the 2021 COVID-19 Vaccination Uptake in Europe and 2022 Excess All-Cause Mortality?. /// Preprints 2023, 2023020350. https://doi.org/10.20944/preprints202302.0350.v1 Abbatecola et al. (2022): Angela Marie Abbatecola, Raffaele Antonelli Incalzi, Alba Malara et al. /// Monitoring COVID-19 vaccine use in Italian long term care centers: The GeroCovid VAX study. /// Vaccine, Volume 40, Issue 15, 2022, Pages 2324-2330, ISSN 0264-410X, https://doi.org/10.1016/j.vaccine.2022.02.064. Achilleos, S. et al. (2021) /// Excess all-cause mortality and COVID-19-related mortality: a temporal analysis in 22 countries, from January until August 2020 /// International Journal of Epidemiology, p. dyab123. https://doi.org/10.1093/ije/dyab123 Ackley, C.A. et al. (2022) /// County-level estimates of excess mortality associated with COVID-19 in the United States /// SSM – Population Health, 17, p. 101021. https://doi.org/10.1016/j.ssmph.2021.101021 Acosta et al. (2022): Acosta RJ, Patnaik B, Buckee C, Kiang MV, Irizarry RA, Balsari S, et al. /// All-cause excess mortality across 90 municipalities in Gujarat, India, during the COVID-19 pandemic (March 2020-April 2021). /// PLOS Glob Public Health, 2022, 2(8): e0000824. https://doi.org/10.1371/journal.pgph.0000824 Al Wahaibi et al. (2021): Adil Al Wahaibi, Amal Al-Maani, Fatma Alyaquobi, Khalid Al Harthy, Amina Al-Jardani, Bader Al Rawahi, Seif Al-Abri /// Effects of COVID-19 on mortality: A 5-year population-based study in Oman /// International Journal of Infectious Diseases 104 (2021) 102–107. https://doi.org/10.1016/j.ijid.2020.12.054 Anand et al. (2021): Anand, Abhishek; Justin Sandefur; and Arvind Subramanian, 2021. /// Three New Estimates of India’s All-Cause Excess Mortality during the COVID-19 Pandemic /// CGD Working Paper 589. Washington, DC: Center for Global Development. https://cgdev.org/publication/three-new-estimates-indias-all-cause-excess-mortality-during-covid-19-pandemic (accessed 5 Aug 2023) Bilinski and Emanuel (2020): Bilinski A, Emanuel EJ. /// COVID-19 and Excess All-Cause Mortality in the US and 18 Comparison Countries /// JAMA. 2020;324(20):2100–2102. doi:10.1001/jama.2020.20717. https://jamanetwork.com/journals/jama/fullarticle/2771841 Bilinski et al. (2023): Bilinski A, Thompson K, Emanuel E. /// COVID-19 and Excess All-Cause Mortality in the US and 20 Comparison Countries /// June 2021-March 2022. JAMA. 2023;329(1):92–94. doi:10.1001/jama.2022.21795. https://jamanetwork.com/journals/jama/fullarticle/2798990 Böttcher et al. (2021): Böttcher, L., D’Orsogna, M.R. & Chou, T. /// Using excess deaths and testing statistics to determine COVID-19 mortalities /// Eur J Epidemiol 36, 545–558 (2021). https://doi.org/10.1007/s10654-021-00748-2 Bustos Sierra et al. (2020): Bustos Sierra, N., Bossuyt, N., Braeye, T. et al. /// All-cause mortality supports the COVID-19 mortality in Belgium and comparison with major fatal events of the last century /// Arch Public Health 78, 117 (2020). https://doi.org/10.1186/s13690-020-00496-x Chaganti et al. (2023): Chaganti PD, Konkay K, Karri MD et al. /// Autopsy findings in deaths following severe acute respiratory syndrome coronavirus 2 vaccination. /// J Clin Sci Res 2023;12: 51-6. DOI: 10.4103/jcsr.jcsr_147_22. https://journals.lww.com/jcsr/Fulltext/2023/12010/Autopsy_findings_in_deaths_following_severe_acute.11.aspx (accessed 11 August 2023) Chan et al. (2021): Chan, E.Y.S., Cheng, D. and Martin, J. /// Impact of COVID-19 on excess mortality, life expectancy, and years of life lost in the United States /// PLOS ONE, 16(9), p. e0256835. Available at: https://doi.org/10.1371/journal.pone.0256835 Chen et al. (2009): Ying-Ju Chen, Ming-Ling Wu, Jou-Fang Deng et al. /// The epidemiology of glyphosate-surfactant herbicide poisoning in Taiwan, 1986–2007: a poison center study /// Clinical Toxicology, 47:7, 670-677, DOI: 10.1080/15563650903140399, https://doi.org/10.1080/15563650903140399 Choi et al. (2021): Sangjoon Choi, SangHan Lee, Jeong-Wook Seo et al. /// Myocarditis-induced Sudden Death after BNT162b2 mRNA COVID-19 Vaccination in Korea: Case Report Focusing on Histopathological Findings /// Journal of Korean Medical Science 2021; 36(40): e286. DOI: https://doi.org/10.3346/jkms.2021.36.e286 Corbett (6 September 2022): Neil Corbett /// Maple Ridge woman compensated for mother’s death from COVID-19 vaccine /// Maple Ridge-Pitt Meadows News, 6 September 2022, https://www.mapleridgenews.com/news/maple-ridge-woman-compensated-for-mothers-death-from-covid-19-vaccine/ – archived here: https://archive.is/wNoYF COVID-19 Forecasting Team (2022): COVID-19 Forecasting Team. /// Variation in the COVID-19 infection–fatality ratio by age, time, and geography during the pre-vaccine era: a systematic analysis. /// Lancet 399 (2022) 1469-1488, https://doi.org/10.1016/S0140-6736(21)02867-1. Crum et al. (2021): Crum T, Mooney K, Tiwari BR. /// Current situation of vaccine injury compensation program and a future perspective in light of COVID-19 and emerging viral diseases. /// F1000Res. 2021 Dec 7; 10: 652. doi: 10.12688/f1000research.51160.2. PMCID: PMC8733825. https://doi.org/10.12688%2Ff1000research.51160.2 Dahal et al. (2021): Dahal, S., Banda, J.M., Bento, A.I. et al. /// Characterizing all-cause excess mortality patterns during COVID-19 pandemic in Mexico /// BMC Infect Dis 21, 432 (2021). https://doi.org/10.1186/s12879-021-06122-7 Das-Munshi et al. (2021): Jayati Das-Munshi, Chin Kuo Chang, Ioannis Bakolis et al. /// All-cause and cause-specific mortality in people with mental disorders and intellectual disabilities, before and during the COVID-19 pandemic: cohort study /// The Lancet Regional Health – Europe, Volume 11, 2021, 100228, ISSN 2666-7762, https://doi.org/10.1016/j.lanepe.2021.100228 de Boer et al. (2023): Pieter T. de Boer, Jan van de Kassteele, Eric R.A. Vos et al. /// Age-specific severity of SARS-CoV-2 in February 2020 – June 2021 in the Netherlands /// medRxiv 2023.02.09.23285703; doi: https://doi.org/10.1101/2023.02.09.23285703 (v1, accessed 10 August 2023) de Boer, Crawford, Parsons (2023): de Boer, H.H., Crawford, N.W. & Parsons, S. /// Commentary on: “Autopsy-based histopathological characterization of myocarditis after anti-SARS-CoV-2-vaccination” by C. Schwab et al.. /// Clin Res Cardiol (2023). https://doi.org/10.1007/s00392-023-02197-1 de Gier et al. (2023): Brechje de Gier, Liselotte van Asten, Tjarda M. Boere et al. /// Effect of COVID-19 vaccination on mortality by COVID-19 and on mortality by other causes, the Netherlands, January 2021–January 2022. /// Vaccine, Volume 41, Issue 31, 2023, Pages 4488-4496, ISSN 0264-410X, https://doi.org/10.1016/j.vaccine.2023.06.005 Demetriou et al. (2023): Christiana A Demetriou and others, on behalf of the C-MOR Consortium /// Impact of the COVID-19 pandemic on total, sex- and age-specific all-cause mortality in 20 countries worldwide during 2020: results from the C-MOR project /// International Journal of Epidemiology, Volume 52, Issue 3, June 2023, Pages 664–676, https://doi.org/10.1093/ije/dyac170 Deshmukh et al. (2021): Yashwant Deshmukh, Wilson Suraweera, Chinmay Tumbe et al. /// Excess mortality in India from July 2020 to July 2021 during the COVID pandemic: death registration, health facility deaths, and survey data /// medRxiv 2021.07.20.21260872; doi: https://doi.org/10.1101/2021.07.20.21260872 (accessed 5 Aug 2023) Dhar et al. (2021): Dhar MS, Marwal R, Vs R et al. /// Genomic characterization and epidemiology of an emerging SARS-CoV-2 variant in Delhi, India. /// Science. 2021 Nov 19;374(6570):995-999. doi: 10.1126/science.abj9932. Epub 2021 Oct 14.PMID: 34648303;PMCID: PMC7612010.https://doi.org/10.1126/science.abj9932 Donzelli et al.(2023):Donzelli, A.;Malatesta, G.; DiPalmo, G.et al. ///All-Cause MortalityAccording to COVID-19Vaccination Status: an analysis ofthe UK Officefor National StatisticsPublic Data./// Preprints,2023, 2023020414.https://doi.org/10.20944/preprints202302.0414.v1 Edler et al.(2021):Carolin Edler, Anke Klein, AnnSophie Schröderet al. /// Deaths associatedwith newly launched SARS-CoV-2 vaccination (Comirnaty®)./// Legal Medicine, Volume 51,2021, 101895,ISSN 1344-6223,https://doi.org/10.1016/j.legalmed.2021.101895 Edmonds et al. (2023):Edmonds, R, Schönborn,L, Habben, S, Paparoupa, M, Greinacher, A,Schuppert, F./// Vaccine-induced immune thrombotic thrombocytopenia (VITT) after SARS-CoV-2 vaccination:Two casesfromGermany with unusual presentation./// Clin Case Rep.2023; 00:e6883. doi:10.1002/ccr3.6883. https://doi.org/10.1002/ccr3.6883 Engler (2022): Jonathan Engler/// Were the unprecedented excess deaths curves in Northern Italy in spring 2020 caused by the spread ofa novel deadly virus? A reassessment ofthe available evidence suggests anotherfactor was involved./// BizNews,14 September2022.https://www.biznews.com/health/2022/09/14/excess-deaths-healthcare-panic| See also:The Lombardy Analysis:Lombardy deaths in March 2020 reveal a patternwhich seemsdifficultto explain by viral spread.PANDA Uncut, 22 August2022.https://pandauncut.substack.com/p/the-lombardy-analysis Esposito et al. (2023): Esposito, M.; Cocimano,G.;Vanaria, F.et al./// Deathfrom COVID-19 in a Fully Vaccinated Subject: A Complete Autopsy Report.///Vaccines2023, 11,142.https://doi.org/10.3390/vaccines11010142 Faust et al.(2021) ///All-Cause Excess Mortality and COVID-19–Related Mortality Among USAdults Aged 25-44 Years, March-July 2020 ///JAMA, 325(8), pp. 785–787.https://doi.org/10.1001/jama.2020.24243 Faust et al.(2022): Jeremy Samuel Faust, Benjamin Renton,Alexander Junxiang Chen,et al./// Uncoupling of all-cause excessmortality fromCOVID-19 casesin a highly vaccinated state/// The Lancet,CORRESPONDENCE| VOLUME 22,ISSUE 10, P1419-1420, OCTOBER2022. Published:August22, 2022DOI:https://doi.org/10.1016/S1473-3099(22)00547-3 Félix-Cardosoet al. (2020):J. Félix-Cardoso, H.Vasconcelos, P. Pereira Rodrigues, R. Cruz-Correia ///Excess mortality during COVID-19 in five European countries and a critique of mortality data analysis ///medRxiv2020.04.28.20083147;doi:https://doi.org/10.1101/2020.04.28.20083147| https://www.medrxiv.org/content/10.1101/2020.04.28.20083147v1(accessed 5 Aug 2023) Fortune (15 January 2021): LARS ERIK TARALDSEN, NAOMI KRESGE, AND BLOOMBERG /// Sick patients over 80 could be a COVID vaccine risk, Norwegian health officials warn: The country has conducted autopsies on 13 people who died shortly after receiving the first dose of the vaccine. /// Fortune (15 January 2021), https://fortune.com/2021/01/15/sick-elderly-covid-vaccine-risk-norway-warning/ – archived: https://archive.ph/LPhlt Fouillet et al. (2020): Fouillet Anne, Pontais Isabelle, Caserio-Schönemann Céline /// Excess all-cause mortality during the first wave of the COVID-19 epidemic in France, March to May 2020 /// Euro Surveill. 2020;25(34):pii=2001485. https://doi.org/10.2807/1560-7917.ES.2020.25.34.2001485 Fraiman et al. (2022): Joseph Fraiman, Juan Erviti, Mark Jones et al. /// Serious adverse events of special interest following mRNA COVID-19 vaccination in randomized trials in adults. /// Vaccine, Volume 40, Issue 40, 2022, Pages 5798-5805, ISSN 0264-410X, https://doi.org/10.1016/j.vaccine.2022.08.036 Gallo et al. (2021): Gallo, E., Prosepe, I., Lorenzoni, G. et al. /// Excess of all-cause mortality is only partially explained by COVID-19 in Veneto (Italy) during spring outbreak /// BMC Public Health 21, 797 (2021). https://doi.org/10.1186/s12889-021-10832-7 Gao et al. (2022): Gao, J., Lun, P., Ding, Y.Y. et al. /// COVID-19 Vaccination for Frail Older Adults in Singapore — Rapid Evidence Summary and Delphi Consensus Statements. /// J Frailty Aging 11, 236–241 (2022). https://doi.org/10.14283/jfa.2022.12 Ghaznavi et al. (2022): Cyrus Ghaznavi, Akifumi Eguchi, Yuta Tanoue et al. /// Pre- and post-COVID-19 all-cause mortality of Japanese citizens versus foreign residents living in Japan, 2015–2021 /// SSM – Population Health, Volume 18, 2022, 101114, ISSN 2352-8273. https://doi.org/10.1016/j.ssmph.2022.101114 Gill et al. (2022): James R. Gill, Randy Tashjian, Emily Duncanson /// Autopsy Histopathologic Cardiac Findings in 2 Adolescents Following the Second COVID-19 Vaccine Dose. /// Arch Pathol Lab Med 1 August 2022; 146 (8): 925–929. doi: https://doi.org/10.5858/arpa.2021-0435-SA Gobiņa et al. (2022): Gobiņa, I., Avotiņš, A., Kojalo, U. et al. /// Excess mortality associated with the COVID-19 pandemic in Latvia: a population-level analysis of all-cause and noncommunicable disease deaths in 2020. /// BMC Public Health 22, 1109 (2022). https://doi.org/10.1186/s12889-022-13491-4 Goldman et al. (2021): Goldman Serge, Bron Dominique, Tousseyn Thomas, Vierasu Irina, Dewispelaere Laurent, Heimann Pierre, Cogan Elie, Goldman Michel. /// Rapid Progression of Angioimmunoblastic T Cell Lymphoma Following BNT162b2 mRNA Vaccine Booster Shot: A Case Report. /// Frontiers in Medicine, vol. 8, 2021, DOI: 10.3389/fmed.2021.798095, https://www.frontiersin.org/articles/10.3389/fmed.2021.798095 Hasegawa and Nemoto (2016): Takehisa Hasegawa and Koji Nemoto /// Outbreaks in susceptible-infected-removed epidemics with multiple seeds /// Physical Review E 93, 032324 – Published 30 March 2016 /// https://doi.org/10.1103%2FPhysRevE.93.032324 Haugen (2023): Matz Haugen. /// Excess mortality compared to vaccination in the covid era /// self-published, 20 January 2023. https://electricgerms.substack.com/p/excess-mortality-compared-to-vaccination (accessed 10 August 2023) He et al. (2022): He G., Xiao J., Lin Z., et al. /// Excess mortality, rather than case fatality rate, is a superior indicator to assess the impact of COVID-19 pandemic. /// The Innovation 3(5), 100298. https://doi.org/10.1016/j.xinn.2022.100298 Henry et al. (2022): Henry, N.J., Elagali, A., Nguyen, M. et al. /// Variation in excess all-cause mortality by age, sex, and province during the first wave of the COVID-19 pandemic in Italy. /// Sci Rep 12, 1077 (2022). https://doi.org/10.1038/s41598-022-04993-7 Hickey and Rancourt (2022): Hickey, J. and Rancourt, D.G. /// Nature of the toxicity of the COVID-19 vaccines in the USA /// ResearchGate [Preprint] (9 February 2022). Available at: https://www.researchgate.net/publication/358489777_Nature_of_the_toxicity_of_the_COVID-19_vaccines_in_the_USA /// Archived at: https://archive.ph/LZpRj Hulscher et al. (2023): Hulscher, N.; Hodkinson, R.; Makis, W.; Malhotra, A.; McCullough, P. /// Autopsy Proven Fatal COVID-19 Vaccine-Induced Myocarditis. /// Preprints 2023, 2023071198. https://doi.org/10.20944/preprints202307.1198.v1 [Note: This critical review article was deplatformed from: https://ssrn.com/abstract=4496137 ] Ioannidis (2016): Ioannidis, J. P. A. /// Exposure-wide epidemiology: revisiting Bradford Hill. /// Statist. Med., 35: 2016, 1749– 1762. doi: 10.1002/sim.6825. https://doi.org/10.1002/sim.6825 Hasegawa and Nemoto (2016): Takehisa Hasegawa and Koji Nemoto /// Outbreaks in susceptible-infected-removed epidemics with multiple seeds /// Physical Review E 93, 032324 – Published 30 March 2016 /// https://doi.org/10.1103%2FPhysRevE.93.032324 Haugen (2023): Matz Haugen. /// Excess mortality compared to vaccination in the covid era /// self-published, 20 January 2023. https://electricgerms.substack.com/p/excess-mortality-compared-to-vaccination (accessed 10 August 2023) He et al. (2022): He G., Xiao J., Lin Z., et al. /// Excess mortality, rather than case fatality rate, is a superior indicator to assess the impact of COVID-19 pandemic. /// The Innovation 3(5), 100298. https://doi.org/10.1016/j.xinn.2022.100298 Henry et al. (2022): Henry, N.J., Elagali, A., Nguyen, M. et al. /// Variation in excess all-cause mortality by age, sex, and province during the first wave of the COVID-19 pandemic in Italy. /// Sci Rep 12, 1077 (2022). https://doi.org/10.1038/s41598-022-04993-7 Hickey and Rancourt (2022): Hickey, J. and Rancourt, D.G. /// Nature of the toxicity of the COVID-19 vaccines in the USA /// ResearchGate [Preprint] (9 February 2022). Available at: https://www.researchgate.net/publication/358489777_Nature_of_the_toxicity_of_the_COVID-19_vaccines_in_the_USA /// Archived at: https://archive.ph/LZpRj Hulscher et al. (2023): Hulscher, N.; Hodkinson, R.; Makis, W.; Malhotra, A.; McCullough, P. /// Autopsy Proven Fatal COVID-19 Vaccine-Induced Myocarditis. /// Preprints 2023, 2023071198. https://doi.org/10.20944/preprints202307.1198.v1 [Note: This critical review article was deplatformed from: https://ssrn.com/abstract=4496137 ] Ioannidis (2016): Ioannidis, J. P. A. /// Exposure-wide epidemiology: revisiting Bradford Hill. /// Statist. Med., 35: 2016, 1749– 1762. doi: 10.1002/sim.6825. https://doi.org/10.1002/sim.6825 Islam, N., Jdanov, D.A., et al. (2021) /// Effects of covid-19 pandemic on life expectancy and premature mortality in 2020: time series analysis in 37 countries /// BMJ, 375, p. e066768. https://doi.org/10.1136/bmj-2021-066768 Islam, N., Shkolnikov, V.M., et al. (2021) /// Excess deaths associated with covid-19 pandemic in 2020: age and sex disaggregated time series analysis in 29 high income countries /// BMJ, 373, p. n1137. https://doi.org/10.1136/bmj.n1137 Jacobson, S.H. and Jokela, J.A. (2021) /// Beyond COVID-19 deaths during the COVID-19 pandemic in the United States /// Health Care Management Science, 24(4), pp. 661–665. https://doi.org/10.1007/s10729-021-09570-4 Jdanov et al. (2021): Jdanov, D.A., Galarza, A.A., Shkolnikov, V.M. et al. /// The short-term mortality fluctuation data series, monitoring mortality shocks across time and space /// Scientific Data 8, 235 (2021). https://doi.org/10.1038/s41597-021-01019-1 | https://www.nature.com/articles/s41597-021-01019-1 Jeon et al. (2023): Jeon YH, Choi S, Park JH et al. /// Sudden Death Associated With Possible Flare-Ups of Multiple Sclerosis After COVID-19 Vaccination and Infection: A Case Report and Literature Review. /// J Korean Med Sci. 2023 Mar 13;38(10):e78. doi: 10.3346/jkms.2023.38.e78. PMID: 36918031; PMCID: PMC10010908. https://doi.org/10.3346%2Fjkms.2023.38.e78 Jha et al. (2022): Jha P, Deshmukh Y, Tumbe C et al. /// COVID mortality in India: National survey data and health facility deaths /// Science 375, 667–671, 11 February 2022 /// https://www.science.org/doi/10.1126/science.abm5154 Joffe, A.R. (2021) /// COVID-19: Rethinking the Lockdown Groupthink /// Frontiers in Public Health, 9. https://doi.org/10.3389/fpubh.2021.625778 Johnson and Rancourt (2022): Johnson, J.A. and Rancourt, D.G. /// Evaluating the Effect of Lockdowns On All-Cause Mortality During the COVID Era: Lockdowns Did Not Save Lives /// ResearchGate [preprint] (9 July 2022) (16 pages), http://dx.doi.org/10.13140/RG.2.2.34191.46242 | And published by Brownstone Institute (6 September 2022): https://brownstone.org/articles/lockdowns-did-not-save-lives/ Jones and Ponomarenko (2023): https://doi.org/10.20944/preprints202304.0248.v1 Jones, R.P.; Ponomarenko, A. /// Effect of Age, Sex, and COVID-19 Vaccination History on All-Cause Mortality: Unexpected Outcomes in a Complex Biological and Social System. /// Preprints 2023, 2023040248. Juul et al. (2022): Juul FE, Jodal HC, Barua I, et al. /// Mortality in Norway and Sweden during the COVID-19 pandemic. /// Scandinavian Journal of Public Health. 2022;50(1):38-45. doi:10.1177/14034948211047137. https://doi.org/10.1177/14034948211047137 Karlinsky, A. and Kobak, D. (2021) /// Tracking excess mortality across countries during the COVID-19 pandemic with the World Mortality Dataset /// eLife. Edited by M.P. Davenport et al., 10, p. e69336. https://doi.org/10.7554/eLife.69336 Kamin-Friedman and Davidovitch (2021): Kamin-Friedman, S., Davidovitch, N. /// Vaccine injury compensation: the Israeli case. /// Israel Journal of Health Policy Research, 10, 54 (2021). https://doi.org/10.1186/s13584-021-00490-w Kobak, D. (2021) /// Excess mortality reveals Covid’s true toll in Russia /// Significance (Oxford, England), 18(1), pp. 16–19. https://doi.org/10.1111/1740-9713.01486 Kontis, V. et al. (2020) /// Magnitude, demographics and dynamics of the effect of the first wave of the COVID-19 pandemic on all-cause mortality in 21 industrialized countries /// Nature Medicine, 26(12), pp. 1919–1928. https://doi.org/10.1038/s41591-020-1112-0 Kontis, V. et al. (2022) /// Lessons learned and lessons missed: impact of the coronavirus disease 2019 (COVID-19) pandemic on all-cause mortality in 40 industrialised countries and US states prior to mass vaccination [version 2; peer review: 2 approved] /// Latest Version Published: 15 Feb 2022, 6:279 https://doi.org/10.12688/wellcomeopenres.17253.2 Kontopantelis et al. (2021a) /// Excess deaths from COVID-19 and other causes by region, neighbourhood deprivation level and place of death during the first 30 weeks of the pandemic in England and Wales: A retrospective registry study /// The Lancet Regional Health – Europe, 7, p. 100144. https://doi.org/10.1016/j.lanepe.2021.100144 Kontopantelis et al. (2021b) /// Kontopantelis E, Mamas MA, Deanfield J, et al. /// Excess mortality in England and Wales during the first wave of the COVID-19 pandemic /// J Epidemiol Community Health 2021;75:213–223. https://jech.bmj.com/content/75/3/213 (accessed 5 Aug 2023) Kontopantelis et al. (2022) /// Excess years of life lost to COVID-19 and other causes of death by sex, neighbourhood deprivation, and region in England and Wales during 2020: A registry-based study /// PLOS Medicine, 19(2), p. e1003904. https://doi.org/10.1371/journal.pmed.1003904 Kuhbandner and Reitzner (2023): Christof Kuhbandner, Matthias Reitzner /// Excess mortality in Germany 2020-2022 /// Research Gate, 10 August 2022, DOI:10.13140/RG.2.2.27319.19365. http://dx.doi.org/10.13140/RG.2.2.27319.19365 | Cureus (May 23, 2023) 15(5): e39371. DOI 10.7759/cureus.39371. https://doi.org/10.7759/cureus.39371 Kung et al. (2021a): Kung S, Doppen M, Black M, et al. /// Underestimation of COVID-19 mortality during the pandemic /// ERJ Open Res 2021; 7: 00766-2020. https://doi.org/10.1183/23120541.00766-2020 Kung et al. (2021b): Kung S, Doppen M, Black M, et al. /// Reduced mortality in New Zealand during the COVID-19 pandemic /// The Lancet | CORRESPONDENCE | VOLUME 397, ISSUE 10268, P25, JANUARY 02, 2021. Published:December 14, 2020DOI: https://doi.org/10.1016/S0140-6736(20)32647-7 Kuvandik et al. (2021): Anıl Kuvandık, Ecenur Özcan, Simay Serin, Hülya Sungurtekin. /// Creutzfeldt-Jakob Disease After the COVID-19 Vaccination. /// Turk J Intensive Care, DOI: 10.4274/tybd.galenos.2021.91885. https://cms.galenos.com.tr/Uploads/Article_50671/TYBD-0-0.pdf Lambrou et al. (2022): Lambrou AS, Shirk P, Steele MK et al. /// Genomic Surveillance for SARS-CoV-2 Variants: Predominance of the Delta (B.1.617.2) and Omicron (B.1.1.529) Variants – United States, June 2021-January 2022. /// MMWR Morb Mortal Wkly Rep. 2022 Feb 11;71(6):206-211. doi: 10.15585/mmwr.mm7106a4, https://doi.org/10.15585%2Fmmwr.mm7106a4 Lee, W.-E. et al. (2022) /// Direct and indirect mortality impacts of the COVID-19 pandemic in the US, March 2020-April 2021 /// medRxiv: The Preprint Server for Health Sciences, p. 2022.02.10.22270721. https://doi.org/10.1101/2022.02.10.22270721 | https://www.medrxiv.org/content/10.1101/2022.02.10.22270721v1 (accessed on 5 Aug 2023) Leffler et al. (2022): Leffler CT, Lykins V JD, Das S, Yang E, Konda S. /// Preliminary Analysis of Excess Mortality in India During the COVID-19 Pandemic. /// The American Journal of Tropical Medicine and Hygiene. 2022;106(5):1507-1510. doi:10.4269/ajtmh.21-0864 . https://doi.org/10.4269/ajtmh.21-0864 Lewnard et al. (2022): Joseph A Lewnard, Ayesha Mahmud, Tejas Narayan et al. /// All-cause mortality during the COVID-19 pandemic in Chennai, India: an observational study /// The Lancet Infectious Diseases, Volume 22, Issue 4, 2022, Pages 463-472, ISSN 1473-3099, https://doi.org/10.1016/S1473-3099(21)00746-5 Liu et al. (2021): Liu J, Zhang L, Yan Y, Zhou Y, Yin P, Qi J et al. /// Excess mortality in Wuhan city and other parts of China during the three months of the covid-19 outbreak: findings from nationwide mortality registries /// BMJ 2021; 372:n415 doi:10.1136/bmj.n415. https://doi.org/10.1136/bmj.n415 Locatelli, I. and Rousson, V. (2021) /// A first analysis of excess mortality in Switzerland in 2020 /// PLOS ONE, 16(6), p. e0253505. https://doi.org/10.1371/journal.pone.0253505 Ma et al. (2022): Chunfeng Ma, Xin Li, Zebin Zhao et al. /// Understanding Dynamics of Pandemic Models to Support Predictions of COVID-19 Transmission: Parameter Sensitivity Analysis of SIR-Type Models /// IEEE Journal of Biomedical and Health Informatics, vol. 26, no. 6, pp. 2458-2468, June 2022, doi: 10.1109/JBHI.2022.3168825. https://doi.org/10.1109%2FJBHI.2022.3168825 Malhotra (2023): Aseem Malhotra /// How Pharmaceutical Overreach, Corruption and Health System Failures Birthed COVID /// Chapter 13 (pp. 166-177) in: Canary In a Covid World: How Propaganda and Censorship Changed Our (My) World, C.H. Klotz (Ed.), Canary House Publishing, 2023, ISBN: 978-1-7390525-3-9. Mannucci et al. (2020): Edoardo Mannucci, Besmir Nreu, Matteo Monami /// Factors associated with increased all-cause mortality during the COVID-19 pandemic in Italy /// International Journal of Infectious Diseases 98 (2020) 121–124. https://doi.org/10.1016/j.ijid.2020.06.077 Manu (2023): Manu, Peter MD. /// Fatal Myocarditis After COVID-19 Vaccination: Fourteen Autopsy-Confirmed Cases. /// American Journal of Therapeutics 30(3):p e259-e260, May/June 2023. | DOI: 10.1097/MJT.0000000000001631. https://journals.lww.com/americantherapeutics/Fulltext/2023/06000/Fatal_Myocarditis_After_COVID_19_Vaccination_.9.aspx (accessed 11 August 2023) Masselot et al. (2023): Pierre Masselot, Malcolm Mistry, Jacopo Vanoli et al. /// Excess mortality attributed to heat and cold: a health impact assessment study in 854 cities in Europe. /// Lancet Planet Health. 2023 Apr;7(4):e271-e281. doi: 10.1016/S2542-5196(23)00023-2. Epub 2023 Mar 16. PMID: 36934727. https://doi.org/10.1016/s2542-5196(23)00023-2 Matveeva and Shabalina (2023): Matveeva Olga, Shabalina Svetlana A. /// Comparison of vaccination and booster rates and their impact on excess mortality during the COVID-19 pandemic in European countries /// Frontiers in Immunology, vol.14, 2023, DOI: 10.3389/fimmu.2023.1151311, ISSN: 1664-3224. https://doi.org/10.3389/fimmu.2023.1151311 McGrail (2022): Kimberlyn McGrail /// Excess mortality, COVID-19 and health care systems in Canada /// CMAJ, May 2022, 194 (21) E741-E745; DOI: 10.1503/cmaj.220337. https://doi.org/10.1503/cmaj.220337 Miller et al. (2021): Sarah Miller, Laura R. Wherry, and Bhashkar Mazumder /// Estimated Mortality Increases During The COVID-19 Pandemic By Socioeconomic Status, Race, And Ethnicity /// Health Affairs 2021 40:8, 1252-1260. https://doi.org/10.1377/hlthaff.2021.00414 Mills et al. (2020): Mills, E.H.A., Møller, A.L., Gnesin, F. et al. /// National all-cause mortality during the COVID-19 pandemic: a Danish registry-based study /// Eur J Epidemiol 35, 1007–1019 (2020). https://doi.org/10.1007/s10654-020-00680-x Mörz (2022): Mörz, M. A /// Case Report: Multifocal Necrotizing Encephalitis and Myocarditis after BNT162b2 mRNA Vaccination against COVID-19. /// Vaccines 2022, 10, 1651. https://doi.org/10.3390/vaccines10101651 Mungwira et al. (2020): Mungwira RG, Guillard C, Saldaña A, Okabe N, Petousis-Harris H, Agbenu E, et al. /// Global landscape analysis of no-fault compensation programmes for vaccine injuries: A review and survey of implementing countries. /// PLoS ONE 15(5): e0233334. https://doi.org/10.1371/journal.pone.0233334 Murata et al. (2022): Murata K, Nakao N, Ishiuchi N et al. /// Four cases of cytokine storm after COVID-19 vaccination: Case report. /// Front. Immunol. 13:967226. doi: 10.3389/fimmu.2022.967226. https://doi.org/10.3389/fimmu.2022.967226 Neil et al. (2022): Martin Neil, Norman Fenton, Joel Smalley et al. /// Official mortality data for England suggest systematic miscategorisation of vaccine status and uncertain effectiveness of Covid-19 vaccination ///2022.Research Gate, 12 January 2022.DOI: 10.13140/RG.2.2.28055.09124. http://dx.doi.org/10.13140/RG.2.2.28055.09124 Neil and Fenton (2022):Marten Neil, Norman Fenton. ///The Devil’sAdvocate: An ExploratoryAnalysis of 2022 ExcessMortality-What is causing excess deaths: Covid, long-covid,lockdowns, healthcare or the vaccines?/// Where are the numbers? (substack), 14 December2022.https://wherearethenumbers.substack.com/p/the-devils-advocate-an-exploratory(accessed 8 August 2023). Neil and Fenton (2023):Marten Neil, Norman Fenton. ///The Very Best of Cheap Trick…..Howwidespread isthe (mal)practice of miscategorising vaccination status?/// Where are the numbers? (substack),29 July 2023. https://wherearethenumbers.substack.com/p/the-very-best-of-cheap-trick(accessed 10August 2023). Nørgaard etal. (2021):Nørgaard Sarah K., Vestergaard Lasse S., Nielsen Jenset al. /// Real-time monitoring shows substantial excess all-cause mortality during second wave of COVID-19 in Europe, Octoberto December 2020.///EuroSurveill.2021;26(2):pii=2002023.https://doi.org/10.2807/1560-7917.ES.2021.26.1.2002023 Nushida et al. (2023):HideyukiNushida, AsukaIto, Hiromitsu Kurataet al. /// A case offatalmulti-organ inflammationfollowing COVID-19 vaccination. ///Legal Medicine, Volume 63, 2023,102244, ISSN1344-6223,https://doi.org/10.1016/j.legalmed.2023.102244 Olson et al. (2020):New York City Department ofHealth and Mental Hygiene(DOHMH)COVID-19Response Team ///Preliminary Estimate of Excess Mortality During the COVID-19 Outbreak—New York City, March 11–May 2, 2020///MMWR Morb MortalWkly Rep(CDC)2020;69:603–605.DOI: http://dx.doi.org/10.15585/mmwr.mm6919e5 Onishi et al.(2023):NaoakiOnishi, Yuki Konishi,Toshiyuki Kanekoet al. /// Fulminantmyocarditis with complete atrioventricular block after mRNA COVID-19 vaccination: Acase report. /// Journal of Cardiology Cases, 2023,ISSN 1878-5409,https://doi.org/10.1016/j.jccase.2023.01.004 OWID(2023a):OurWorld In Data /// Coronavirus(COVID-19) Vaccinations/// https://ourworldindata.org/covid-vaccinations(accessed on 15 August 2023)| underlying data sources: Edouard Mathieu, Hannah Ritchie, LucasRodés-Guirao et al.(2020)-“CoronavirusPandemic (COVID-19)”. Published online at OurWorldInData.org.Retrieved from:’https://ourworldindata.org/coronavirus’ [Online Resource] OWID(2023b):OurWorld In Data ///Coronavirus (COVID-19) Vaccinations: Source information country by country/// https://ourworldindata.org/covid-vaccinations#source-information-country-by-country(accessed on 28 August 2023) | underlyingdata sources: Edouard Mathieu, Hannah Ritchie, Lucas Rodés-Guiraoet al.(2020)-“Coronavirus Pandemic (COVID-19)”. Published online at OurWorldInData.org. Retrieved from: ‘https://ourworldindata.org/coronavirus’ [Online Resource] OWID (2023c): Our World In Data /// Coronavirus (COVID-19) Vaccinations: Which vaccines have been administered in each country? /// https://ourworldindata.org/covid-vaccinations#which-vaccines-have-been-administered-in-each-country (accessed on 2 September 2023) | underlying data sources: Edouard Mathieu, Hannah Ritchie, Lucas Rodés-Guirao et al. (2020) – “Coronavirus Pandemic (COVID-19)”. Published online at OurWorldInData.org. Retrieved from: ‘https://ourworldindata.org/coronavirus’ [Online Resource] Paglino et al. (2023): Eugenio Paglino et al. /// Monthly excess mortality across counties in the United States during the COVID-19 pandemic, March 2020 to February 2022. /// Sci. Adv. 9,eadf9742(2023). DOI:10.1126/sciadv.adf9742. https://doi.org/10.1126/sciadv.adf9742 Pálinkás and Sándor (2022): Pálinkás, A.; Sándor, J. /// Effectiveness of COVID-19 Vaccination in Preventing All-Cause Mortality among Adults during the Third Wave of the Epidemic in Hungary: Nationwide Retrospective Cohort Study. /// Vaccines 2022, 10, 1009. https://doi.org/10.3390/vaccines10071009 Palmer et al. (2023): Michael Palmer et al. /// mRNA Vaccine Toxicity /// Publisher: D4CE.org | version 1.0 (July 28, 2023), pp. 204. | https://d4ce.org/mRNA-vaccine-toxicity/ (available as a free download) Panagiotou et al. (2021): Panagiotou OA, Kosar CM, White EM, et al. /// Risk Factors Associated With All-Cause 30-Day Mortality in Nursing Home Residents With COVID-19. /// JAMA Intern Med. 2021;181(4):439–448. doi:10.1001/jamainternmed.2020.7968. https://jamanetwork.com/journals/jama/fullarticle/10.1001/jamainternmed.2020.7968 Parham and Michael (2011): Parham, P. E. and Edwin Michael, E. /// Outbreak properties of epidemic models: The roles of temporal forcing and stochasticity on pathogen invasion dynamics /// Journal of Theoretical Biology, Volume 271, Issue 1, 2011, Pages 1-9, ISSN 0022-5193, https://doi.org/10.1016/j.jtbi.2010.11.015 Pezzullo et al. (2023): Angelo Maria Pezzullo, Cathrine Axfors, Despina G. Contopoulos-Ioannidis, Alexandre Apostolatos, John P.A. Ioannidis. /// Age-stratified infection fatality rate of COVID-19 in the non-elderly population. /// Environmental Research, Volume 216, Part 3, 2023, 114655, ISSN 0013-9351, https://doi.org/10.1016/j.envres.2022.114655. Phua et al. (2009): Dong Haur Phua, Chun Chi Lin, Ming-Ling Wu et al. /// Neonicotinoid insecticides: an emerging cause of acute pesticide poisoning /// Clinical Toxicology, 47:4, 336-341, DOI: 10.1080/15563650802644533, https://doi.org/10.1080/15563650802644533 Piccininni et al. (2020): Piccininni M, Rohmann J L, Foresti L, Lurani C, Kurth T. /// Use of all cause mortality to quantify the consequences of covid-19 in Nembro, Lombardy: descriptive study /// BMJ 2020; 369:m1835 doi:10.1136/bmj.m1835. https://doi.org/10.1136/bmj.m1835 Pilkington et al. (2021): Pilkington, H., Feuillet, T., Rican, S. et al. /// Spatial determinants of excess all-cause mortality during the first wave of the COVID-19 epidemic in France. /// BMC Public Health 21, 2157 (2021). https://doi.org/10.1186/s12889-021-12203-8 Polyakova et al. (2021): Maria Polyakova, Victoria Udalova, Geoffrey Kocks, Katie Genadek, Keith Finlay, and Amy N. Finkelstein /// Racial Disparities In Excess All-Cause Mortality During The Early COVID-19 Pandemic Varied Substantially Across States /// Health Affairs 2021 40:2, 307-316. https://doi.org/10.1377/hlthaff.2020.02142 Ramírez-Soto and Ortega-Cáceres (2022): Ramírez-Soto, M.C.; Ortega-Cáceres, G. /// Analysis of Excess All-Cause Mortality and COVID-19 Mortality in Peru: Observational Study. /// Trop. Med. Infect. Dis. 2022, 7, 44. https://doi.org/10.3390/tropicalmed7030044 Rancourt (2020): Rancourt, D.G. /// All-cause mortality during COVID-19 — No plague and a likely signature of mass homicide by government response /// ResearchGate, 2 June 2020. http://dx.doi.org/10.13140/RG.2.2.24350.77125 | Available at: https://archive.org/details/boe-expert-witness-denis-rancourt-nci-ce-nc – pp. 774-799. Rancourt et al. (2020): Rancourt, D.G., Baudin, M. and Mercier, J. (2020) /// Evaluation of the virulence of SARS-CoV-2 in France, from all-cause mortality 1946-2020 /// ResearchGate, 20 August 2020 [Preprint]. Available at: https://doi.org/10.13140/RG.2.2.16836.65920/1 Rancourt (2021): Rancourt, DG /// Do Face Masks Reduce COVID-19 Spread in Bangladesh? Are the Abaluck et al. Results Reliable? /// denisrancourt.ca (20 September 2021) /// https://denisrancourt.ca/entries.php?id=106 – archived: https://archive.ph/yHbWO – republished: https://www.globalresearch.ca/do-face-masks-reduce-covid-19-spread-bangladesh-abaluck-et-al-results-reliable/5756323?pdf=5756323 Rancourt (2022): Rancourt, DG /// Probable causal association between India’s extraordinary April-July 2021 excess-mortality event and the vaccine rollout /// Correlation Research in the Public Interest, 5 December 2022 /// https://correlation-canada.org/report-probable-causal-association-between-indias-extraordinary-april-july-2021-excess-mortality-event-and-the-vaccine-rollout/ Rancourt et al. (2021a): Rancourt, D.G., Baudin, M. and Mercier, J. /// Nature of the COVID-era public health disaster in the USA, from all-cause mortality and socio-geo-economic and climatic data. /// Research Gate (25 Ocbtober 2021) /// http://dx.doi.org/10.13140/RG.2.2.11570.32962 Rancourt et al. (2021b): Rancourt, D.G., Baudin, M. and Mercier, J. /// Analysis of all-cause mortality by week in Canada 2010-2021, by province, age and sex: There was no COVID-19 pandemic, and there is strong evidence ofresponse-caused deaths in the most elderly and in young males. /// Research Gate(6 August2021)/// http://dx.doi.org/10.13140/RG.2.2.14929.45921 Rancourt et al.(2022a):Rancourt, D.G., Baudin,M. and Mercier, J.///Probable causalassociation between Australia’s new regime of high all-cause mortalityand itsCOVID-19 vaccine rollout. /// Correlation Research in the Public Interest, 20December 2022///https://correlation-canada.org/report-probable-causal-association-between-australias-new-regime-of-high-all-cause-mortality-and-its-covid-19-vaccine-rollout/ Rancourt et al.(2022b):Rancourt, D.G., Baudin,M. and Mercier, J. /// COVID-Period MassVaccination Campaign and Public Health Disaster in the USA: Fromage/state-resolved all-cause mortalitybytime, age-resolved vaccine delivery by time, and socio-geo-economic data ///Research Gate(2 August 2022)///http://dx.doi.org/10.13140/RG.2.2.12688.28164/// Alsoavailable at:https://vixra.org/abs/2208.0023 Rancourt et al.(2022c):Rancourt, D.G., Baudin,M. and Mercier, J. ///Proof thatCanada’sCOVID-19 mortality statistics are incorrect. ///Correlation Research in the Public Interest, 5 October2022 ///https://correlation-canada.org/report-proof-that-canadas-covid-19-mortality-statistics-are-incorrect/ Rancourt (2023): Rancourt, Denis///Dr. Denis Rancourt Unveiling All-Cause Mortality: A Critical Analysis ofthe Pandemic Declarationand Vaccination Rollout― Testimony of DenisRancourtto the National Citizens Inquiry(Canada), Ottawa, 17 May 2023, https://rumble.com/v2ohtte-physicist-dr-denis-rancourt-presents-his-findings-on-all-cause-mortality-ot.html///DenisRancourtVirtualTestimony follow up to the National Citizens Inquiry(Canada),28 June2023,https://rumble.com/v2wpyqu-national-citizens-inquiry-denis-rancourt-virtual-testimony.html///NCI website:https://nationalcitizensinquiry.ca/ Rancourt etal. (2023):Rancourt, D.G., Baudin, M., Hickey, J.and Mercier, J. ///Age-stratified COVID-19 vaccine-dose fatality rate for Israel and Australia/// Correlation Research in the Public Interest, 9 February 2023///https://correlation-canada.org/report-age-stratified-covid-19-vaccine-dose-fatality-rate-for-israel-and-australia/ Razaket al. (2022):Fahad Razak, Saeha Shin,C. David Nayloret al./// Canada’s response tothe initial 2 years of theCOVID-19 pandemic: a comparison with peercountries/// CMAJ,2022June 27;194:E870-7. doi: 10.1503/cmaj.220316. https://doi.org/10.1503/cmaj.220316 React 19 (2022): React19./// 1250+ COVID Vaccine Publications and Case Reports: Collection of peerreviewed case reports and studiesciting adverse effects post COVID vaccination. /// 9 July 2022,https://react19.org/1250-covid-vaccine-reports/, archived here:https://archive.ph/T4hPV Redert (2022a): André Redert /// Short-term Vaccine Fatality Ratio of booster and 4th dose in The Netherlands /// Research Gate, October 2022, DOI:10.13140/RG.2.2.29841.30568. http://dx.doi.org/10.13140/RG.2.2.29841.30568 Redert (2022b): André Redert /// Covid-19 vaccinations and all-cause mortality -a long-term differential analysis among municipalities /// Research Gate, July 2022, DOI:10.13140/RG.2.2.33994.85447. http://dx.doi.org/10.13140/RG.2.2.33994.85447 Redet (2023): Redert, André. /// Causal effect of covid vaccination on mortality in Europe. /// Research Gate, 24 February 2023. https://www.researchgate.net/publication/368777703_Causal_effect_of_covid_vaccination_on_mortality_in_Europe (accessed 10 August 2023) Reuters (18 January 2021): REUTERS/Stephane Mahe /// Norway advises caution in use of Pfizer vaccine for the most frail /// Reuters (18 January 2021), https://www.reuters.com/business/healthcare-pharmaceuticals/norway-advises-caution-use-pfizer-vaccine-most-frail-2021-01-18/ – archived: https://archive.ph/Ze0Cv Rogers and Heard (2007): Jody J. Rogers & Kennon Heard /// Does age matter? Comparing case fatality rates for selected poisonings reported to U.S. poison centers /// Clinical Toxicology, 45:6, 705-708, DOI: 10.1080/15563650701517491, https://doi.org/10.1080/15563650701517491 Rose and McCullough (2021): Jessica Rose, Peter A. McCullough /// A Report on Myocarditis Adverse Events in the U.S. Vaccine Adverse Events Reporting System (VAERS) in Association with COVID-19 Injectable Biological Products, Current Problems in Cardiology (2021). /// doi: https://doi.org/10.1016/j.cpcardiol.2021.101011 | https://web.archive.org/web/20211007022704/https://www.sciencedirect.com/science/article/pii/S0146280621002267 (full paper archived) Rossen et al. (2021): Rossen LM, Ahmad FB, Anderson RN, et al. /// Disparities in Excess Mortality Associated with COVID-19 — United States, 2020. /// MMWR Morb Mortal Wkly Rep 2021;70:1114–1119. DOI: http://dx.doi.org/10.15585/mmwr.mm7033a2 Rossen et al. (2022): Rossen, L.M., Nørgaard, S.K., Sutton, P.D. et al. Excess all-cause mortality in the USA and Europe during the COVID-19 pandemic, 2020 and 2021. Sci Rep 12, 18559 (2022). https://doi.org/10.1038/s41598-022-21844-7 Safavi-Naini et al. (2022): Safavi-Naini, S.A.A., Farsi, Y., Alali, W.Q. et al. /// Excess all-cause mortality and COVID-19 reported fatality in Iran (April 2013–September 2021): age and sex disaggregated time series analysis. /// BMC Res Notes 15, 130 (2022). https://doi.org/10.1186/s13104-022-06018-y Sanmarchi, F. et al. (2021) /// Exploring the Gap Between Excess Mortality and COVID-19 Deaths in 67 Countries /// JAMA Network Open, 4(7), p. e2117359. https://doi.org/10.1001/jamanetworkopen.2021.17359 Sano et al. (2023): Sano H, Kase M, Aoyama Y, Sano S. /// A case of persistent, confluent maculopapular erythema following a COVID-19 mRNA vaccination is possibly associated with the intralesional spike protein expressed by vascular endothelial cells and eccrine glands in the deep dermis. /// J Dermatol. 2023 May 8. doi: 10.1111/1346-8138.16816. Epub ahead of print. PMID: 37154426. https://doi.org/10.1111/1346-8138.16816 Schellekens (2023): Philip Schellekens. /// Excess mortality and vaccination: How front-runners in the vaccination space compare across countries on excess mortality /// pandem-ic, updated August 10, 2023. https://pandem-ic.com/excess-mortality-and-vaccination/ (accessed 10 August 2023) Scherb and Hayashi (2023): Scherb H, Hayashi K. /// Annual All-Cause Mortality Rate in Germany and Japan (2005 to 2022) With Focus on The Covid-19 Pandemic: Hypotheses And Trend Analyses. /// Med Clin Sci. 2023; 5(2):1-7. https://journals.sciencexcel.com/index.php/mcs/article/view/411 (accessed 10 August 2023) Schneider et al. (2021): Schneider, J., Sottmann, L., Greinacher, A. et al. /// Postmortem investigation of fatalities following vaccination with COVID-19 vaccines. /// Int J Legal Med 135, 2335–2345 (2021). https://doi.org/10.1007/s00414-021-02706-9 Schöley et al. (2022): Schöley, J., Aburto, J.M., Kashnitsky, I. et al. /// Life expectancy changes since COVID-19. /// Nat Hum Behav 6, 1649–1659 (2022). https://doi.org/10.1038/s41562-022-01450-3 Schwab et al. (2023): Schwab, C., Domke, L.M., Hartmann, L. et al. /// Autopsy-based histopathological characterization of myocarditis after anti-SARS-CoV-2-vaccination. /// Clin Res Cardiol 112, 431–440 (2023).. https://doi.org/10.1007/s00392-022-02129-5 Sempé et al. (2021): Lucas Sempé, Peter Lloyd-Sherlock, Ramón Martínez, Shah Ebrahim, Martin McKee, Enrique Acosta /// Estimation of all-cause excess mortality by age-specific mortality patterns for countries with incomplete vital statistics: a population-based study of the case of Peru during the first wave of the COVID-19 pandemic /// The Lancet Regional Health – Americas, Volume 2, 2021, 100039, ISSN 2667-193X, https://doi.org/10.1016/j.lana.2021.100039 Sessa et al. (2021): Sessa, F.; Salerno, M.; Esposito, M.; Di Nunno, N.; Zamboni, P.; Pomara, C. /// Autopsy Findings and Causality Relationship between Death and COVID-19 Vaccination: A Systematic Review. /// J. Clin. Med. 2021, 10, 5876. https://doi.org/10.3390/jcm10245876 Shively et al. (2017): Rachel M. Shively, Robert S. Hoffman & Alex F. Manini /// Acute salicylate poisoning: risk factors for severe outcome /// Clinical Toxicology, 55:3, 175-180, DOI: 10.1080/15563650.2016.1271127, https://doi.org/10.1080/15563650.2016.1271127 Sinnathamby et al. (2020): Sinnathamby Mary A, Whitaker Heather, Coughlan Laura, Lopez Bernal Jamie, Ramsay Mary, Andrews Nick /// All-cause excess mortality observed by age group and regions in the first wave of the COVID-19 pandemic in England /// Euro Surveill. 2020;25(28):pii=2001239. https://doi.org/10.2807/1560-7917.ES.2020.25.28.2001239 Skidmore (2023): Skidmore, M. /// The role of social circle COVID-19 illness and vaccination experiences in COVID-19 vaccination decisions: an online survey of the United States population. /// BMC Infect Dis 23, 51 (2023). https://doi.org/10.1186/s12879-023-07998-3 Soneji et al. (2021): Soneji, S., Beltrán-Sánchez, H., Yang, J.W. et al. /// Population-level mortality burden from novel coronavirus (COVID-19) in Europe and North America. /// Genus 77, 7 (2021). https://doi.org/10.1186/s41118-021-00115-9 Šorli et al. (2023): Šorli AS, Makovec T, Krevel Z, Gorjup R /// Forgotten “Primum Non Nocere” and Increased Mortality after COVID-19 Vaccination. /// Qual Prim Care. 2023, 31.003. https://www.primescholars.com/articles/forgotten-primum-non-nocere-and-increased-mortality-after-covid19-vaccination-118655.html (accessed 10 August 2023) Stein et al. (2021): Stein, R.E., Corcoran, K.E., Colyer, C.J. et al. /// Closed but Not Protected: Excess Deaths Among the Amish and Mennonites During the COVID-19 Pandemic. /// J Relig Health 60, 3230–3244 (2021). https://doi.org/10.1007/s10943-021-01307-5 Stokes et al. (2021): Stokes AC, Lundberg DJ, Elo IT, Hempstead K, Bor J, Preston SH /// COVID-19 and excess mortality in the United States: A county-level analysis. /// PLoS Med 18(5): e1003571. https://doi.org/10.1371/journal.pmed.1003571 Strehler and Mildvan (1960): STREHLER BL, MILDVAN AS. /// General theory of mortality and aging. /// Science. 1960 Jul 1;132(3418):14-21. doi: 10.1126/science.132.3418.14. PMID: 13835176. https://doi.org/10.1126/science.132.3418.14 Suzuki et al. (2022): Hideto Suzuki, Ayako Ro, Aya Takada, Kazuyuki Saito, Kino Hayashi. /// Autopsy findings of post-COVID-19 vaccination deaths in Tokyo Metropolis, Japan, 2021. /// Legal Medicine, Volume 59, 2022, 102134, ISSN 1344-6223, https://doi.org/10.1016/j.legalmed.2022.102134 Sy (2022): Wilson Sy /// Mortality risk of COVID-19 injections: evidence from New South Wales and England /// Academia. https://www.academia.edu/83924771/Mortality_risk_of_COVID_19_injections_evidence_from_New_South_Wales_and_England (accessed 10 August 2023) Tadbiri et al. (2020): Tadbiri H, Moradi-Lakeh M, Naghavi M. /// All-cause excess mortality and COVID-19-related deaths in Iran /// Med J Islam Repub Iran. 2020 (15 Jul);34:80. https://doi.org/10.34171/mjiri.34.80 | https://www.ncbi.nlm.nih.gov/pmc/articles/PMC7711045/ (accessed 6 Aug 2023). Takahashi et al. (2022): Motonori Takahashi, Takeshi Kondo, Gentaro Yamasaki et al. /// An autopsy case report of aortic dissection complicated with histiolymphocytic pericarditis and aortic inflammation after mRNA COVID-19 vaccination, /// Legal Medicine, Volume 59, 2022, 102154, ISSN 1344-6223. https://doi.org/10.1016/j.legalmed.2022.102154 Tan et al. (2022): Lii Jye Tan, Cai Ping Koh, Shau Kong Lai, Woon Cheng Poh, Mohammad Shafie Othman, Huzlinda Hussin. /// A systemic review and recommendation for an autopsy approach to death followed the COVID 19 vaccination. /// Forensic Science International, Volume 340, 2022, 111469, ISSN 0379-0738, https://doi.org/10.1016/j.forsciint.2022.111469. The Japan Times (26 July 2022): Japan grants first payment for death related to COVID vaccination. /// https://www.japantimes.co.jp/news/2022/07/26/national/science-health/japan-first-covid-19-vaccine-compensation/ – archived here: https://archive.ph/OfUhm Thoma and Declercq (2022): Thoma ME, Declercq ER. /// All-Cause Maternal Mortality in the US Before vs During the COVID-19 Pandemic. /// JAMA Netw Open. 2022; 5(6): e2219133. doi:10.1001/jamanetworkopen.2022.19133. https://doi.org/10.1001%2Fjamanetworkopen.2022.19133 Turni and Lefringhausen (2022): Conny Turni and Astrid Lefringhausen /// COVID-19 vaccines – An Australian Review. /// Journal of Clinical & Experimental Immunology. 7(3):491-508. https://www.opastpublishers.com/open-access-articles/covid19-vaccinesan-australian-review.pdf United Nations (2023): UN, Department of Economic and Social Affairs, Population Division, World Population Prospects 2022, Probabilistic Projections (PPP scenarios) download (file: “UN_PPP2022_Output_PopTot.xlsx”), downloaded on 2 September 2023, https://population.un.org/wpp/Download/ Veronese et al. (2021): Nicola Veronese, Mirko Petrovic, Athanase Benetos et al. /// Underrepresentation of older adults in clinical trials on COVID-19 vaccines: A systematic review. /// Ageing Research Reviews, Volume 71, 2021, 101455, ISSN 1568-1637, https://doi.org/10.1016/j.arr.2021.101455. Vestergaard et al. (2020): Vestergaard Lasse S, Nielsen Jens, Richter Lukas et al. /// Excess all-cause mortality during the COVID-19 pandemic in Europe – preliminary pooled estimates from the EuroMOMO network, March to April 2020 /// Euro Surveill. 2020;25(26):pii=2001214. https://doi.org/10.2807/1560-7917.ES.2020.25.26.2001214 Vila-Corcoles et al. (2021): Vila-Corcoles, A., Satue-Gracia, E., Vila-Rovira, A. et al. /// COVID19-related and all-cause mortality risk among middle-aged and older adults across the first epidemic wave of SARS-COV-2 infection: a population-based cohortstudy in Southern Catalonia, Spain, March–June 2020./// BMC Public Health21, 1795 (2021).https://doi.org/10.1186/s12889-021-11879-2 Villani, L. et al.(2020) ///Comparison of Deaths Ratesfor COVID-19 across Europe Duringthe FirstWave of the COVID-19 Pandemic ///Frontiers in Public Health, 8.https://doi.org/10.3389/fpubh.2020.620416 Wang, H. et al.(2022) ///Estimating excessmortality due to the COVID-19 pandemic: asystematic analysis of COVID-19-related mortality,2020–21 ///The Lancet, 399(10334), pp. 1513–1536.https://doi.org/10.1016/S0140-6736(21)02796-3 Wiberg et al. (1970):G.Stuart Wiberg, H.LocksleyTrenholm, Blake B. Coldwell ///Increasedethanol toxicity in old rats: Changes in LD50, in vivo and in vitro metabolism, and liveralcoholdehydrogenase activity ///Toxicology and Applied Pharmacology,Volume 16, Issue3,1970,Pages 718-727, ISSN0041-008X,https://doi.org/10.1016/0041-008X(70)90077-3 Wilcoxet al.(2021):Wilcox CR, Islam N, Dambha-Miller H. /// Associationbetween influenza vaccination and hospitalisationor all-cause mortality in people with COVID-19:a retrospective cohort study. ///BMJOpen Resp Res, 2021;8:e000857. doi:10.1136/bmjresp-2020-000857. http://dx.doi.org/10.1136/bmjresp-2020-000857 Wise (2022):Wise J.///Covid-19: UK makesfirst payments to compensate injury or death fromvaccines. ///BMJ2022; 377:o1565 doi:10.1136/bmj.o1565. https://www.bmj.com/content/377/bmj.o1565 Wong et al.(2023): Hui-Lee Wong, Ellen Tworkoski, Cindy Ke Zhouet al./// Surveillance ofCOVID-19 vaccine safety among elderly persons aged 65years and older.///Vaccine, Volume41,Issue 2, 2023, Pages 532-539, ISSN0264-410X,https://doi.org/10.1016/j.vaccine.2022.11.069. Wood et al. (2020):NicholasWood, Kristine Macartney, Julie Leask, Peter McIntyre. ///Australia needs a vaccine injury compensation scheme: Upcoming COVID-19 vaccines make itsintroduction urgent. /// Australian Journal ofGeneral Practice(AGJP), doi: 10.31128/AJGP-COVID-36. https://doi.org/10.31128/ajgp-covid-36 Woolf, S.H. et al. (2021) ///Excess DeathsFrom COVID-19 and Other Causes in the US, March 1, 2020,to January 2, 2021 ///JAMA2021;325(17):1786–1789.doi:10.1001/jama.2021.5199.https://doi.org/10.1001/jama.2021.5199 Woolf, S.H., Masters, R.K. and Aron, L.Y.(2021)///Effect of the covid-19 pandemic in 2020 on life expectancy across populations in the USA and other high income countries: simulationsofprovisional mortality data ///BMJ, 373,p. n1343.https://doi.org/10.1136/bmj.n1343 Woolf et al. (2023):Woolf SH,Wolf ER, Rivara FP.///The New Crisis ofIncreasing All-Cause Mortality in US Children and Adolescents./// JAMA. 2023;329(12):975–976.doi:10.1001/jama.2023.3517. https://doi.org/10.1001/jama.2023.3517 Worp et al.(2023):Worp, N. et al. ///Towards the development of a SARS-CoV-2 variant risk assessment tool: expert consultation on the assessment of scientific evidence on emerging variants /// Lancet Microbe, Published: August 25, 2023, DOI: https://doi.org/10.1016/S2666-5247(23)00179-9 Yeo et al. (2022): Audrey YEO, Benjamin KUEK, Mandy LAU et al. /// Post COVID-19 vaccine deaths – Singapore’s early experience, /// Forensic Science International, Volume 332, 2022, 111199, ISSN 0379-0738, https://doi.org/10.1016/j.forsciint.2022.111199 Yorifuji et al. (2021): Takashi Yorifuji, Naomi Matsumoto, Soshi Takao /// Excess All-Cause Mortality During the COVID-19 Outbreak in Japan /// Journal of Epidemiology, 2021, Volume 31, Issue 1, Pages 90-92, Released on J-STAGE January 05, 2021, Advance online publication October 31, 2020, Online ISSN 1349-9092, Print ISSN 0917-5040, https://doi.org/10.2188/jea.JE20200492, https://www.jstage.jst.go.jp/article/jea/31/1/31_JE20200492/_article/-char/en Yoshimura et al. (2022): Yukihiro Yoshimura, Hiroaki Sasaki, Nobuyuki Miyata et al. /// An autopsy case of COVID-19-like acute respiratory distress syndrome after mRNA-1273 SARS-CoV-2 vaccination /// International Journal of Infectious Diseases 121 (2022) 98–101, https://doi.org/10.1016/j.ijid.2022.04.057 AppendixAppendix A: Sources of Mortality and Vaccination DataTable 4 describes the data and the sources of the data used in this work: All-cause mortality (ACM) and COVID-19 vaccine administration, for the 17 countries. Table 4: Appendix A – Type of data and sources of data
Notes for Table 4: 1 Single year of age available. The data for the yearly ages are summed to create data for the specific age groups used in this study. 2 Five categories: Dose 1, Dose 2, Dose 3, Dose 4, Unique dose 3 Six doses: Dose 1, Dose 2, Dose 3, Dose 4, Dose 5, Dose 6. There was no data for a dose 7; and we did not use dose 8 and dose 9 data, which consisted of small numbers. 4 Four age groups: 0-29, 30-59, 60-79, 80+ 5 Five categories: Dose 1, Dose 2, Dose 3 (referred to as “First Boosters” in the source data), Dose 4 (referred to as “Second Boosters” in the source data), Third primary dose 6 The vaccination data was originally downloaded on 24 February 2023 (Health NZ, 2023), which we verified to be essentially exactly the same as that more recently downloaded (14 September 2023, Stats NZ, 2023b).
We use a sum of days to generate ACM by week (ACM/w), similarly for vaccination data. The vaccination data from OWID (2023) is of two types:
In Figure 2, in Figure 4, in Figure 6 and in Figure 21, ACM data is from WMD (2023) and vaccination data is from OWID (2023). In Figure 5, in Figure 7, in Figure 22 and in Figure 23, ACM data is from WMD (2023). In Figure 11, ACM data is from DEIS (2023) and vaccination data is from MinCiencia (2023). In Figure 12 and in Figure 13, ACM data is from DEIS (2023). In Figure 14, ACM data is from MINSA (2023a) and vaccination data is from MINSA (2023b). In Figure 15 and in Figure 16, ACM data is from MINSA (2023a). In Figure 18, ACM data is from Stats NZ (2023a) and vaccination data is from Stats NZ (2023b). In Figure 19 and in Figure 20, ACM data is from Stats NZ (2023a).
References of Appendix A DEIS (2023): Departamento de Estadísticas e Información de Salud – Ministerio de Salud – Gobierno de Chile /// Datos abiertos /// Files “Defunciones por Causa 1990 – 2019 CIFRAS OFICIALES” and “Defunciones por Causa 2020 – 2023 CIFRAS PRELIMINARES (Actualización semanal)” /// accessed 23 March 2023 https://deis.minsal.cl/#datosabiertos Health NZ (2023): Te Whatu Ora /// COVID-19 vaccine data /// accessed 24 February 2023 https://www.tewhatuora.govt.nz/our-health-system/data-and-statistics/covid-vaccine-data#by-day MinCiencia (2023): Ministerio de Ciencia (“Datos obtenidos desde el Ministerio de Ciencia y producidos por el Ministerio de Salud”) /// Datos-COVID19 /// Data Product 78 – Avance por sexo y edad en Campaña de Vacunación COVID-19: Este producto da cuenta del avance en la campaña de vacunación contra Sars-Cov-2 por edad (en años) y sexo. /// accessed 31 March 2023 https://github.com/MinCiencia/Datos-COVID19 https://github.com/MinCiencia/Datos-COVID19/tree/master/output/producto78 MINSA (2023a): Ministerio de Salud – Gobierno de Perú /// Plataforma Nacional de Datos Abiertos /// SINADEF: Certificado Defunciones /// File “SINADEF – Defunciones” /// accessed 27 July 2023 https://www.datosabiertos.gob.pe/dataset/sinadef-certificado-defunciones MINSA (2023b): Ministerio de Salud – Gobierno de Perú /// Plataforma Nacional de Datos Abiertos /// Data Completa de Vacunación COVID-19 – [Ministerio de Salud ] /// File “VACUNAS_COVID” /// accessed 27 July 2023 https://www.datosabiertos.gob.pe/dataset/vacunaci%C3%B3n-contra-covid-19-ministerio-de-salud-minsa/resource/db673c08-4812-4844-ae7f OWID (2023): Our World In Data /// Coronavirus (COVID-19) Vaccinations /// accessed 5 August 2023 https://ourworldindata.org/covid-vaccinations Stats NZ (2023a): Stats NZ Tatauranga Aotearoa /// COVID-19 data portal /// Health – Total deaths (all causes) − Weekly deaths by age /// accessed 24 February 2023 https://www.stats.govt.nz/experimental/covid-19-data-portal Stats NZ (2023b): Stats NZ Tatauranga Aotearoa /// COVID-19 data portal /// Health – COVID-19 vaccinations − COVID-19 vaccines administered – Daily total /// accessed 14 September 2023 https://www.stats.govt.nz/experimental/covid-19-data-portal WMD (2023): World Mortality Dataset /// International data on all-cause mortality /// accessed 3 August 2023 https://github.com/akarlinsky/world_mortality/blob/main/world_mortality.csv — The World Mortality Dataset is the work of Karlinsky & Kobak 2021, Tracking excess mortality across countries during the COVID-19 pandemic with the World Mortality Dataset, eLife https://doi.org/10.7554/eLife.69336
Appendix B: Examples of All-cause Mortality and Vaccination DataThe following panels show ACM by time (week or month, as seen on the graphs) (blue, left scale), and vaccine administration (all dose numbers) by week (orange, right scale), 2015-2023, for the 17 countries in this study, as labelled (Argentina, Australia, Bolivia, Brazil, Chile, Colombia, Ecuador, Malaysia, New Zealand, Paraguay, Peru, Philippines, Singapore, South Africa, Suriname, Thailand, and Uruguay). The thin vertical grey line, in each panel, indicates the date (11 March 2020) at which a pandemic was declared by the World Health Organization (WHO).
Figure 21: Appendix B – Examples of all-ages all-cause mortality (blue) and all-ages all-doses vaccine-administration (orange) data, for the 17 countries in this study (as labelled). The vertical grey line indicates the 11 March 2020 WHO declaration of a pandemic. The data sources are specified in Appendix A.
Appendix C: Technical and Specific Information for Applications of the Methods to the DataTable 5 provides the parameters used in applying the method described in “Historical-trend baseline for a period (or peak) of mortality” (Method 1, see Methods) to the data. In this method, one calculates the trend-lines fitted (straight lines fitted by least squares minimization) to ACM integrated over the periods of equal duration as the period of interest (the vaccination period or a specific-rollout period). The said trend lines are used to calculate the baseline integrated mortality in the periods of interest, in order to obtain the excess ACM of the periods of interest. All vaccine dose counting is on the same time interval as the integration interval for ACM in the period of interest. The same integration windows (start date to end date, by week or by month, inclusive) have been used for Method 2, for the cases where Method 2 has also been applied. Table 5: Appendix C – Parameters used to apply the trend-line method (Method 1) to the data
† The “Booster” period of interest refers to the time period framing the nominal January-February 2022 peak in ACM, in the data for all ages. * Format is the following: YEAR-WEEK or YEAR-MONTH. For example:
The definition of the week number, throughout the paper, is as given by ABS (2022): “The week number is based on the ISO (International Organization for Standardisation) week date system. In this system, weeks are defined as seven-day periods which start on a Monday. Week 1 of any given year is the week which starts on the Monday closest to 1 January, and for which the majority of its days fall in January (i.e. four days or more). Week 1 therefore always contains the 4th of January and always contains the first Thursday of the year. Using the ISO structure, some years (e.g. 2015 and 2020) contain 53 weeks.” + From the integration point indicated in the table, included, moving backwards. The last integration point (the integration point of interest) is 0. For example:
This applies to the method using several integration points from the historic period (Method 1). Chile (all ages) and Peru (all ages) data were insufficient to apply Method 1.
References of Appendix C ABS (2022): Australian Bureau of Statistics /// Provisional Mortality Statistics /// files “Provisional Mortality Statistics, Weekly Dashboard, Jan – Sep 2022” and “Deaths by week of occurrence, 2015-21” /// accessed 23 January 2023 https://www.abs.gov.au/statistics/health/causes-death/provisional-mortality-statistics/latest-release
Appendix D: Single-point Method Quantification of the Excess Mortality in the COVID PeriodThe following Figure 22 illustrates the application of our “Special case of a single historic integrated point” method (Method 2) to quantify the excess mortality in the nominally entire Covid period, from 11 March 2020 when a pandemic was declared to a practical end date taken to be the same as the end date of the nominal vaccination period (which depends on mortality and vaccination data availability), for the 17 countries in this study. The bounds of integration for the periods for each country are specified in Appendix C: Technical and specific information for applications of the methods to the data. Here, as per the legend, the Covid period is in orange (both its ACM by time and its integration point), the single historic reference period used is in green (both its ACM by time and its integration point), the best-line fit (least squares fit) of the historic ACM by time is in red, and the extrapolated predicted value of the integration for the Covid period is also in red, with its error bar. The weeks or months are counted consecutively in sequence using a time index, where week number 1 is week-1 of 2015, and month number 1 is month-1 (January) of 2015. Week-1 for 2015 contains the dates 29 December 2014 through 4 January 2015. The thin vertical grey line, in each panel, indicates the date (11 March 2020) at which a pandemic was declared by the World Health Organization (WHO).
Figure 22: Appendix D – Single historic point method (Method 2) for excess ACM in the Covid periods of the 17 countries in this study. Covid period (orange), single-point historic reference period (green), best-line fit (red). The time index is the week or month number from start of 2015. The 11 March 2020 pandemic declaration date is shown by a vertical grey line. The data sources are specified in Appendix A.
Appendix E: Single-point Method Quantification of the Excess Mortality in the Vaccination PeriodThe following Figure 23 illustrates the application of our “Special case of a single historic integrated point” method (Method 2) to the same limits of integration, for the vaccination period, as for Method 1 (historic trend method, shown in Figure 6 and Figure 7), for the 17 countries in this study. The limits of integration are specified in Appendix C. Here, as per the legend, the vaccination period is in orange (both its ACM by time and its integration point), the single historic reference period used is in green (both its ACM by time and its integration point), the best-line fit (least squares fit) of the historic ACM by time is in red, and the extrapolated predicted value of the integration for the vaccination period is also in red, with its error bar. The weeks or months are counted in sequence using a time index, where week or month number 1 is the week or month containing 1 January 2015. Week-1 for 2015 contains the dates 29 December 2014 through 4 January 2015. The thin vertical grey line, in each panel, indicates the date (11 March 2020) at which a pandemic was declared by the World Health Organization (WHO).
Figure 23: Appendix E – Single historic point method for excess ACM (Method 2) in the vaccination periods of the 17 countries in this study. Vaccination period (orange), single-point historic reference period (green), best-line fit (red). The time index is the week or month number from start of 2015. The 11 March 2020 pandemic declaration date is shown by a vertical grey line. The data sources are specified in Appendix A.
Disclaimer: The contents of this article are of sole responsibility of the author(s). The Centre for Research on Globalization will not be responsible for any inaccurate or incorrect statement in this article.
|
|
Copyright © Prof Denis Rancourt, Dr. Marine Baudin, Dr. Joseph Hickey, and Dr. Jérémie Mercier, Global Research, 2024
|