


All Global Research articles can be read in 51 languages by activating the “Translate Website” drop down menu on the top banner of our home page (Desktop version).
To receive Global Research’s Daily Newsletter (selected articles), click here.
Follow us on Instagram and Twitter and subscribe to our Telegram Channel. Feel free to repost and share widely Global Research articles.
***
“Baby, it’s Cold Outside” is a song from the 1950s where, in contrapuntal verses, a woman explains why she must leave (“I really can’t stay”) and a man counters with a reason she should stay (“But, baby, it’s cold outside”). In light of the disruption in the global trade in oil and natural gas ensuing from the conflict in Ukraine, the last line of the song (“At least there will be plenty implied / If you got pneumonia and died”) might be a premonition of what’s to come this winter. What would be implied today is that some country or group of countries should be held accountable, should millions in Western Europe or the United States or both freeze to death this winter for lack of ability to heat their homes.
Such a dire situation is widely predicted as Russia has been reducing the amount of natural gas supplied to many NATO member countries. Because natural gas is the primary fuel used to heat homes (either directly or through gas-fired electric power plants), we don’t have to wait till winter to gauge how likely the prediction is to come true. This precognition is made possible because of the way natural gas is produced, stored, traded, and consumed.
The demand for natural gas varies greatly over the course of a year, with peak demand coming in the colder months. For instance, in the United States consumption of natural gas in the winter is around 150 bcf (billion cubic feet) per day but less than 100 bcf per day in summer. For technical reasons, the supply of natural gas is more or less constant throughout the year, currently about 100 bcf per day in the US.
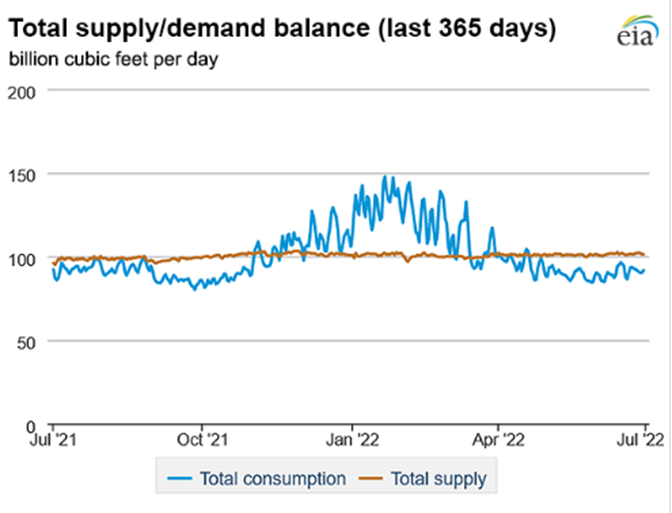
Source: US Energy Information Administration
To handle the seasonal variation in the demand for natural gas, the industry stores excess gas in the warmer months, then taps the stored gas to meet the greater demand in winter. Natural gas cannot be stored in tanks like oil because of its diffuse, i.e., gaseous, nature (the tanks would need to be a degree of magnitude larger than those used to store oil). So, what the industry does is inject some of the gas they just extracted back underground during summer (using depleted fields as storage tanks) and taps the reserved gas as needed in winter.
The issue of volume does not arise with gas transported by pipeline, as the gas is pumped in its diffuse state, but it does in the case of gas transported by ship. So, for maritime transport, natural gas is converted to a liquid by lowering its temperature to -260° Fahrenheit (The volume of natural gas in its liquid state is about 600 times smaller than its volume in its gaseous state). The liquified natural gas (LNG) is converted back into a gas in regasification terminals at the tankers’ destinations.
Transport by ship is much more expensive than transport by pipeline. Hence, gas from Russia is sent to Germany through the infamous Nord Stream pipelines, not shipped across the Baltic Sea. If Europeans have to depend on LNG shipped from the United States or the Middle East this winter, it will cost them a lot more to heat their homes (Prior to the hostilities in Ukraine, Russian gas delivered by pipeline was about 40% cheaper for Europeans than LNG shipped from the United States).
More fundamental than price as to whether we or the Europeans will be freezing this winter is supply. Russia has curtailed deliveries of natural gas to several European countries and more curtailments are likely to follow if hostilities continue. The United States’ NATO allies are depending on the US to make up for any shortfalls, but is that possible? Only if the US increases production or cuts domestic consumption (so as to have more gas available for export). As to increasing production, the price natural gas is traded at on the global market has risen from around $4 last year to over $8 today. This should motivate our drillers to bring marginally profitable fields into production, though it’s unlikely that can be done in time to ameliorate any shortage this winter (Even if we had more LNG to send to Europe, the amount we could provide is constrained by a lack of enough regasification terminals there). Reducing domestic consumption is fraught with the danger of sociopolitical turmoil (look at the chaos resulting from airlines reducing their flight schedules, which may have more to do with an unstated goal of reducing domestic consumption of jet fuel than a lack of pilots).
The interplay amongst the various factors which determine the provisioning of natural gas to consumers is too complex to go into here (even if I understood it!), but I do believe there is a simple, indicative metric which lies at the nexus of all these factors. This metric is the rate at which underground storage of natural gas is being replenished during the low demand season. Here’s a chart showing the amount of natural gas (in bcf) in underground storage in the United States over the last 3 1/2 years:
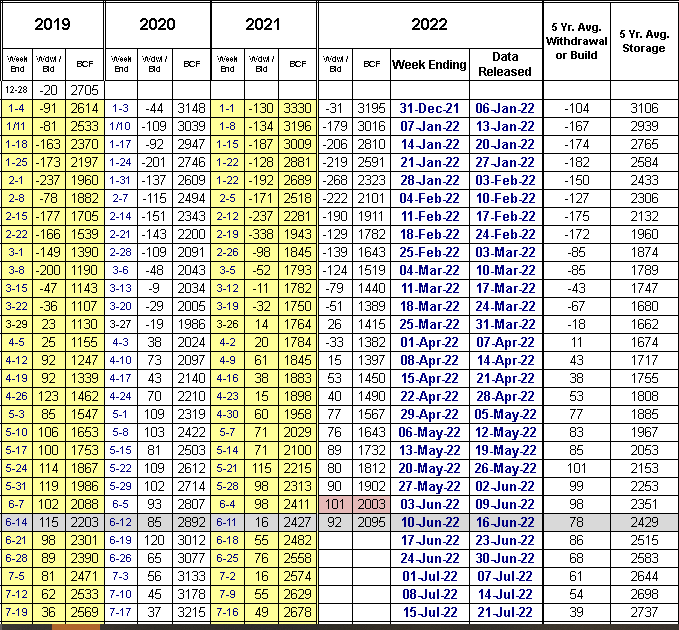
As can be seen, underground storage went from being depleted to being replenished around April 1st this year, which is normal. However, the rate of replenishment is slower than all other years (e.g., 2095 bcf in the latest week, versus 2203 bcf in 2019). If the growth in stored gas is slower than normal, it means either production is not growing apace with consumption or domestic supplies are being diverted for export.
In 2014 the amount of gas in storage hit a low of 822 bcf (in March), which caused a number of public utilities to shutter some of their power plants for lack of fuel. One electric company executive warned that we had dodged “not a bullet, but a cannonball” that year. So, keep an eye on how fast underground storage is being refilled in the coming months here. If it’s significantly slower than the 5-year average listed on the right of the chart (2429 bcf for the latest week), then bundle up, baby, because it’s going to be cold outside—and inside, too—come winter.
Below is a chart of US exports of natural gas last year and for the first three months of this year (Source: US Energy Information Administration).
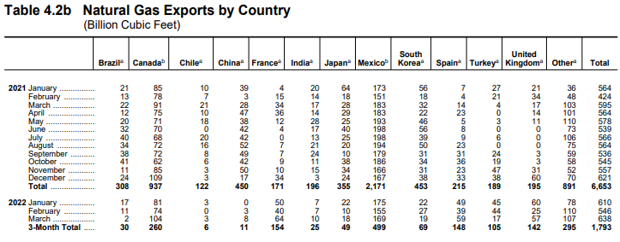
Some things of note are:
(1) The increase in our exports to NATO allies (France, Spain, Turkey, UK) this year, from less than 800 bcf/yr to 2200 bcf/yr (on a projected annualized basis). Note that the increase in our exports to these countries began before hostilities in Ukraine began on Feb. 24th (compare Jan 2021 to Jan 2022: France – 4 bcf vs. 50 bcf, Spain – 7 bcf vs. 49 bcf, etc.).
(2) Exports to Brazil, Chile, India, Japan, and South Korea have dropped over the same time period, from almost 2000 bcf to 800 bcf (on a projected annualized basis). Again, the decrease began before Russia invaded Ukraine (compare Jan 2021 to Jan 2022: especially China – 39 bcf vs. 0 bcf, Japan – 64 bcf vs. 22 bcf, South Korea – 56 bcf vs. 22 bcf). To what country are these countries turning to to make up the shortfall (Russia?).
(3) Total gas exports from the US have increased from 6653 bcf in 2021 to over 7000 bcf this year (projected), while production has remained constant at around 41,000 bcf/yr and withdrawals from underground storage have increased from 1547 bcf in the first three months of 2021 to 1816 bcf in the same period this year (see this), which hints at increased pressure on our natural gas supply.
An interesting graph from Bloomberg on the price of natural gas around the world:
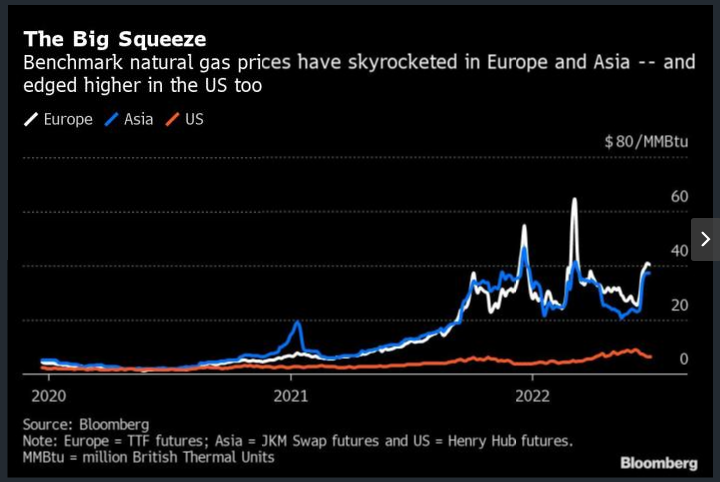
Note that price had risen sharply even before Russia invaded Ukraine, raising the question “Which came first?”- the Russian gas cut-offs to Europe or a price rise which led the NATO countries to feel it was time for a showdown with Russia and so they provoked one?
*
Note to readers: Please click the share buttons above or below. Follow us on Instagram and Twitter and subscribe to our Telegram Channel. Feel free to repost and share widely Global Research articles.
This article was originally published on Ken’s Blog.
Ken Meyercord is a retired computer type living in Reston, Virginia, where he fills his ample spare time with taking fitness classes at the Y; hiking, biking, and kayaking the USA; and maintaining a blog (kiaskblog.wordpress.com) for which he has cobbled together enough tall-tales, iconoclastic views, and misinformation to generate over 80 postings. Ken has self-published four books: a treatise on economic theory, “The Ethic of Zero Growth”; a memoir of the Vietnam War years, “Draft-Dodging Odyssey” (under the penname “Ken Kiask”); a eulogy to his starry-eyed, star-crossed son, “At the Forest’s Edge” (under the son’s name: Khaldun Meyercord); and a course teaching a simplified version of English, “Ezenglish” (all available online wherever fine books are sold). In pre-COVID times he haunted think-tank events to ask provocative, iconoclastic questions (see “Adventures in Think Tank Land” on YouTube) and produced a public access TV show, “Civil Discord”, on which discordant views on controversial topics were discussed in a civil manner (episodes of the show can be viewed on YouTube; search for “Civil Discord Show”).
Featured image is from Food and Water Watch