Canada: There Was No COVID-19 Pandemic: Dr. Denis Rancourt
Analysis of All-cause Mortality by Week in Canada 2010-2021, by Province, Age and Sex: There Was No COVID-19 Pandemic, and There Is Strong Evidence of Response-caused Deaths in the Most Elderly and in Young Males


All Global Research articles can be read in 51 languages by activating the “Translate Website” drop down menu on the top banner of our home page (Desktop version).
Visit and follow us on Instagram at @crg_globalresearch.
***
.
Abstract
We analyzed all-cause mortality by week (ACM/w) for Canada, and for the Canadian provinces, and by age group and sex, from January 2010 through March 2021; in comparison with data for other countries and their regions or counties.
We find that there is no extraordinary surge in yearly or seasonal mortality in Canada, which can be ascribed to a COVID-19 pandemic; and that several prominent features in the ACM/w in the COVID-19 period exhibit anomalous province-to-province heterogeneity that is irreconcilable with the known behaviour of epidemics of viral respiratory diseases (VRDs). We conclude that a pandemic did not occur.
In addition, our analysis of the ACM/w, by province, age and sex, allows us to highlight anomalies, occurring during the COVID-19 period, which provide strong evidence that:
- Among the most elderly (85+ years), many died from the immediate response to the pandemic that was announced by the WHO on 11 March 2020.
- Predominantly young males (0-44 years, and also 45-64 years) probably indirectly died from the sustained pandemic response, in the summer months of 2020, and into the fall and winter, starting in May 2020, especially in Alberta, significantly in Ontario and British Columbia, whereas not in Quebec.
Our study provides constraints on the mechanisms at play in VRD epidemics.
Index
Abstract
- Introduction
- Data
- Results / Interpretation
3.1 No detectable pandemic increase in the yearly and seasonal mortality
3.2 Inter-jurisdictional uniformity of pre-COVID-period features in all-cause mortality by time, 2010-2019
3.3 Inter-jurisdictional variations of COVID-period features in all-cause mortality by time
3.4 Analysis of ACM/w by age group and by sex
- Discussion
4.1 Regarding pandemics
4.2 Regarding the “C”-feature (“covid-peak”) in ACM by time
4.3 Regarding the summer-2020 level and the “2”-feature (“2nd wave”) in ACM by time
4.4 Regarding age group specifics in ACM by time
4.5 Regarding causes of response-induced deaths
4.6 Would there have been fewer deaths?
- Concluding comments: Missing self-evaluation
References
Appendix: ACM/w normalized by population, and comparisons
1. Introduction
A viral respiratory disease (VRD) pandemic has two defining characteristics (Doshi 2008, 2011):
- It occurs everywhere, irrespective of state or jurisdictional boundaries, presumably because there is no prior immunity.
- It causes excess mortality far greater than that due to non-pandemic (seasonal) VRD epidemics.
In 2008, Doshi (2008) put it this way:
One recent official US death toll projection(ref) suggested that the next pandemic will kill 6 to 56 times more Americans than the CDC currently estimates die in an average nonpandemic influenza season.(ref) The World Health Organization (WHO), in a “relatively conservative estimate,”(ref) predicted that the next influenza pandemic could claim 4 to 30 times more lives worldwide than a typical nonpandemic season.(ref)
One problem, in practice, is that VRD-classed mortality is difficult to quantify. The actual number of VRD-attributable deaths is always uncertain, especially when the deaths are counted in the context of a media-frenzy about “the pandemic”. This is as true today as it was when epidemiology was a nascent science; because a cause of death determination, with many co-factors, and in the absence of an analytical autopsy, is prone to human error, human bias, institutional bias, and even constructed bias as we have seen in the COVID period (Borger et al., 2021).
One solution is to avoid the problem altogether, by studying all-cause mortality (ACM) rather than VRD-classed mortality. A death is a death is a death.
In particular, if there is no discernable excess ACM during the presumed pandemic, above the trend in ACM, of the prior decade, say, then it is incorrect to conclude that a pandemic occurred.
The only alternatives are:
- to believe that a pandemic occurred but that an extraordinary medical response prevented the presumably new pathogen from killing many people, in just the right amount as to bring the yearly ACM back to the decadal trend value; or
- to believe that a pandemic occurred but that an extraordinary public-health response delayed the presumably new pathogen in its killing, in just the right amount as to bring the yearly ACM back to the decadal trend value, and then prevented future killing by an extraordinary mass vaccination campaign;
or some combination of the two, or their equivalents.
In science, there is a guiding principle regarding competing interpretations of the same data, called “Occam’s razor” (Gibbs, 1996):
The most useful statement of the principle for scientists is: “when you have two competing theories that make exactly the same predictions, the simpler one is the better.”
In this article, we ask whether a COVID-19 pandemic occurred in Canada, using the above criteria. Our application of Occam’s razor, in this context, is supported by a multitude of studies showing that public-health measures are ineffective against a VRD, which we have reviewed in several other articles.[1]
2. Data
Statistics Canada (StatCan) is the national statistical office of the country. The all-cause mortality (ACM) data used in this article was retrieved from this database and is given by week (ACM/w) and covers the 2010-2021 period (StatCan, 2021). At the date of access, data were available from week-1 of 2010 (beginning of January) through week-17 of 2021 (end of April). In this article we present the data until week-12 of 2021 (end of March) because for later weeks the data for Canada are not consolidated and have the artifact of anomalously small mortality values.
The StatCan data are provided by:
- Provinces and territories
- Age group
- 0-44 years-old
- 45-64 years-old
- 65-84 years-old
- 85 years-old and over
- Sex
- Males
- Females
StatCan specifies that the ACM for 2020 and 2021 is provisional, and that the counts of deaths “have been rounded to a neighbouring multiple of 5 to meet the confidentiality requirements of the Statistics Act”.
3. Results/Interpretation
3.1 No detectable pandemic increase in the yearly and seasonal mortality
The all-cause mortality by week (ACM/w) for Canada, from January 2010 through March 2021, is shown in Figure 1a:
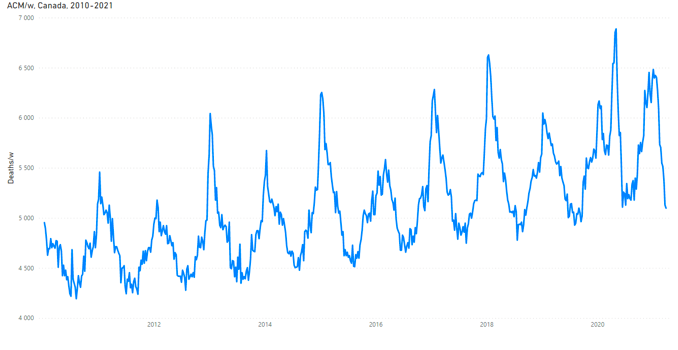
Figure 1a: All-cause mortality by week in Canada from 2010 to 2021. Data are displayed from January 2010 to March 2021. The y-scale is adjusted to show the region of interest. Data were retrieved from StatCan (StatCan, 2021), as described in section 2.
It is important to keep in mind that such graphs are represented using a region-of-interest y-scale. The same data on the full (starting at zero) y-scale is shown in Figure 1b:

Figure 1b: All-cause mortality by week in Canada from 2010 to 2021. Data are displayed from January 2010 to March 2021. The y-scale is not adjusted to show only the region of interest; it starts from 0. Data were retrieved from StatCan (StatCan, 2021), as described in section 2.
In terms of the coarse-level main features (not intra-seasonal details), the usual seasonal pattern occurred in Canada since 2010 into March 2021, which is normally observed in all mid-latitude Northern hemisphere countries or jurisdictions, since 1900 or so where data has been collected.
The said usual seasonal pattern has these main features:
- winter highs and summer lows (here, of deaths per week, ACM/w)
- summer-low or trough values (deaths per week) that vary monotonically from summer to summer, typically linearly over the course of a decade (we refer to this monotonic variation as the “summer baseline trend”)
- winter-high or maximum values (deaths per week) that vary erratically from winter season to winter season, in both magnitude and date (or week-number)
- winter-burden deaths (integrated above the summer baseline trend, over a “cycle-year”, from mid-summer to mid-summer) typically (since the 1960s) corresponding to between 5% and 15% of yearly mortality
We have analysed such patterns in ACM by time (day, week, month) for several jurisdictions, including jurisdictions in Canada, in two prior articles (Rancourt, 2020) (Rancourt, Baudin, Mercier, 2020).
Figure 1 shows that there was no excess yearly or seasonal mortality, above the usual values of the last decade for Canada, in either the 2019-2020 winter or the 2020-2021 winter (up to and including March 2021). This is confirmed by calculating ACM per year. We calculated ACM by “cycle-year”, where we define a cycle-year as occurring from week-31 (around the beginning of August) of calendar year N through to week-30 (around the end of July) of calendar year N+1. As such, for example, nominal cycle-year 2018 is centered on the winter of 2018-2019. This definition of cycle-year takes one from mid-summer-trough to the next mid-summer-trough in ACM/w, such as to capture the intrinsic seasonal structure of ACM/w, having winter highs and summer lows. The result is plotted in Figure 2:
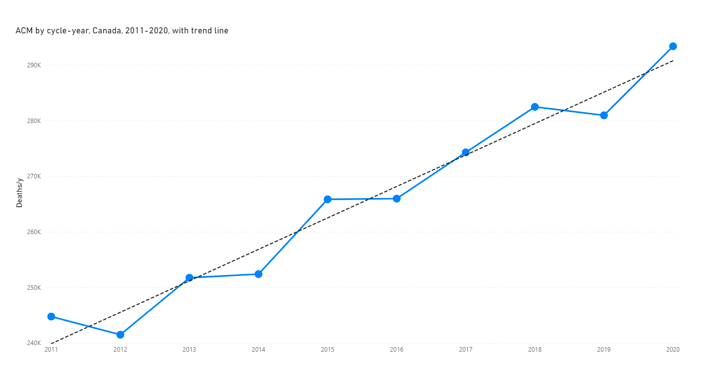
Figure 2: All-cause mortality by cycle-year for Canada, cycle-years 2011 to 2020, calculated as described above. The dashed line is a least-squares fitted straight line. The cycle‑year starts on week-31 of a calendar year (beginning of August) and ends on week-30 of the next calendar year (end of July). Data for the calculation were retrieved from StatCan (StatCan, 2021), as described in section 2.
We conclude that there was no COVID-19 pandemic in Canada. It would be difficult to conclude otherwise. Either a pandemic causes a significant increase in deaths, or there was not a pandemic, barring the many unscientific false beliefs in effective public health interventions for VRDs.
Let us make this point further by showing the anomalous province-to-province intra-seasonal variations in ACM by time, which occur in the COVID or nominal-pandemic period (after 11 March 2020, the date the WHO proclaimed a pandemic).
3.2 Inter-jurisdictional uniformity of pre-COVID-period features in all-cause mortality by time, 2010-2019
The ACM/w 2010-2021 (through to March 2021) is plotted for several Canadian provinces, as follows.
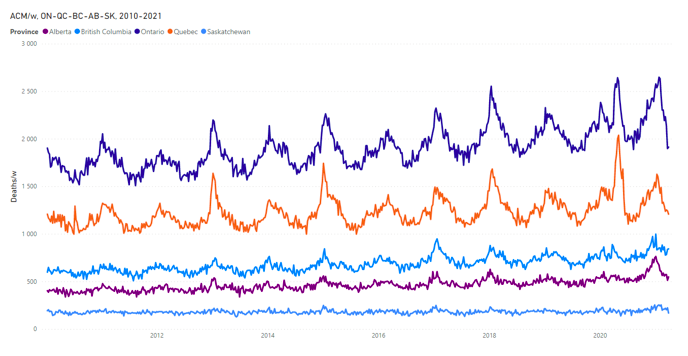
Figure 3a: All-cause mortality by week from 2010 to 2021 for, top to bottom, Ontario (ON), Quebec (QC), British Columbia (BC), Alberta (AB) and Saskatchewan (SK). Data are displayed from January 2010 to March 2021. Data were retrieved from StatCan (StatCan, 2021), as described in section 2.
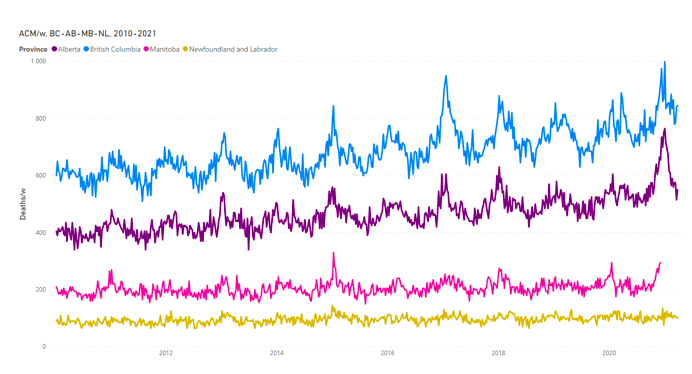
Figure 3b: All-cause mortality by week from 2010 to 2021 for, top to bottom, British Columbia (BC), Alberta (AB), Manitoba (MB) and Newfoundland and Labrador (NL). Data are displayed from January 2010 to March 2021. Data were retrieved from StatCan (StatCan, 2021), as described in section 2.
The seasonal cycles of ACM/w are extraordinarily regular and display essentially identical winter-season features from province to province for a given winter, up to and including 2019. In other words, up to and including 2019, the seasonal patterns and intra-seasonal shapes of ACM/w are synchronous copies of each other, from province to province, while being scaled in whole-pattern magnitude approximately by provincial population. Plots of ACM/w, normalized by provincial population, are shown and compared in the Appendix.
We have observed such regularity, from jurisdiction to jurisdiction, and including from continent to continent, in all ACM-by-time data that we have examined for many jurisdictions (countries, regions, provinces, counties) in North America and Europe, over the many decades of available data, for example (Rancourt, 2020) (Rancourt, Baudin, Mercier, 2020). Although there are small differences, the main first-level observation is the remarkable similarity in patterns, ratios of winter-to-winter magnitudes, and synchronicity, across all mid-latitude jurisdictions. We note that these robust data (ACM-by-time for North America and Europe, 20th and 21st centuries up to 2019) put into question two paradigms about VRDs (presumed to be the major cause of the seasonality of mortality in mid-latitude countries):
- that a specific VRD-causing virus/variant originates at a localized source and “spreads” across countries or continents by person to person contact or personal proximity (“source-spread” paradigm)
- that there are “pandemics” of VRDs, distinct from non-pandemic epidemics (“pandemic” paradigm)
Regarding the latter point, none of the 1957-1958 H2N2, 1968 H3N2, 2009 H1N1, or 2003 SARS pandemics are detected in ACM-by-time data, as meaningfully distinguished from non-pandemic seasonal epidemics. This is also the case if one analyses estimates of “influenza-classed mortality” rather than ACM (Doshi, 2008). The 1918 surges in ACM in both continents, by contrast, are very large, but constitute a special case involving mass bacterial infections, prior to the advent of antibiotics, killing solely young adults and infants, not the elderly, in societies and economies dramatically reorganized after the end of the First World War.
At the very least, ACM-by-time data imposes stringent real-world constraints on the theoretical or interpretational consequences of using these paradigms (source-spread, pandemic) to explain large-scale epidemiological observations.
Clearly for Canada, which is the size of a continent, Figures 3a & 3b (and see Appendix) show a remarkable regularity up to and including 2019: The provinces, East to West, have the same “fingerprints” of ACM/w. Detailed winter-season shapes, timing of features (synchronicity), and ratios of winter-to-winter magnitudes, are all essentially the same, province to province, 2010-2019, although the amplitudes of seasonal variation are smaller in the low-altitude (non-mountainous) maritime-climate provinces of the Canadian East coast (see below).
3.3 Inter-jurisdictional variations of COVID-period features in all-cause mortality by time
Although, as described above in section 3.1, “in terms of the coarse-level main features (not intra-seasonal details), the usual seasonal pattern occurred in Canada since 2010 into March 2021” (including the COVID-period), nonetheless there were significant anomalies in intra-seasonal features in the COVID-period, which we next examine, and which are relevant to whether a pandemic occurred.
As stated in the Introduction (section 1), a pandemic “occurs everywhere, irrespective of state or jurisdictional boundaries, presumably because there is no prior immunity”.
In particular:
- The pathogen presumed to cause the pandemic — a highly contagious pathogen of the VRD kind — will not stop at provincial borders in Canada.
- The presumed pathogen will not affect the similar populations in different provinces in dramatically different ways; such as killing young males in one province while killing only the elderly in another.
- The presumed pathogen itself, acting at the same time in March-April-May 2020 in two neighbouring similar provinces, for instance Ontario and Quebec, cannot be 2-3 times more deadly (per inhabitant) in Quebec than in Ontario.
We examine these propositions in the following figures.
First, the ACM/w for Canada is represented in an expanded view, from 2019 through March 2021, in order to define key features that occurred in the COVID-period:

Figure 4: All-cause mortality by week in Canada from 2019 to 2021. Data are displayed from January 2019 to March 2021. The dark-blue vertical line represents the week of March 11 2020, when WHO declared the pandemic. The three features are labelled as: C = “covid-peak”, S = summer 2020, 2 = 2020-2021 winter peak (“2nd wave”). Data were retrieved from StatCan (StatCan, 2021), as described in section 2.
Here, the 11 March 2020 date of the WHO pronouncement of the pandemic is shown as the vertical line, “C” denotes the ACM-by-time feature that we have called the “covid-peak” (Rancourt, 2020) (Rancourt, Baudin, Mercier, 2020), “S” denotes the summer trough in mortality of 2020, and “2” denotes the 2020-2021 winter peak (usually referred to as “2nd wave”).
The Canada ACM/w features “C” and “S” (Figure 4) are anomalous in their own right, as follows.
We have already written extensively about “C”, which is our so-called “covid-peak”, observed in many jurisdictions in mid-latitude Northern hemisphere countries (Rancourt, 2020) (Rancourt, Baudin, Mercier, 2020). It is anomalous in that:
- Everywhere that it occurs, it emerges synchronously immediately following the WHO’s 11 March 2020 pronouncement of the pandemic.
- Its initial rise is exceedingly sharp, with a base to inflection-point time of approximately 3 weeks (2 weeks in ACM by day, ACM/d, data for France).
- Such a large and sudden surge virtually never occurs so late in the seasonal cycle (after 11 March, in March, April, May), which is otherwise always a downslope from the mid-winter (January-February) highs.
- It is extremely heterogeneous by jurisdiction in its magnitude, not being present or barely detected in 34 of the 52 USA states, 6 of the 13 regions of metropolitan France, 7 of the 10 provinces of Canada, 18 of the 21 counties of Sweden, and so on, while being disproportionately large in specific jurisdictions such as New York City in the USA, the Paris region in France, Stockholm county in Sweden, and the province of Quebec in Canada.
- Where it occurs, the degree to which it extends late into the season (into May) is variable from jurisdiction to jurisdiction; ending in April 2020 in France, in May 2020 in Canada and the USA.
The Canada ACM/w feature “S” (Figure 4) is anomalous because its mean baseline magnitude (5.25K deaths/w) is anomalously larger than the summer‑2019 mean baseline value (5.05K deaths/w), and significantly larger than the magnitude predicted by the linear summer baseline trend values for the prior years, as can be ascertained from Figure 1.
This means that some net 200 excess deaths per week were occurring in Canada in the summer of 2020, in a season in which VRDs are not active. Below, we show that the main contributor to these excess summer deaths was deaths of young (0-44 years) males, an age where COVID-19 virtually does not cause deaths (Levin et al., 2020), occurring predominantly in Alberta, Ontario and British Columbia. Whereas, the opposite occurs in Canada for the 85+ years age group: The summer-2020 mean baseline magnitude (ACM/w) is significantly smaller than the 2010-2019 trend value for this age group (Figure 6a).
Figures 3a & 3b show the following points regarding the COVID-period:
- Only ON, QC and BC have significant “C”-features (“covid-peaks”). The other seven provinces do not have statistically detectable “C”-features.
- The “C”-feature in the QC data is very strong, intermediate in ON, and relatively weak in BC.
- Whereas AB, MB and SK did not have “C”-features, they have anomalously large “2”-features, compared to their prior winter-season mortalities since 2010, especially AB.
These observations are easier to make in y-scale expanded views of each province:
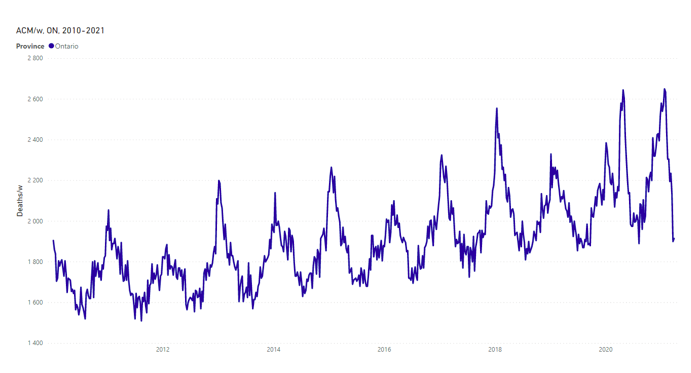
Figure 5-ON: All-cause mortality by week in Ontario from 2010 to 2021. Data are displayed from January 2010 to March 2021. Data were retrieved from StatCan (StatCan, 2021), as described in section 2.
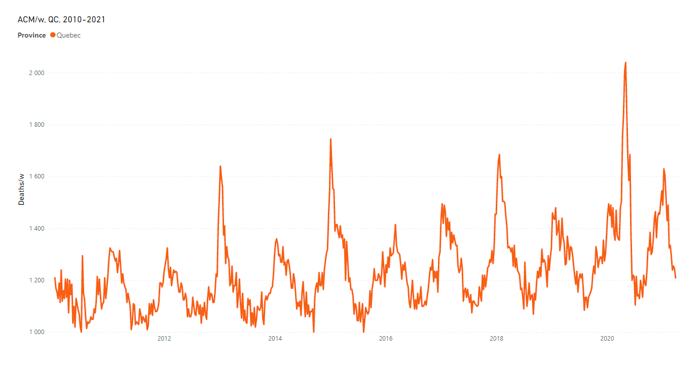
Figure 5-QC: All-cause mortality by week in Quebec from 2010 to 2021. Data are displayed from January 2010 to March 2021. Data were retrieved from StatCan (StatCan, 2021), as described in section 2.
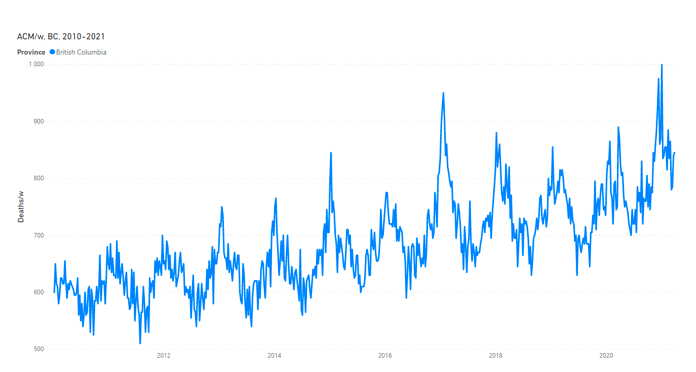
Figure 5-BC: All-cause mortality by week in British Columbia from 2010 to 2021. Data are displayed from January 2010 to March 2021. Data were retrieved from StatCan (StatCan, 2021), as described in section 2.

Figure 5-AB: All-cause mortality by week in Alberta from 2010 to 2021. Data are displayed from January 2010 to March 2021. Data were retrieved from StatCan (StatCan, 2021), as described in section 2.
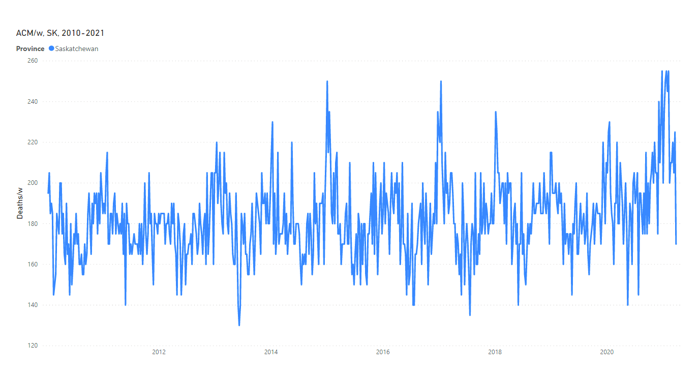
Figure 5-SK: All-cause mortality by week in Saskatchewan from 2010 to 2021. Data are displayed from January 2010 to March 2021. Data were retrieved from StatCan (StatCan, 2021), as described in section 2.

Figure 5-NS: All-cause mortality by week in Nova Scotia from 2010 to 2021. Data are displayed from January 2010 to March 2021. Data were retrieved from StatCan (StatCan, 2021), as described in section 2.
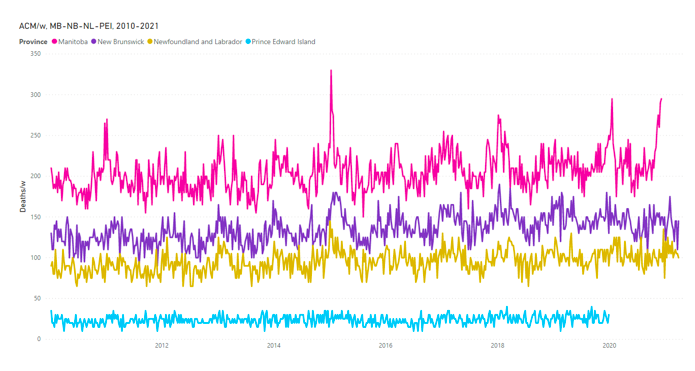
Figure 5-MB-NB-NL-PEI: All-cause mortality by week from 2010 to 2021 for, top to bottom, Manitoba (MB), New Brunswick (NB), Newfoundland and Labrador (NL) and Prince Edward Island (PEI). Data are displayed from January 2010 to March 2021. Data were retrieved from StatCan (StatCan, 2021), as described in section 2.
Most notably:
- The “C”-feature (“covid-peak”) for Quebec is exceptionally large among all provinces. Among other factors, Quebec care-home workers are known to have abandoned their locked-in patients en masse, presumably out of fear, even leading to criminal investigations.[2]
- The “C”-feature (“covid-peak”) for Ontario is also unambiguously anomalous, as a large feature of this magnitude and shape this late in the winter-mortality season. There was also large-scale care-home negligence in Ontario, documented in investigative media articles and a military report.[3]
- The “C”-feature (“covid-peak”) is present for British Columbia, indicating some measures-induced and treatment-induced deaths in care-homes and hospitals, but to a lesser degree than in Ontario and Quebec.
- The “2”-feature (“2nd wave”) is massive in Alberta, which is exceptional among all provinces. The peak is twice as high as any other winter peak for Alberta in the decade 2010-2020. Alberta also has an exceptionally high summer-2020 mortality, relative to its prior-decade trend of summer-trough mean magnitudes.
- Both Ontario and Saskatchewan also have high summer-2020 mortalities, relative to their respective prior-decade trends of summer-trough mean magnitudes, and unusually large “2”-features (“2nd waves”), but not to the degree observed for Alberta.
- Most East coast provinces (NS, NL, PEI, not NB) have small-amplitude seasonal cycles of ACM; and none for which there are data (NS, NL, NB) have ACM/w that exhibits any evidence of a COVID-19 pandemic or disruption, none whatsoever (data is missing for PEI).
3.4 Analysis of ACM/w by age group and by sex
The plots of ACM/w, from January 2010 through March 2021, for Canada, by age group (age at time of death), for the four age groups (0-44, 45-64, 65-84, 85+ years), are as follows.
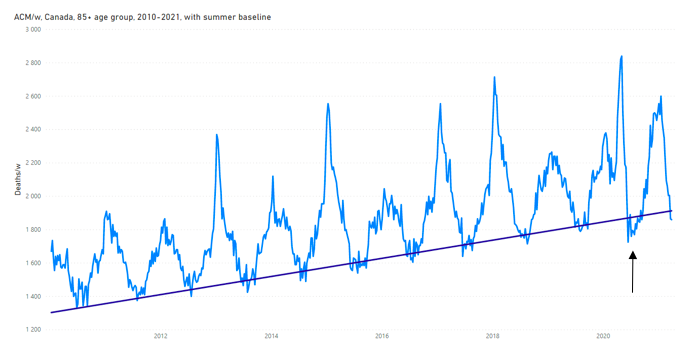
Figure 6a: All-cause mortality by week in Canada for the 85+ years age group, from 2010 to 2021. Data are displayed from January 2010 to March 2021. The linear trend-line is a least-squares fit to the summer troughs for summer-2013 through summer-2019, using the following summer trough weeks: 2013-weeks 24-37, 2014-weeks 28-33, 2015-weeks 25-38, 2016-weeks 24-34, 2017-weeks 24-33, 2018-weeks 27-35, 2019-weeks 26-38. The arrow indicates a feature discussed in the text. Data were retrieved from StatCan (StatCan, 2021), as described in section 2.
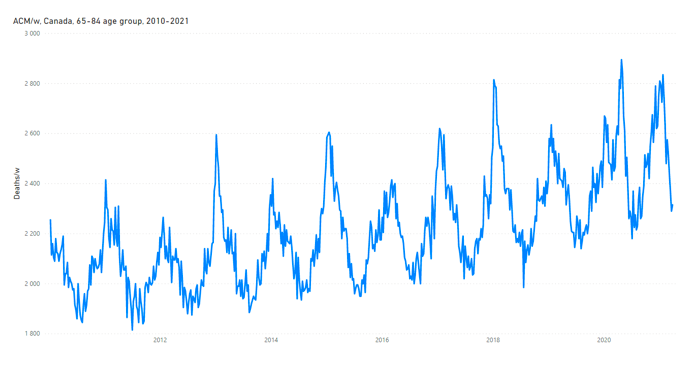
Figure 6b: All-cause mortality by week in Canada for the 65-84 years age group, from 2010 to 2021. Data are displayed from January 2010 to March 2021. Data were retrieved from StatCan (StatCan, 2021), as described in section 2.
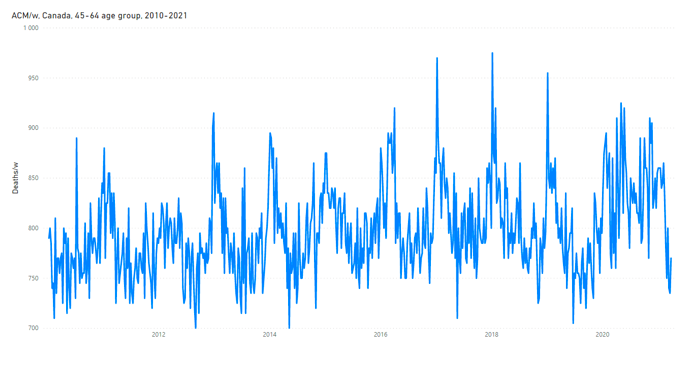
Figure 6c: All-cause mortality by week in Canada for the 45-64 years age group, from 2010 to 2021. Data are displayed from January 2010 to March 2021. Data were retrieved from StatCan (StatCan, 2021), as described in section 2.

Figure 6d: All-cause mortality by week in Canada for the 0-44 years age group, from 2010 to 2021. Data are displayed from January 2010 to March 2021. Data were retrieved from StatCan (StatCan, 2021), as described in section 2.
Several observations can be made about the ACM/w data shown in Figures 6a through 6d, as follows:
- The amplitude (summer mean baseline value to winter maximum) of the seasonal variations in ACM/w, normalised by the summer mean baseline value, varies significantly with age, approximately as: near-zero for 0-44 years (no seasonal variation), 20% for 45-64 years, 30% for 65-84 years, and some 60% for 85+ years. The causes of increased winter deaths are more effective in the elderly, and all the more the older one gets.
- The patterns (“fingerprints”) of ACM/w are essentially identical for the 85+ and 65-84 years age groups, prior to the COVID-period (prior to 11 March 2020). See plots of direct comparisons in the Appendix. This suggests that the causes for increased winter deaths, and their timing, are the same in the two age groups, normally, where only the magnitude for the age group is affected by increased generalized frailty in the most elderly. Stated differently: One age group does not die of different causes than the other, regarding the increased likelihood of death in the winter.
- The latter point, regarding virtually identical intra-season time-structures, for each given season in the two age groups of the most elderly, including in the COVID-period, suggests that the driver of increased winter deaths is synchronized by the same cause(s) for the two age groups, which precludes vitamin deficiency, cancer, heart attacks and strokes, acting alone, but does not preclude weather, sudden societal or economic or institutional changes, sudden geological events, or sudden appearances of high-concentrations of pathogens in the living environments.
- The “C”-feature (“covid-peak”) in the ACM/w of the 85+ years age group (Figure 6a) is anomalous, relative to known ACM by time data of the last many decades for European and North American jurisdictions. Its dramatic drop occurs in a mere 6 weeks (as does its rise), during the weeks of 2 May 2020 to 13 June 2020, to summer-2020 values that are significantly below the linear trend-line for mean summer-trough values for summers 2013 through 2019 (Figure 6a).
- As such, the “S”-feature in the ACM/w of the 85+ years age group (Figure 6a) is equally anomalous. Why would 85+ year olds in Canada become relatively impervious to dying in the summer of 2020, in mid pandemic, between the presumed first and second waves of death? Our interpretation is: The deaths of many 85+ year olds were artificially accelerated, at a time when seasonal VRD transmission is low, so that their deaths were not spread out into the following summer and fall, as would normally be the case.
- Another large anomaly, which should be considered a national public health catastrophe of historic proportion but is virtually absent from the media and government-official pronouncements, is shown in Figure 6d, for the 0-44 years age group. Here, we see a significant increase in deaths, from a pre-COVID-period plateau value of approximately 260 deaths/w to a summer-2020 value of approximately 320 death/w, lasting at least 28 weeks, into the start of December 2020. The peak corresponds to approximately 2,000 excess deaths in this 0-44 years age group in Canada, following the WHO pronouncement of a pandemic.
- The latter deaths cannot be ascribed to COVID-19 because the presumed disease virtually does not kill in this age group, and there is little transmission of VRDs in summer months. A similar but lesser relative increase in summer-2020 deaths occurs in the 45-64 years age group (Figure 6c).
The COVID-period excess deaths in the younger age groups can be further explored by sex, and by province. Relevant plots of ACM/w are as follows, for the 0-44 years age group, first for Canada, then select provinces.

Figure 7a: All-cause mortality by week in Canada for males of the 0-44 years age group, from 2010 to 2021. Data are displayed from January 2010 to March 2021. Data were retrieved from StatCan (StatCan, 2021), as described in section 2.

Figure 7b: All-cause mortality by week in Canada for females of the 0-44 years age group, from 2010 to 2021. Data are displayed from January 2010 to March 2021. Data were retrieved from StatCan (StatCan, 2021), as described in section 2.
Figures 7a & 7b show that, generally in the last decade, young Canadian males are almost twice (approximately 1.7 times) as likely to die of any cause compared to young Canadian females (0-44 years age group).
These figures (Figures 7a & 7b) also show that the excess summer‑2020 deaths seen in this age group at the national level (Figure 6d) is almost entirely due to male deaths. This is also true for all the provinces that exhibit this feature in the 0-44 years age group. Virtually only males contribute to these excess deaths.
Next, we examine 0-44 years age group male deaths by province, as follows.
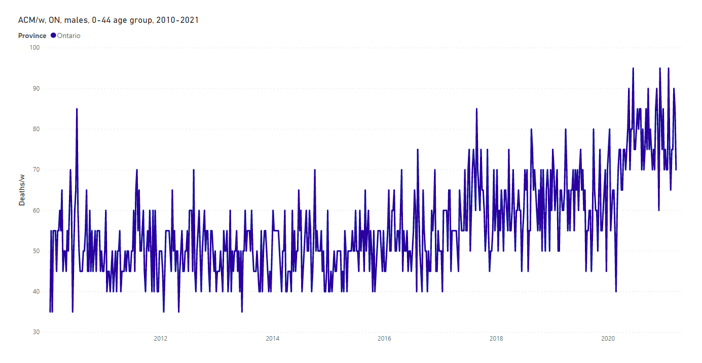
Figure 8-ON: All-cause mortality by week in Ontario for males of the 0-44 years age group, from 2010 to 2021. Data are displayed from January 2010 to March 2021. Data were retrieved from StatCan (StatCan, 2021), as described in section 2.
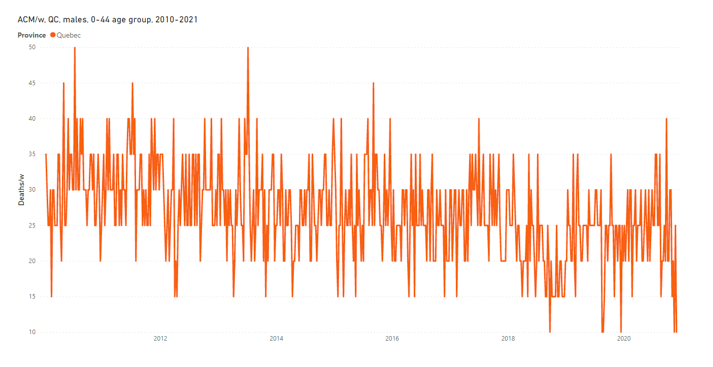
Figure 8-QC: All-cause mortality by week in Quebec for males of the 0-44 years age group, from 2010 to 2021. Data are displayed from January 2010 to March 2021. Data were retrieved from StatCan (StatCan, 2021), as described in section 2.

Figure 8-BC: All-cause mortality by week in British Columbia for males of the 0-44 years age group, from 2010 to 2021. Data are displayed from January 2010 to March 2021. Data were retrieved from StatCan (StatCan, 2021), as described in section 2.

Figure 8-AB: All-cause mortality by week in Alberta for males of the 0-44 years age group, from 2010 to 2021. Data are displayed from January 2010 to March 2021. Data were retrieved from StatCan (StatCan, 2021), as described in section 2.
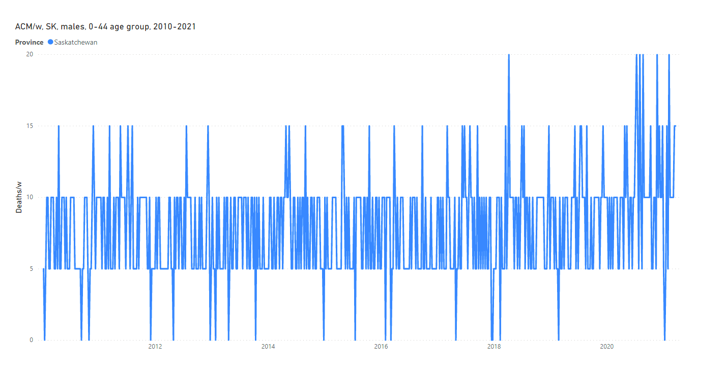
Figure 8-SK: All-cause mortality by week in Saskatchewan for males of the 0-44 years age group, from 2010 to 2021. Data are displayed from January 2010 to March 2021. Data were retrieved from StatCan (StatCan, 2021), as described in section 2.
Thus we see that the phenomenon of excess 0-44 years age group male deaths is present in the large-population provinces, and in Saskatchewan and Manitoba (not shown), but exceptionally not present in Quebec.
Did the presumed SARS-CoV-2 virus decide not to act in this way in the province of Quebec, or is there another explanation? Our interpretation is that the excess deaths in males of the 0-44 years age group arise from the stress of the large-scale and continued societal and economic responses to the declared pandemic, and that the experienced stress in young men is lesser in Quebec because of significant cultural differences with Anglophone provinces, under conditions imposed by all provincial governments.
4. Discussion
4.1 Regarding pandemics
As noted above, the intra-seasonal and inter-seasonal time structures and the jurisdictional homogeneity in ACM by time, up to continental geographical scales for mid-latitudes, in unperturbed societies (unperturbed by sudden changes tied to world wars, or by sudden global “pandemic response” reorganizations), set constraints regarding the possible causes of the seasonal phenomenon having high winter death rates. Precluded causes are: vitamin deficiency, cancer, heart attacks and strokes, acting alone. Not precluded causes include: weather, sudden societal or economic or institutional changes, sudden geological events, sudden appearances of high-concentrations of pathogens in the living environments, or combinations thereof.
We would argue for “sudden appearances of high-concentrations of pathogens in the living environments”. The stability-in-air of aerosol particles is known to be controlled by absolute humidity in mid-latitudes (e.g., see Rancourt, 2020b, and references therein). We imagine summer background population mixing, and faster dry-season population mixing, of continually arising mutations of pathogens that transmit by suspended aerosols (i.e., the entire ecology of VRD viruses), followed by sudden low-absolute-humidity-induced winter-time increases of concentrations (in the built environment – individual homes to public spaces) of aerosols bearing all such pathogens.
The infections from the multitude of co-acting VRD viruses would be accompanied by an array of opportunistic bacterial co-infections, aided by the dry-air stress on respiratory tract tissues.
We believe that the genome-centered view of single unique viral mutations/variants explaining seasonal structures in ACM by time is too narrow and over-emphasized. The contributions from weather and from the large array of co-acting pathogens must be more relevant than the “particular-special-new-mutation/variant virologist’s view”, otherwise pandemics would be observed in ACM by time data, and they are not.
Simply put, the pandemic paradigm is a beautiful theory, which is greatly pleasing to the genome jockeys, but it is not supported by hard epidemiological data, and it has a great potential to cloud public health thinking by directing focus on a presumed pathogen-specific disease rather than identifying and addressing all the important aspects of a health crisis or chronic-disease circumstances.
In Canada at least, in the present article we have shown that no additional yearly or seasonal integrated mortality occurs in the COVID-period (Figures 1 & 2). There was no COVID-19 pandemic in Canada, which can be detected in ACM by time. It would be a fantasy to believe that Canada avoided the COVID-19 pandemic deaths by its hurried, differing and unproven pandemic response, such as to exactly bring the resulting net yearly and seasonal mortalities in line with the trend of the last decade (Figure 2).
4.2 Regarding the “C”-feature (“covid-peak”) in ACM by time
The occurrence of dramatic jurisdiction-to-jurisdiction differences (jurisdictional heterogeneity) in the magnitude (relative to summer baseline) of the “C”-feature (“covid-peak”) in ACM/w by province in Canada is diametrically opposite to all pre-COVID-period ACM by time data that we have examined for many jurisdictions (countries, regions, provinces, counties) in North America and Europe, over the many decades of available data.
Whereas pre-COVID-period integrated winter-burden mortalities (above linear summer baseline trends), normalized by mean summer baseline mortality or by jurisdictional population, are always relatively constant between jurisdictions, the “covid-peak” feature varies widely between jurisdictions in a given country, or between countries, often being undetectable or borderline detectable, versus extreme “hot spot” jurisdictions.
For France, we calculate that, on the basis of region-level jurisdictional divisions, the standard deviation of the “covid-peak” integrated magnitude normalized by population divided by the mean (s.d./mean) is 3-fold greater than the standard deviation for integrated winter-burden magnitude (integrated above the linear trend of summer-trough minimums) normalized by population divided by the mean (s.d./mean) (article in preparation).
We argue that such jurisdictional heterogeneity cannot be due to a VRD epidemic in an unperturbed society, because such a phenomenon has never previously occurred in the many decades since reliable data is available for many jurisdictions. Only an unusually large perturbation of the society can produce such a phenomenon.
We believe that it is not a coincidence that all the “covid-peaks” — in jurisdictions where they occur on both continents — started their sharp and sudden surges immediately (within 1 week or so) after the WHO’s 11 March 2020 pronouncement of a pandemic. We believe that viruses did not suddenly everywhere act on cue in response to the WHO memo, in those jurisdictions where the “covid-peak” feature occurs in ACM by time.
4.3 Regarding the summer-2020 level and the “2”-feature (“2nd wave”) in ACM by time
By-province heterogeneity is also present in the summer-2020 level and in the “2”‑feature (“2nd wave”) in the COVID-period of ACM/w in Canada (esp. for Alberta, Figure 5-AB).
It is unlikely that a same pandemic-causing virus acted alone to produce significant excess deaths in the summer-2020 period, relative to the linear trend of summer baseline values, irrespective of the magnitude of the preceding “covid-peak”: Ontario (Figure 5-ON), British Columbia (Figure 5-BC) and Alberta (Figure 5-AB), but not noticeably in Quebec (Figure 5-QC), for instance.
It is possible that the excess deaths in the summer-2020 period were induced by the societal disruption of the pandemic response (more below), without being associated with any VRD, except secondarily via the so-called “dry tinder” effect following a large “covid-peak”.
More strikingly, the “2”-feature (“2nd wave”) peak for Alberta is massive, compared to any other province, whereas no noticeable “covid-peak” occurs in this province (Figure 5-AB). A pandemic-causing virus cannot decide not to produce a “1st wave” but only a “2nd wave” in one province of a continuously connected country having similar provincial populations. Nothing like this has ever been observed, to our knowledge.
We argue that the “2”-feature (“2nd wave”) peak, occurring during a winter-season of expected increased mortality, has varying province-wise magnitudes because of the province to province differences in pandemic response, and province to province differences in population resilience against the stress of the imposed measures.
In short, like with the “covid-peak”, such jurisdictional heterogeneity cannot be the result of the genome of a particular viral pathogen. Such epidemiological heterogeneity of presumed VRD mortality has not previously been observed in North America or Europe in many decades of reliable ACM by time data. VRD viruses of any mutation or variety do not recognize jurisdictional boundaries and do not act so widely differently on similar populations on continuous territories. The large features of the ACM by time data for the COVID-period can only be explained by appealing to additional causal factors beyond the limited purview of virology.
4.4 Regarding age group specifics in ACM by time
The ACM/w in Canada for the 85+ years age group (Figure 6a) allowed us to partly unravel the complex and unusual behaviour of mortality in the COVID-period. As mentioned above, the sharp drop in its “covid-peak” connects to a summer-2020 having anomalously small mortality for this age group (Figure 6a).
This is all the more surprising in that the summer-2020 mortality for all age groups is anomalously large (Figure 1). Cumulatively, all ages have an anomalously large summer-2020 mortality, whereas the 85+ years age group has an anomalously small summer-2020 mortality. Mortality of younger Canadians increased, in a season that does not normally carry many VRD infections, whereas less mortality occurred for the most aged Canadians.
In the ACM/w data for the 85+ years age group (Figure 6a), the “covid-peak” followed by an anomalously small summer-2020 mortality, may be a most compelling example of the so-called “dry tinder” effect, in which successive winter-season mortalities are argued to be anti-correlated because a harsh winter leaves fewer frail elderly to die in the following winter. Whereas this postulated winter-to-winter anti-correlation is not easily discerned, except in earlier times when mortalities were larger (see mid-1940s to mid-1950s for France, Figure 1 of Rancourt, Baudin, Mercier, 2020), here (Figure 6a) we demonstrate the effect, within an exceptional year, in current times.
Finally, there is the anomalous mass mortality of young males in Canada, especially in Alberta but not in Quebec, in summer-2020 and into the fall (Figure 7, all parts). This ignored and silent epidemic is most likely not due to any VRD, and merits an independent investigation in its own right.
4.5 Regarding causes of response-induced deaths
We seek to describe plausible mechanisms whereby sudden disruptions in society can induce deaths, or reduce deaths at later times, without necessarily significantly changing the yearly or seasonal death burden compared to a decadal trend, following (Rancourt, 2020) (Rancourt, Baudin, Mercier, 2020).
We propose that there are three large categories of such plausible mechanisms:
- Medical response, treatment and palliative protocols, adopted at the onset of the proclaimed and media-hyped pandemic.
- Pandemic response, public health measures, institutional protocols (esp. schools, care homes, and hospitals), economic upheaval, lockdowns, curfews, self-quarantine, etc.
- Policies of denial of medical treatment, such as refusal to admit elderly persons into hospital care, or transfers of patients out of hospital care.
In France, for example, as in many other countries, starting in March 2020 there were tremendous social and medical disruptions, not planned or previously applied. The national lockdown in-effect was a “stay-at-home” order, including not visiting the family physician, and to call the emergency services only in cases of breathing difficulty, which was by itself a dangerous recommendation as people presenting those symptoms were usually already in a late stage of disease, often admitted to hospital directly into the intensive care unit. This reckless protocol directed by health authorities concerned not only COVID-19, but generally all medical conditions since people were asked to stay at home, to not visit their general practitioners, nor to show up at hospitals (to avoid an unmanageable institutional burden). Another statement from the health authorities was that no treatment exists for COVID-19: people were told to take Doliprane® (acetaminophen) in case of symptoms; and healthcare professionals were denied using or attempting any medical protocol. This caused abandonment of medical care by the general population and by healthcare professionals, following the official recommendations. The official recommendations thereby may have promoted excessive and dangerous self-medication with over-the-counter substances such as Doliprane® and analogous drugs. Signatures of the unprecedented perturbation in the healthcare system include changes in specific drug usage and consumption in 2020, such as significant drops in the use of antibiotics and significant increases in the use of psychoactive drugs (Chaillot, 2020) (and our article in preparation). One specific example is the Rivotril® drug (clonazepam) in its injectable form, which by decree[4] could exceptionally by used from 23 March to 15 April 2020 without marketing authorization to terminate patients affected or likely to be affected by SARS-CoV-2 if their health status justified it, and which showed an increase of more than 200% in April 2020 compared to the mean over January 2017 to February 2020 (Chaillot, 2020).
In the USA, the early over-use of mechanical ventilators is a well-studied aspect of deadly COVID‑19 medical responses (Richardson et al., 2020).
In addition, and in Canada, the unprecedented strict mass quarantine and isolation of both sick and healthy elderly people, together and separately, would have caused the deaths of many of them, and is probably a main cause of the “covid-peak” event in Canada, where a great majority of COVID-19-assigned deaths occurred in care homes for the elderly (Clarke, 2021):
During the first wave of the pandemic (March through August 2020), residents of nursing and seniors’ homes accounted for more than 80% of all reported COVID-19 deaths (ref). […] By mid-December (partway through the second wave that lasted from September 2020 through February 2021), there were about 44,000 cases and 9,200 deaths in nursing and seniors’ homes (ref). As of early March 2021, reports indicated that nursing and seniors’ homes continued to account for the greatest proportion of outbreak-related cases and deaths, representing about 7% of all cases and more than 50% of all deaths (refs).
By the said mass quarantine in care homes and establishments, Canadian provincial institutions isolated vulnerable elderly persons from their families, limited movements within establishments, often confining individuals to their rooms or beds for days and weeks if not months, reduced the staff and allowed staff to be absent, forced staff to adopt extreme measures such as masks, shields and gloves, which can induce a measure of fear or terror, created a general atmosphere of danger, and prevented air circulation by locking doors and windows, and by preventing ingoing and outgoing traffic except for essential services (Campbell, 2020; Comas-Herrera, Fernandez, et al., 2020; Wu, 2020).
This would have both: retained the pathogen-bearing aerosol particles suspended in the air without their evacuation (Morawska and Milton, 2020); and induced psychological stress in the residents.
Psychological stress is known:
- to be a major factor causing diseases, including immune response dysfunction, depression, cardiovascular disease and cancer (Cohen, Janicki-Deverts and Miller, 2007),
- to be a dominant factor in making an individual susceptible to viral respiratory diseases, in terms of intensity of the infection (Cohen, Tyrrell and Smith, 1991), and
- to have more deleterious effects in elderly persons than in younger persons (Prenderville et al., 2015).
Furthermore, social isolation itself, in addition to individual psychological stress, is known to have an added impact on the said susceptibility to viral respiratory disease (Cohen et al., 1997).
Furthermore, there is a longer term “abandonment of life” phenomenon that occurs with imposed extended isolations of elderly persons, the so-called “glissement” syndrome (or “slipping away syndrome” or “geriatric failure to thrive”), which is analogous to depression (Robertson and Montagnini, 2004; Clegg et al., 2013; Steptoe et al., 2013; Ong, Uchino and Wethington, 2016).
The suddenly applied national policy of forced quarantine and the psychological stress it generated on fragile elderly people would have been a contributor in the decrease of efficiency of immune system response to a viral respiratory disease (Comas-Herrera, Zalakaín, et al., 2020) and this is a probable explanation for much of the mortality in the “covid-peak” and in the “2nd wave”. The same mechanism would operate in any setting (facility, group home, home, hospital) where persons with health vulnerabilities are isolated and susceptible to psychological stress.
Whereas care homes are institutional environments that are extremely susceptible to epidemics, whereas VRD epidemics in care homes are common and this is well known (Utsumi et al., 2010), and whereas the best recommendation to prevent the spread of a VRD epidemic in a care home is vigilant and early diagnosis of cases of clinically ill infected individuals followed by rapid effective treatment and isolation/distancing of those individuals (Loeb et al., 2000) (Bowles et al., 2003), therefore it is important to note that the opposite was done in Canadian care homes: no surveillance for emergent clinical infections, no treatment or search for treatment, no targeted removal/distancing or isolation of the clinically ill infected individuals, and universal lockdown of all residents. Even antibiotic treatment of bacterial co-infections may have been in-effect denied, as appears to have been the case in France (as mentioned above).
Rancourt recently summarized the situation this way:[5]
The mechanism that made care homes and institutions for sick and elderly persons into killing fields includes the following elements (refs):
- infection seeding by hospital transfers into the care homes
- universal lockdowns of the care homes
- denied specialized medical treatment to the residents of the care homes
- reduced staffing and staff abandonment in the care homes, and negligence
- collateral effects of the universal lockdown of the care homes: extreme social isolation, psychological stress, reduced aerosol-exhaust ventilation, lost oversight of the institutions by family-members
We can add the use of Rivotril® (in France), which would have terminated some elderly patients with breathing difficulties, and other changes in treatment practices (see above).
4.6 Would there have been fewer deaths?
Although we have shown that there was no pandemic, nonetheless, there are year to year variations in mortality in non-pandemic years, and a valid question remains: Would fewer immediate and later deaths have resulted in the absence of the pandemic response?
We conclude that the answer is “yes”. The “covid-peak” was palpably induced by the pandemic response, at a time in the long-term seasonal cycle when there is always a decline in ACM by time. It was followed by an anomalously small mortality for the 85+ years age group, showing that deaths were accelerated in this age group. Likewise, the mortality of young males (0-44 years) has a large increase in the summer-2020, and into the fall, a phenomenon never before seen, which cannot be due to a VRD pathogen.
5. Concluding comments: Missing self-evaluation
We proved that there was no pandemic in the COVID-period in Canada, if the concept of a pandemic means anything. We showed strong evidence that the pandemic response was so aggressive and ill-advised as to have large negative health consequences, identified in ACM by time.
Although there was no pandemic, our analysis of the ACM by time data suggests that the pandemic response in Canada was a reckless and deadly fiasco. Had there been a particularly virulent pathogen, this level of government and institutional negligence, based on the international trend in attitudes and on political motives, would not have been possible.
There is no concrete evidence that the provincial and federal governments have learned any lesson from what was a massive public health blunder. On the contrary, there is every sign that governments continue to have a siloed approach based entirely on vaccine programs and ineffective personal hygiene regulations, while ignoring the science relevant to what actually occurred in Canadian care homes, and while avoiding strategies to start to address what actually occurred, and is occurring.
A first and immediate step should be to trash the pandemic-response methods that were implemented after the WHO’s declaration of a pandemic, and to develop expertise-based national skepticism about such declarations and their accompanying recommendations.
We hope that our analysis will be useful to public health policy reviewers, and that the needed serious in-depth critical review of the government and medical responses will be undertaken, one way or another. We further hope that this will be done with transparency and accountability, and that it will include broad consultations.
*
Note to readers: Please click the share buttons above or below. Follow us on Instagram, @crg_globalresearch. Forward this article to your email lists. Crosspost on your blog site, internet forums. etc.
This article was originally published on denisrancourt.ca.
Prof. Denis Rancourt, Ontario Civil Liberties Association (ocla.ca), [email protected]
Marine Baudin and Jeremie Mercier, Mercier Production (jeremie-mercier.com)
Sources
2021–Borger : Borger, Pieter, Bobby R. Malhotra, Michael Yeadon, Clare Craig, Kevin McKernan, Klaus Steger, Paul McSheehy, et al. 2021. “Addendum to the Corman-drosten Review Report.” OSF Preprints. January 12. doi:10.31219/osf.io/9mjy7. —- https://osf.io/9mjy7/
2021–Chaillot : Chaillot P. « La mortalité en Europe. Comprendre les données de mortalité européenne pour prendre les bonnes décisions. » Mondialisation. Published June 15, 2021. Accessed June 16, 2021. https://www.mondialisation.ca/la-mortalite-en-europe-comprendre-les-donnees-de-mortalite-europeenne-pour-prendre-les-bonnes-decisions/5657446
2021–Clarke : “Impacts of the COVID-19 pandemic in nursing and residential care facilities in Canada”, by Janine Clarke, StatCan (10 June 2021), Catalogue no. 45-28-0001 —- https://www150.statcan.gc.ca/n1/pub/45-28-0001/2021001/article/00025-eng.htm
2021–StatCan : Statistics Canada (2021). Table 13-10-0768-01 Weekly death counts, by age group and sex https://doi.org/10.25318/1310076801-eng (accessed 2 August 2021)
2020–Campbell : Campbell, A. D. (2020) ‘Practical Implications of Physical Distancing, Social Isolation, and Reduced Physicality for Older Adults in Response to COVID-19’, Journal of Gerontological Social Work, pp. 1–3. doi: 10.1080/01634372.2020.1772933. https://pubmed.ncbi.nlm.nih.gov/32501151/
2020–Comas-Herrera : Comas-Herrera, A., Fernandez, J.-L., et al. (2020) ‘COVID-19: Implications for the Support of People with Social Care Needs in England’, Journal of Aging & Social Policy, 32(4–5), pp. 365–372. doi: 10.1080/08959420.2020.1759759. https://pubmed.ncbi.nlm.nih.gov/32497462/
2020–Comas-Herrera : Comas-Herrera, A., Zalakaín, J., et al. (2020) ‘Mortality associated with COVID-19 outbreaks in care homes: early international evidence’. https://ltccovid.org/2020/04/12/mortality-associated-with-covid-19-outbreaks-in-care-homes-early-international-evidence/
2020–Levin : Levin AT, Hanage WP, Owusu-Boaitey N, Cochran KB, Walsh SP, Meyerowitz-Katz G. Assessing the age specificity of infection fatality rates for COVID-19: systematic review, meta-analysis, and public policy implications. Eur J Epidemiol. 2020 Dec;35(12):1123-1138. doi: 10.1007/s10654-020-00698-1. Epub 2020 Dec 8. PMID: 33289900; PMCID: PMC7721859. —- https://www.ncbi.nlm.nih.gov/pmc/articles/PMC7721859/
2020–Morawska : Morawska, L. and Milton, D. K. et al. (239 signatories) (2020) ‘It is Time to Address Airborne Transmission of COVID-19’, Clinical Infectious Diseases. doi: 10.1093/cid/ciaa939. https://www.ncbi.nlm.nih.gov/pmc/articles/PMC7454469/
2020–Rancourt : 20 August 2020 article “Evaluation of the virulence of SARS-CoV-2 in France, from all-cause mortality 1946-2020”, by Rancourt, DG, Baudin, M, and Mercier, J, ResearchGate, DOI: 10.13140/RG.2.2.16836.65920/1 —- https://www.researchgate.net/publication/343775235_Evaluation_of_the_virulence_of_SARS-CoV-2_in_France_from_all-cause_mortality_1946-2020
2020–Rancourt : “All-cause mortality during COVID-19: No plague and a likely signature of mass homicide by government response”, by Rancourt, DG (2 June 2020) ResearchGate. DOI: 10.13140/RG.2.2.24350.77125 https://www.researchgate.net/publication/341832637_All-cause_mortality_during_COVID-19_No_plague_and_a_likely_signature_of_mass_homicide_by_government_response
2020b–Rancourt : “Masks Don’t Work: a Review of Science Relevant to Covid-19 Social Policy”. Rancourt, DG (11 April 2020) ResearchGate, https://vixra.org/abs/2006.0044 –https://denisrancourt.ca/entries.php?id=8&name=2020_04_11_masks_dont_work_a_review_of_science_relevant_to_covid_19_social_policy
2020–Richardson : Richardson, S. et al. (2020) “Presenting Characteristics, Comorbidities, and Outcomes Among 5700 Patients Hospitalized With COVID-19 in the New York City Area”, JAMA. 323(20):2052–2059. doi:10.1001/jama.2020.6775 —- https://jamanetwork.com/journals/jama/fullarticle/2765184
2020–Wu : Wu, B. (2020) ‘Social isolation and loneliness among older adults in the context of COVID-19: a global challenge’, Global Health Research and Policy, 5, p. 27. doi: 10.1186/s41256-020-00154-3. https://pubmed.ncbi.nlm.nih.gov/32514427/
2016–Ong : Ong, A. D., Uchino, B. N. and Wethington, E. (2016) ‘Loneliness and Health in Older Adults: A Mini-Review and Synthesis’, Gerontology, 62(4), pp. 443–449. doi: 10.1159/000441651. https://pubmed.ncbi.nlm.nih.gov/26539997/
2015–Prenderville : Prenderville, J. A. et al. (2015) ‘Adding fuel to the fire: the impact of stress on the ageing brain’, Trends in Neurosciences, 38(1), pp. 13–25. doi: 10.1016/j.tins.2014.11.001. https://pubmed.ncbi.nlm.nih.gov/25705750/
2013–Clegg : Clegg, A. et al. (2013) ‘Frailty in elderly people’, Lancet (London, England), 381(9868), pp. 752–762. doi: 10.1016/S0140-6736(12)62167-9. https://pubmed.ncbi.nlm.nih.gov/23395245/
2013–Steptoe : Steptoe, A. et al. (2013) ‘Social isolation, loneliness, and all-cause mortality in older men and women’, Proceedings of the National Academy of Sciences of the United States of America, 110(15), pp. 5797–5801. doi: 10.1073/pnas.1219686110. https://pubmed.ncbi.nlm.nih.gov/23530191/
2011–Doshi : Doshi P. The elusive definition of pandemic influenza. Bulletin of the World Health Organization. 2011 Jul;89(7):532-538. DOI: 10.2471/blt.11.086173. PMID: 21734768; PMCID: PMC3127275. —- https://europepmc.org/article/pmc/3127275
2010–Utsumi : Momoe Utsumi, Kiyoko Makimoto, Nahid Quroshi, Nobuyuki Ashida, “Types of infectious outbreaks and their impact in elderly care facilities: a review of the literature”, Age and Ageing, Volume 39, Issue 3, May 2010, Pages 299–305, https://doi.org/10.1093/ageing/afq029
2008–Doshi : Peter Doshi, “Trends in Recorded Influenza Mortality: United States, 1900–2004”, American Journal of Public Health 98, no. 5 (May 1, 2008): pp. 939-945. —- https://doi.org/10.2105/AJPH.2007.119933
2007–Cohen : Cohen, S., Janicki-Deverts, D. and Miller, G. E. (2007) ‘Psychological Stress and Disease’, JAMA, 298(14), pp. 1685–1687. doi: 10.1001/jama.298.14.1685. https://pubmed.ncbi.nlm.nih.gov/17925521/
2004–Robertson : Robertson, R. G. and Montagnini, M. (2004) ‘Geriatric failure to thrive’, American Family Physician, 70(2), pp. 343–350. https://pubmed.ncbi.nlm.nih.gov/15291092/
2000–Loeb : “Surveillance for outbreaks of respiratory tract infections in nursing homes”, by Mark Loeb, Allison McGeer, Margaret McArthur, Rosanna W. Peeling, Martin Petric and Andrew E. Simor. CMAJ April 18, 2000 162 (8) 1133-1137 —- https://www.cmaj.ca/content/162/8/1133
1997–Cohen : Cohen, S. et al. (1997) ‘Social Ties and Susceptibility to the Common Cold’, JAMA, 277(24), pp. 1940–1944. doi: 10.1001/jama.1997.03540480040036. https://pubmed.ncbi.nlm.nih.gov/9200634/
1996–Gibbs : “What is Occam’s Razor?” Original by Phil Gibbs 1996. Updated 1997 by Sugihara Hiroshi. https://math.ucr.edu/home/baez/physics/General/occam.html (accessed 27 July 2021).
1991–Cohen : Cohen, S., Tyrrell, D. A. J. and Smith, A. P. (1991) ‘Psychological Stress and Susceptibility to the Common Cold’, New England Journal of Medicine. Massachusetts Medical Society, 325(9), pp. 606–612. doi: 10.1056/NEJM199108293250903. https://pubmed.ncbi.nlm.nih.gov/1713648/
Notes
[1] See: “COVID” section, Denis Rancourt’s website: https://denisrancourt.ca/categories.php?id=1&name=covid(accessed on 5 August 2021).
[2] “Montreal police, coroner investigating owner of seniors’ residence where 31 died in less than 1 month” by Colin Harris · CBC News · Posted: Apr 12, 2020 12:56 PM ET | Last Updated: April 13, 2020 (accessed 6 August 2021). https://www.cbc.ca/news/canada/montreal/covid-19-private-seniors-home-dorval-chsld-herron-1.5530327
[3] “Military report reveals what sector has long known: Ontario’s nursing homes are in trouble” by Adam Carter · CBC News · Posted: May 27, 2020 4:00 AM ET | Last Updated: May 27, 2020 (accessed 6 August 2021). https://www.cbc.ca/news/canada/toronto/military-long-term-care-home-report-covid-ontario-1.5585844
[4] Décret N° 2020-293 Du 23 Mars 2020 Prescrivant Les Mesures Générales Nécessaires Pour Faire Face à l’épidémie de Covid-19 Dans Le Cadre de l’état d’urgence Sanitaire.; 2020. https://www.legifrance.gouv.fr/loda/id/LEGIARTI000041767762/2020-03-29/
[5] “The Great VIRAL Debate: Dr Rancourt’s Closing Statement” by Denis Rancourt, Off-Guardian (10 November 2020) (Accessed on 6 August 2021). https://off-guardian.org/2020/11/10/the-great-viral-debate-dr-rancourts-closing-statement/
Featured image is from Children’s Health Defense
Appendix: ACM/w normalized by population, and comparisons
In this appendix, we show various plots of ACM/w, normalized by population, and various plots comparing ACM/w data, by province, and by age group.
Statistics Canada (StatCan) is the national statistical office of the country. The all-cause mortality (ACM) and the population (pop) data used in this appendix were retrieved from the StatCan database. The following table shows the characteristics of the data:
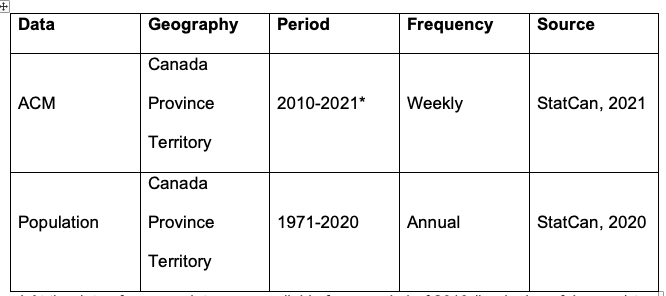
*At the date of access, data were available from week-1 of 2010 (beginning of January) to week-17 of 2021 (end of April). In the following figures, we show the data until week-12 of 2021 (end of March), because the data are not consolidated in later weeks, which gives a large artifact (anomalous drop in mortality).
Moreover, data can be retrieved by sex (males/females) or by age group. For the population data, the age groups are year by year from 0 to 99 years-old, and the last group is 100 years-old and over. For the ACM data, the age groups are as follows:
- 0-44 years-old
- 45-64 years-old
- 65-84 years-old
- 85 years-old and over
The population is estimated on July 1st of each year. The ACM/w of one calendar year has been normalized by the population of that calendar year (ACM/pop/w). The only exception is the year 2021, as there are no population estimates for that year, the ACM/w has been normalized by the population estimates for 2020.
Sources
2021–StatCan : Statistics Canada (2021). Table 13-10-0768-01 Weekly death counts, by age group and sex https://doi.org/10.25318/1310076801-eng (accessed 2 August 2021)
2020–StatCan : Statistics Canada (2020). Table 17-10-0005-01 Population estimates on July 1st, by age and sex https://doi.org/10.25318/1710000501-eng (accessed 31 July 2021)
Appendix Figures
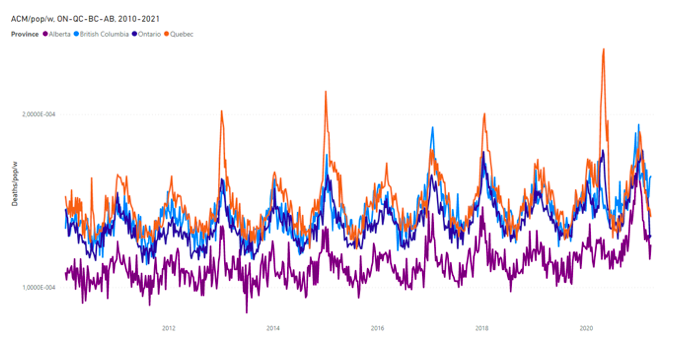
Figure A1: All-cause mortality by population by week in Ontario, Quebec, British Columbia and Alberta from 2010 to 2021. Data are displayed from January 2010 to March 2021. Data were retrieved from StatCan (StatCan, 2020 and 2021).

Figure A2: All-cause mortality by population by week in Ontario and British Columbia from 2010 to 2021. Data are displayed from January 2010 to March 2021. Data were retrieved from StatCan (StatCan, 2020 and 2021).

Figure A3: All-cause mortality by population by week in Ontario and Quebec from 2010 to 2021. Data are displayed from January 2010 to March 2021. Data were retrieved from StatCan (StatCan, 2020 and 2021).
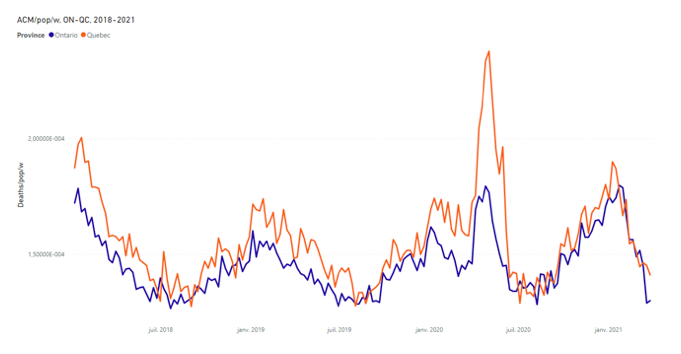
Figure A4: All-cause mortality by population by week in Ontario and Quebec from 2018 to 2021. Data are displayed from January 2018 to March 2021. Data were retrieved from StatCan (StatCan, 2020 and 2021).
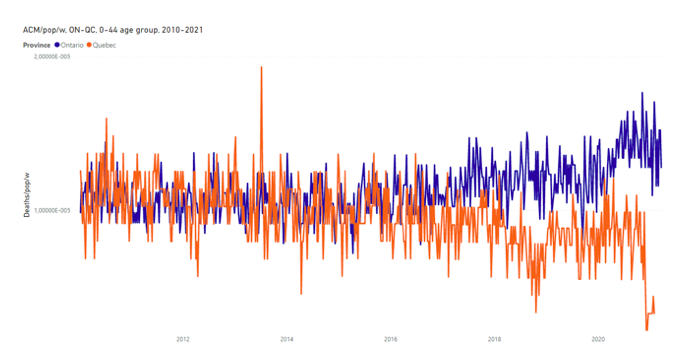
Figure A5: All-cause mortality by population by week in Ontario and Quebec for the 0-44 age group, both sexes, from 2010 to 2021. Data are displayed from January 2010 to March 2021. Data were retrieved from StatCan (StatCan, 2020 and 2021).
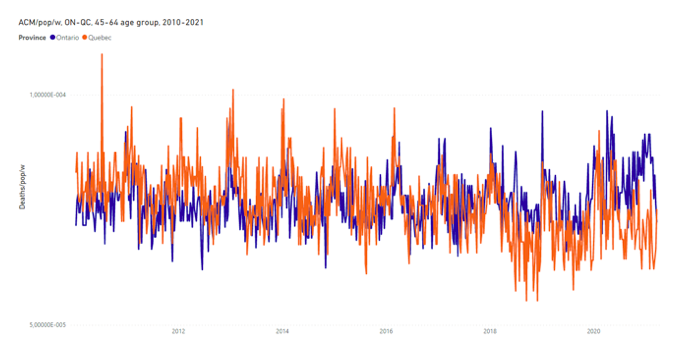
Figure A6: All-cause mortality by population by week in Ontario and Quebec for the 45-64 age group, both sexes, from 2010 to 2021. Data are displayed from January 2010 to March 2021. Data were retrieved from StatCan (StatCan, 2020 and 2021).
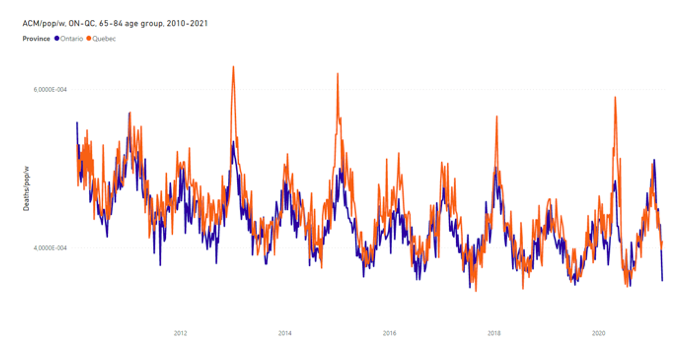
Figure A7: All-cause mortality by population by week in Ontario and Quebec for the 65-84 age group, both sexes, from 2010 to 2021. Data are displayed from January 2010 to March 2021. Data were retrieved from StatCan (StatCan, 2020 and 2021).

Figure A8: All-cause mortality by population by week in Ontario and Quebec for the 85+ age group, both sexes, from 2010 to 2021. Data are displayed from January 2010 to March 2021. Data were retrieved from StatCan (StatCan, 2020 and 2021).

Figure A9: All-cause mortality by week in Canada by age group, both sexes, from 2010 to 2021. Data are displayed from January 2010 to March 2021. Data were retrieved from StatCan (StatCan, 2021).
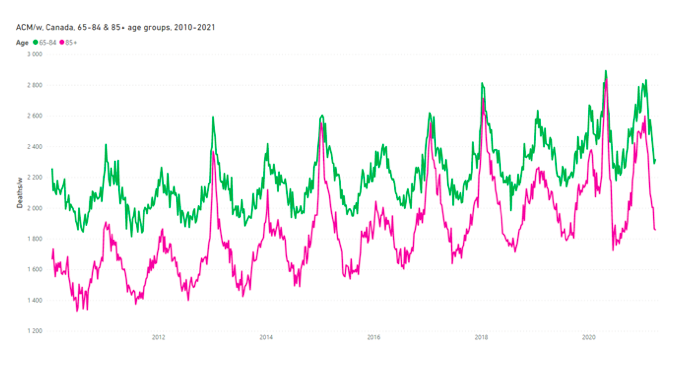
Figure A10: All-cause mortality by week in Canada for the 65-84 and 85+ age groups, both sexes, from 2010 to 2021. Data are displayed from January 2010 to March 2021. Data were retrieved from StatCan (StatCan, 2021).
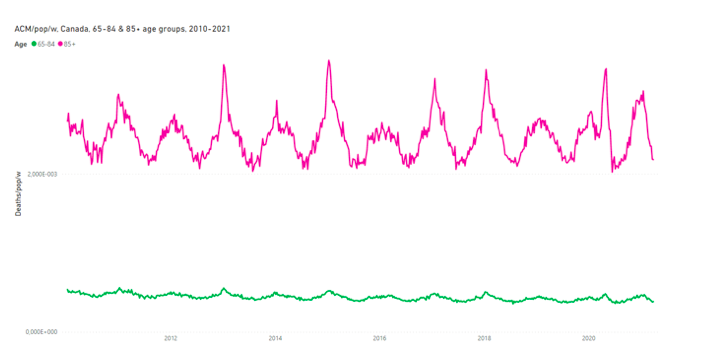
Figure A11: All-cause mortality by population by week in Canada for the 65-84 and 85+ age groups, both sexes, from 2010 to 2021. Data are displayed from January 2010 to March 2021. Data were retrieved from StatCan (StatCan, 2020 and 2021).

Figure A12: All-cause mortality by population by week in Canada for the 65-84 age group, both sexes, from 2010 to 2021. Data are displayed from January 2010 to March 2021. Data were retrieved from StatCan (StatCan, 2020 and 2021).
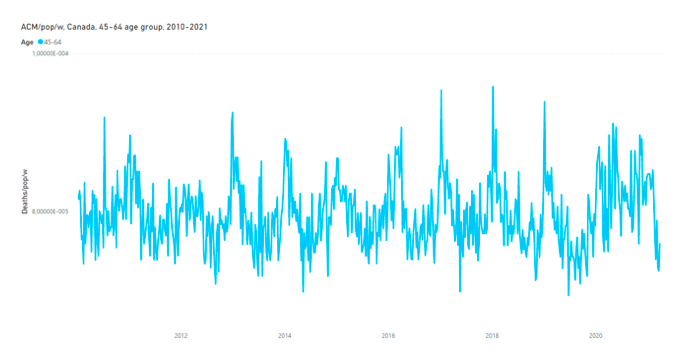
Figure A13: All-cause mortality by population by week in Canada for the 45-64 age group, both sexes, from 2010 to 2021. Data are displayed from January 2010 to March 2021. Data were retrieved from StatCan (StatCan, 2020 and 2021).
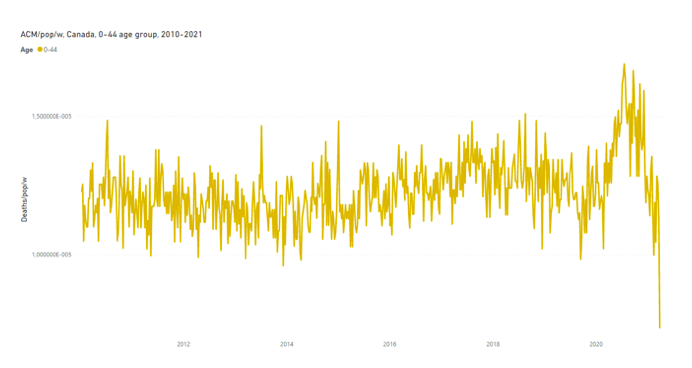
Figure A14: All-cause mortality by population by week in Canada for the 0-44 age group, both sexes, from 2010 to 2021. Data are displayed from January 2010 to March 2021. Data were retrieved from StatCan (StatCan, 2020 and 2021).