


All Global Research articles can be read in 51 languages by activating the Translate Website button below the author’s name.
To receive Global Research’s Daily Newsletter (selected articles), click here.
Follow us on Instagram and Twitter and subscribe to our Telegram Channel. Feel free to repost and share widely Global Research articles.
***
Abstract
It is now well established from autopsy studies and adverse effect monitoring that the COVID-19 vaccines can cause death. The vaccine-dose fatality rate (vDFR), which is the ratio of vaccine-induced deaths to vaccine doses delivered in a population, has recently been measured by us to be as large as 1 % in India and when “vaccine equity” campaigns were applied in high-poverty states of the USA, and to be 0.05 % in Australia, with data that is not discriminated by age group. Here, we provide the first empirical evaluations of age‑stratified vDFRs, using national all-cause mortality and vaccine rollout data, for Israel and Australia. We find that the vDFR increases dramatically with age for older adults, being exponential with a doubling time of approximately 5.2 ± 0.4 years. As a result the vDFR is an order of magnitude greater in the most elderly population than the all-population value, reaching 0.6 % for the 80+ years age group in Israel and 1 % for the 85+ years age group in Australia, compared to < 0.01 % for young adults (< 45 year olds). Our results imply that it was reckless to prioritise vaccinating those deemed to be in greatest need of protection.
*
It is well established that the COVID-19 vaccines can cause death, as seen from:
- detailed autopsy studies (Choi et al., 2021; Schneider et al., 2021; Sessa et al., 2021; Gill et al., 2022; Mörz, 2022; Schwab et al., 2022; Suzuki et al., 2022; Tan et al., 2022; Yoshimura et al., 2022; Onishi et al., 2023),
- adverse effect monitoring (Hickey and Rancourt, 2022),
- a recent survey study (Skidmore, 2023),
- studies of vaccine-induced pathologies (e.g., Goldman et al., 2021; Kuvandik et al., 2021; Turni and Lefringhausen, 2022; Edmonds et al., 2023; Wong et al., 2023), and
- more than 1,250 peer-reviewed publications about COVID-19 vaccine adverse effects (React 19, 2022).
In particular, a study of the Vaccine Adverse Event Reporting System (VAERS) data for the USA showed that the COVID-19 injections can be understood as individual challenges to the body, and that “toxicity by dose” is a good first-order model of the phenomenon for the adverse effect of death (Hickey and Rancourt, 2022). An exponential increase of lethality with median age of those dying following injection was observed (Hickey and Rancourt, 2022).
There is also the known vaccine injury compensation programmes of states worldwide, which include death resulting from the COVID-19 vaccines (Mungwira et al. 2020; Wood et al., 2020; Crum et al., 2021; Kamin-Friedman and Davidovitch, 2021). Japan, Canada and the UK have granted compensation for COVID‑19 vaccine induced deaths (The Japan Times, 26 July 2022; Corbett, 6 September 2022; Wise, 2022).
We are pursuing a research program to quantify the vaccine-dose fatality rate (vDFR), which is the ratio of vaccine-induced deaths to vaccine doses delivered in a population. We do this at the population level of states, using epidemiological methods applied to all-cause mortality (ACM) and vaccine rollout data, by time (day, week, month), by jurisdiction and by age group (Rancourt et al., 2022a; Rancourt et al., 2022b; Rancourt, 2022).
Here we report our first age-stratification results.
We recently demonstrated that the COVID-19 vaccine rollouts caused significant increases in mortality in India, the USA, Australia, and Canada (see Rancourt et al., 2022a; and references therein).
Rancourt showed that the vaccine rollout in India (350 million doses) synchronously caused 3.7 million excess deaths, corresponding to a vDFR of 1 %; and provided comprehensive reasons for concluding a causal relation to the vaccine rollout rather than coincidence involving other causes (Rancourt, 2022).
Our work on the Australian data established a non-age-stratified (all-population) mean vDFR of 0.05 %, in a phenomenon of step-wise increase in mortality synchronous with the vaccine rollout, which was also present in each of the eight states of Australia and in each of the age groups of the most elderly residents (Rancourt et al., 2022a).
Such determinations of vDFR are possible — despite the inherent difficulty in assigning cause to excess mortality, especially despite the difficulty in discerning excess mortality caused by the imposed pandemic-response conditions (or “COVID-19 conditions”) — in two kinds of circumstances:
- Jurisdictions in which there is essentially no measurable excess integrated ACM in the pre-vaccination period of the declared pandemic (typically 11 March 2020 to 1 January 2021),[1] followed by a large and sudden step-wise increase in ACM by time, synchronous with the vaccine rollout in the jurisdiction, and sustained through multiple-dose cycles of vaccination (e.g., Australia, India, Israel).
- Cases in which a specific vaccine rollout (e.g., first booster in Australia, “vaccine equity” campaign in the USA, first-dose in Ontario) is synchronous with an anomalous peak in ACM, which is not confounded by occurring at a seasonal peak position inferred from the historic trend.
In all these cases, which we have studied, the vaccine rollouts occur at significantly different times, for different jurisdictions and age groups, yet are always synchronous with the step-wise increases and anomalous peaks in ACM. In this regard, the graphs in our most recent paper and its appendices are compelling (Rancourt et al., 2022a; their figures 1A through 1D, 2, 4, 6A through 6D, 7, 8 and 9; their appendix figures A1-F1 (9 panels) and A2-F1), as are the graphs for India (Rancourt, 2022).
In addition, the all‑population vDFRs, for individual states and for individual anomalous peaks in ACM, are all comparable in magnitude, in the range of approximately 0.03 % − 1 % (Rancourt et al., 2022a ; Rancourt et al., 2022b ; Rancourt, 2022).
The robust criteria described by Ioannidis (2016) for proving causality are amply satisfied:
- Experiment: The same phenomenon is independently observed in distinct jurisdictions, for distinct age groups, and at different times, which constitutes ample verification in independent real-world large-scale experiments.
- Temporality: The many step-wise increases and anomalous peaks in ACM are synchronous with vaccine rollouts, and the peaks in ACM have the same shapes and widths as the synchronous peaks in vaccine dose delivery by time; including in jurisdictions in which excess integrated mortality did not occur until vaccination was implemented after approximately one year of the declared pandemic.
- Consistency: The phenomenon is qualitatively the same and of comparable magnitude in each occasion in which it is observed.
Here, we perform the age-stratification analysis for Australia, and we add Israel.
Our method for quantification of vDFR by age group (or all-population) is as follows (Rancourt et al., 2022a):
- Plot the ACM by time (day, week, month) for the age group (or all-population) over a large time scale, including the years prior to the declared pandemic.
- Identify the date (day, week, month) of the start of the vaccine rollout (first dose rollout) for the age group (or all-population).
- Note, for consistency, that the ACM undergoes a step-wise increase to larger values at the date of the start of the vaccine rollout.
- Integrate (add) ACM from the start of the vaccine rollout to the end of available data or end of vaccinations (all doses), whichever comes first. This is the basic integration time window used in the calculation, start to end dates.
- Apply this window and this integration over successive and non-overlapping equal-duration periods, moving as far back as the data permits.
- Plot the resulting integration values versus time, and note, for consistency, that the value has an upward jog, well discerned from the historic trend or values, for the vaccination period.
- Extrapolate the historic trend of integrated values into the vaccination period. The difference between the measured and extrapolated (historic trend predicted) integrated values of ACM in the vaccination period is the excess mortality associated with the vaccination period.
- The extrapolation, in practice, is achieved by fitting a straight line to chosen pre-vaccination-period integration points.
- If too few points are available for the extrapolation, giving too large an uncertainty in the fitted slope, then impose a slope of zero, which amounts to using an average of recent values. In some cases, even a single point (usually the point for the immediately preceding integration window) can be used.
- The error in the extrapolated value is overwhelmingly the dominant source of error in the calculated excess mortality. Estimate the “accuracy error” in the extrapolated value as the mean deviation of the absolute value difference with the fitted line (mean of the absolute values of the residuals) for the chosen points of the fit. This error is a measure of the integration-period variations from all causes over a near region having an assumed linear trend.
- Apply the same integration window (start to end dates during vaccination) to count all vaccine doses administered in that time.
- Define vDFR = (vaccination-period excess mortality) / (vaccine doses administered in the same vaccination period). Calculate the uncertainty in vDFR using the estimated error in vaccination-period excess mortality.
The same method can be adapted to any region of interest of sub-annual duration, by translating the window of integration (of the region of interest) backwards by increments of one year.
The above-described method is robust and ideally adapted to the nature of ACM data. Integrated ACM has a small statistical error. The large time-wise integration window removes difficulties arising from intrinsic seasonal variations. The historic trend is analysed without introducing any model assumptions or uncertainties beyond assuming that the near trend can be modelled by a straight line, where justified by the data itself. Such an analysis, for example, takes into account year to year changes in age-group cohort size arising from the age structure of the population. The only presumption is that a locally linear near trend for the unperturbed (ACM-wise unperturbed) population is realistic.
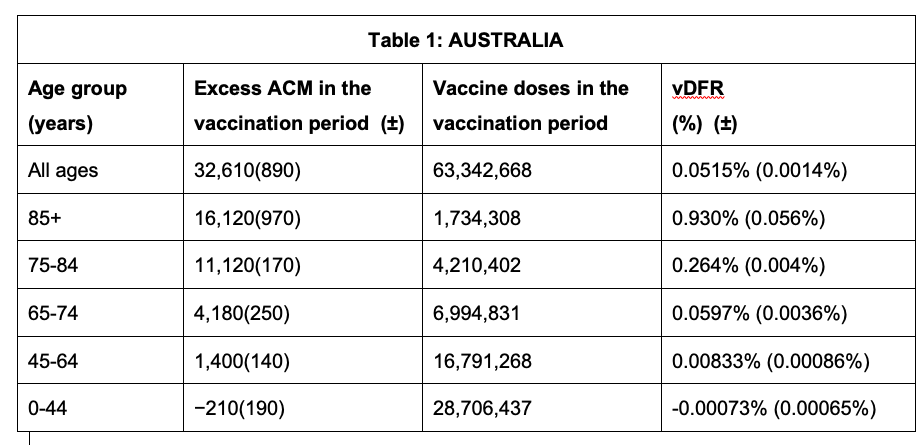
The calculation of the excess ACM by age group and for all-population for Australia is illustrated in Figure 1 (age groups as indicated in the figure), as follows. We used the three points sequentially preceding the vaccination period and imposed a horizontal line (zero slope of the fitted straight line), throughout (Figure 1).
The details such as sources of official data, start and end points of integration, and methods for matching ACM and vaccine rollout data by age group, are provided in Appendix 1.
The integration period for Australia was fine-tuned and updated ACM data was implemented (see Appendix 1), compared to our previous analysis (Rancourt et al., 2022a), and the results are essentially identical.
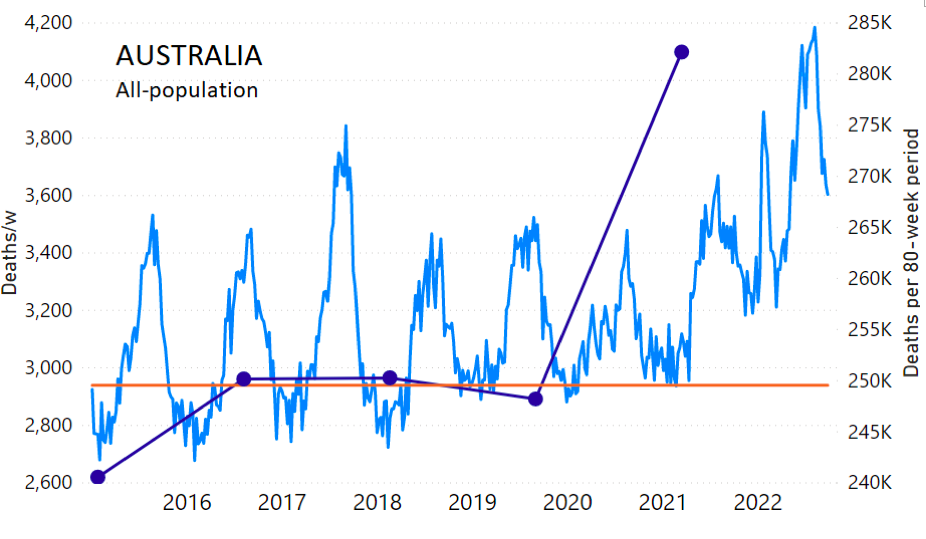
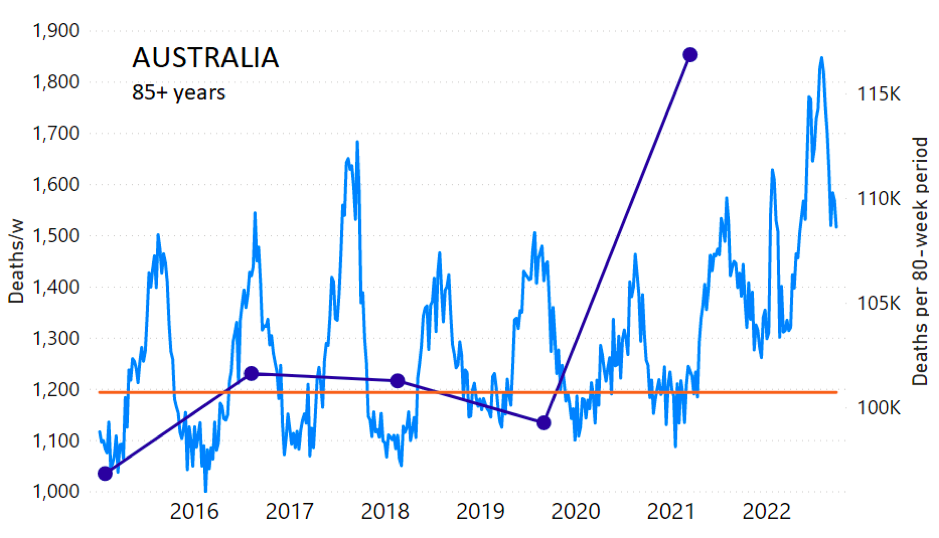
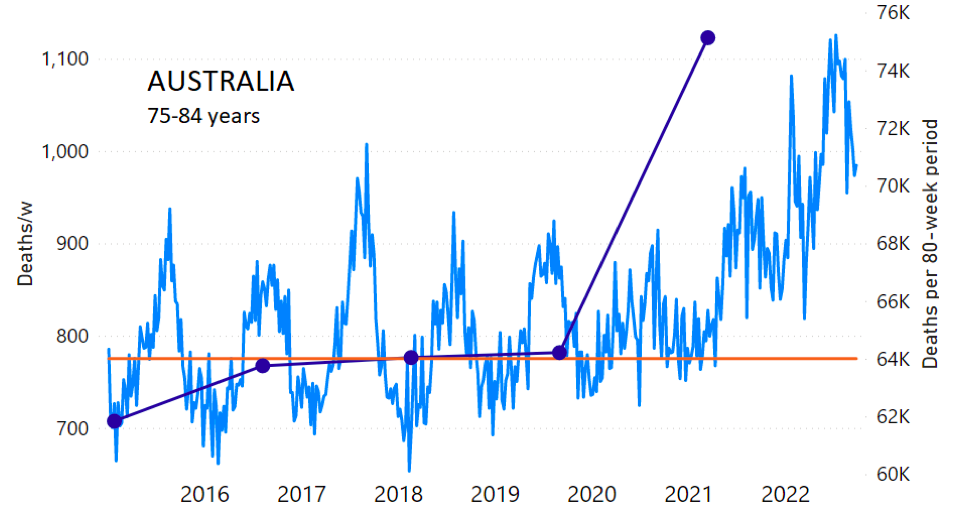
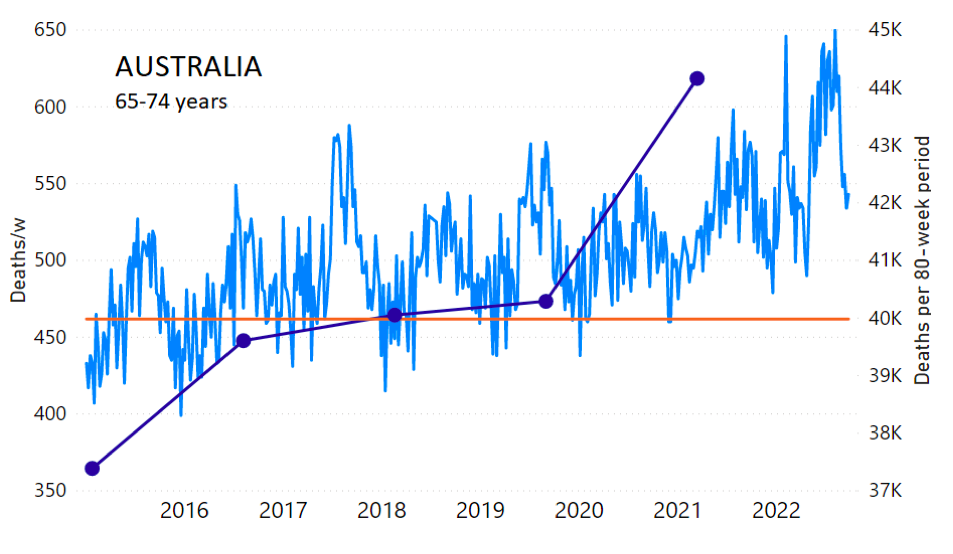
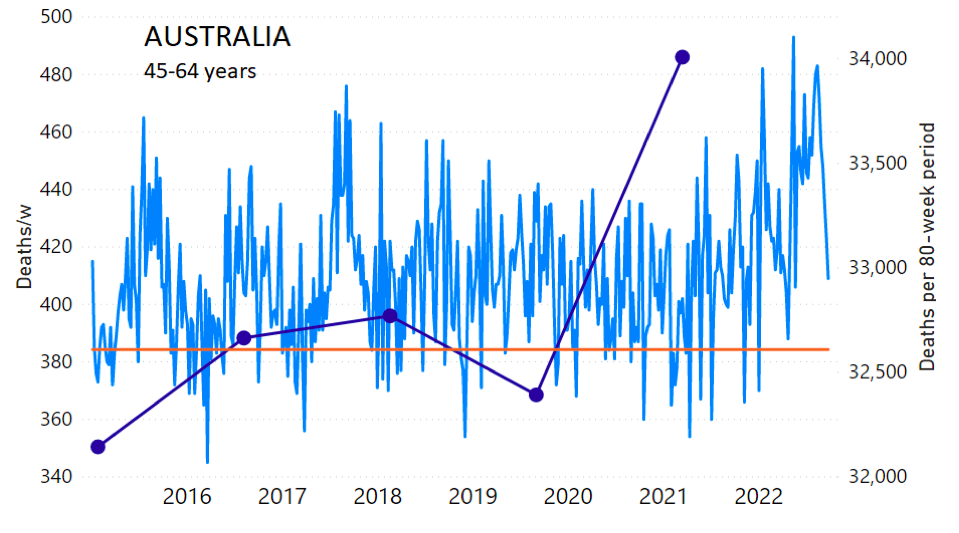
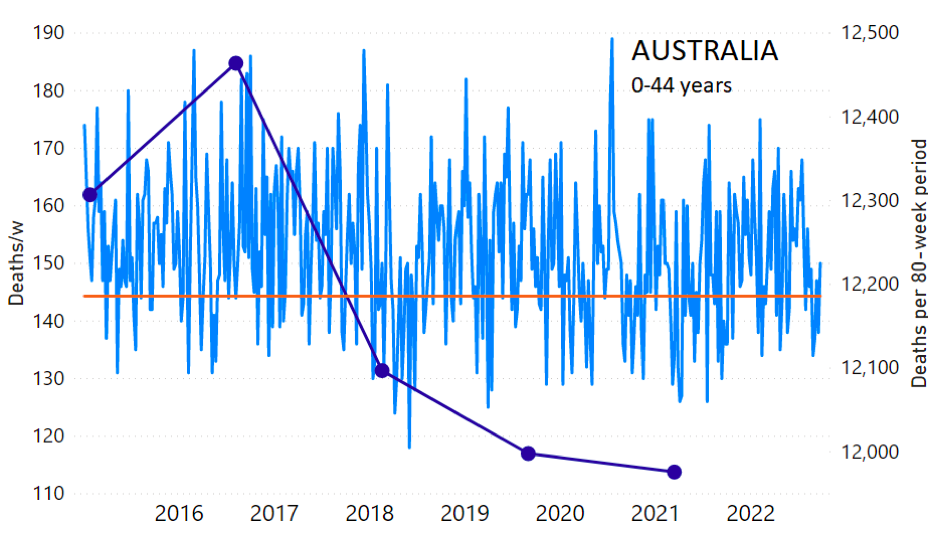
Figure 1: Australia, 2015-2022, by age group as indicated. ACM by week (light blue); integrated ACM by 80-week vaccination-period integration window (dark blue, points), the last point being for the actual vaccination period itself; extrapolation line used to calculate the excess ACM in the vaccination period (orange). See the text for a description of the method, and Appendix 1 for details.
The youngest age group for Australia (0-44 years, Figure 1) shows our chosen extrapolation method not to be optimally suited to the ACM trend, however, in this age group the ACM is small, so this makes little difference. Furthermore, our method here automatically ensures that this difficulty is reflected in a larger estimated error, which is propagated to the calculated excess ACM.
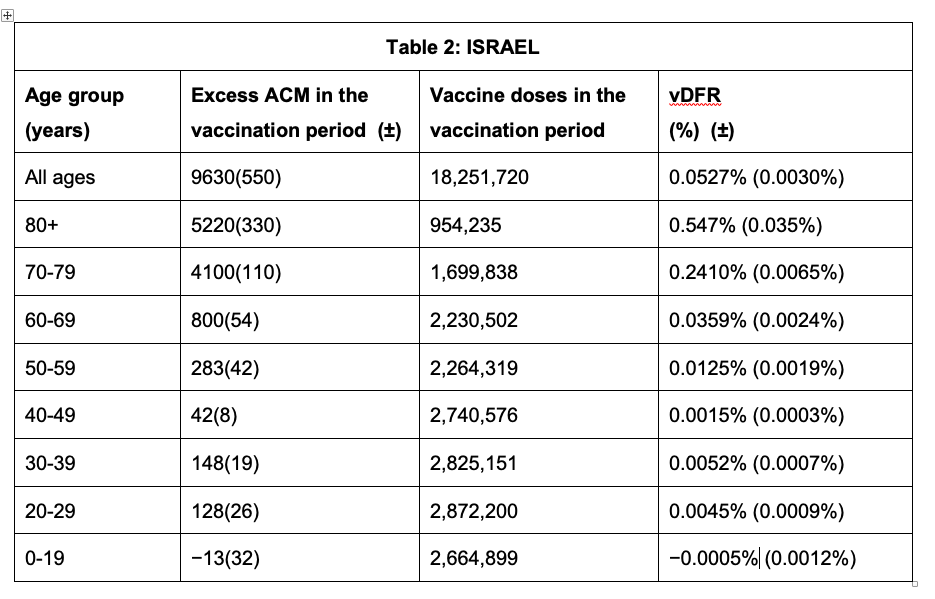
We do the same for Israel. The calculation of the excess ACM by age group and for all‑population for Israel is illustrated in Figure 2 (age groups as indicated in the figure), as follows. Here we chose to use different sets of points to use in the extrapolation, as described in Appendix 1, and as can be surmised from Figure 2 itself.
In this way, we account for the different historical trends in ACM that occur in the different age groups for Israel, and we avoid the point immediately preceding the vaccination period where it appears to include a significant excess mortality in the pre‑vaccination period of the declared pandemic.
The details such as sources of official data, start and end points of integration, and methods for matching ACM and vaccine rollout data by age group, are provided in Appendix 1.
In terms of specific features in ACM by time, examples of synchronicity between ACM peaks and vaccine dose rollouts for Israel are shown in Appendix 2.
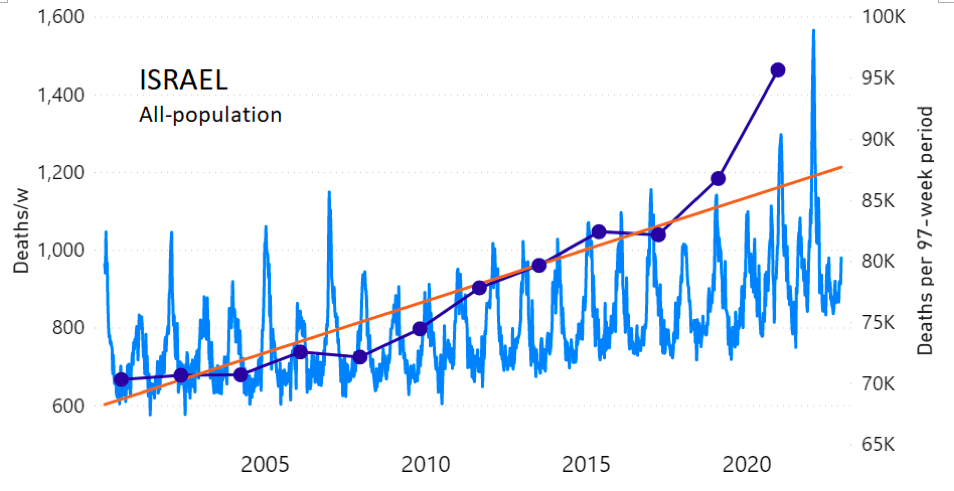
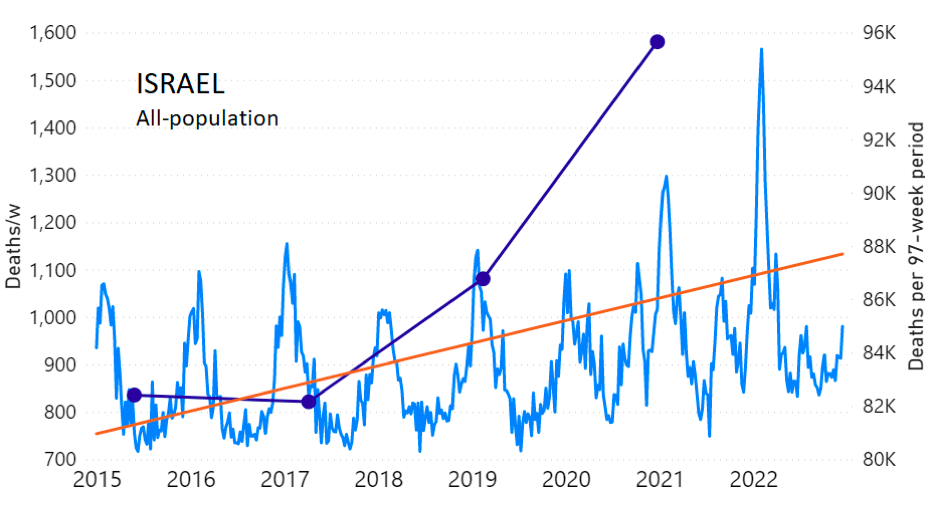
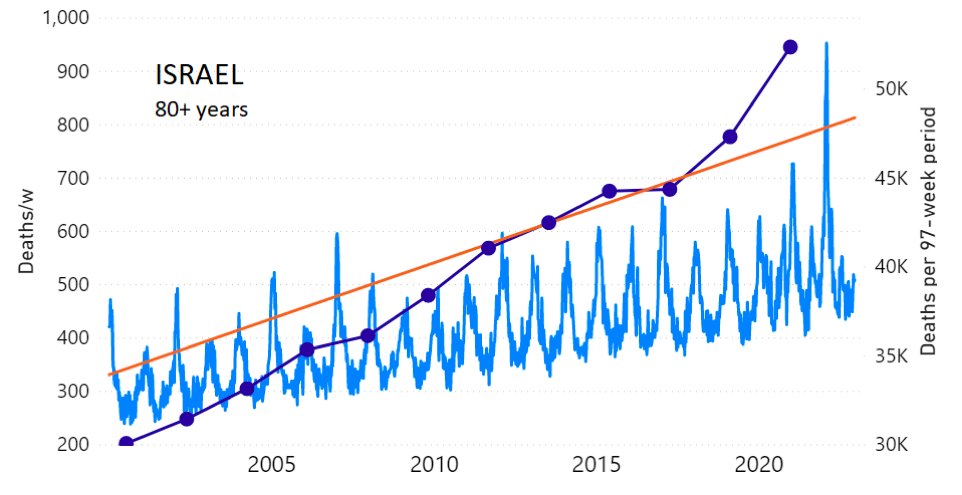
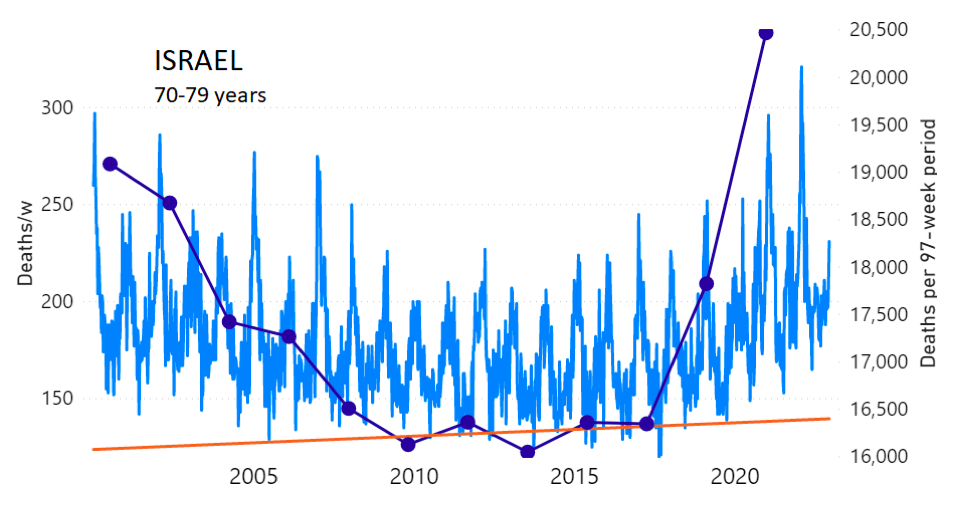
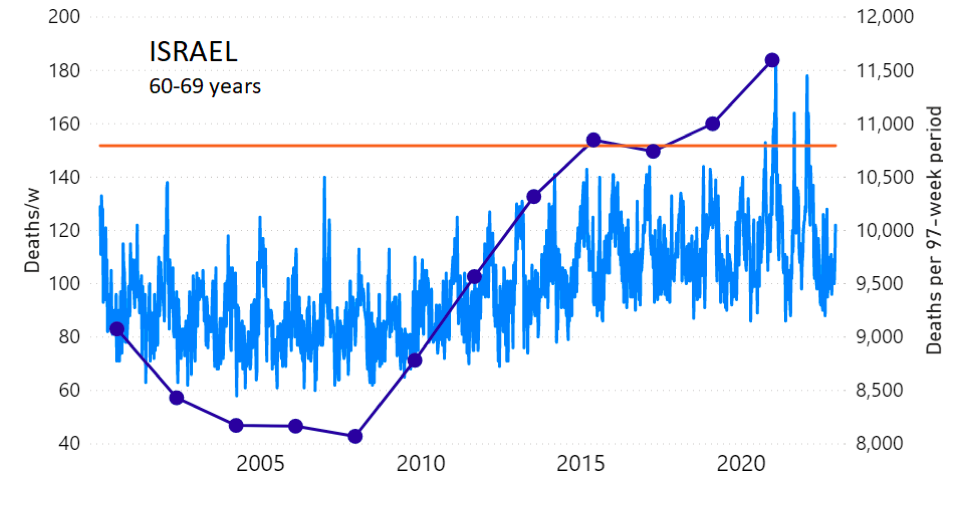
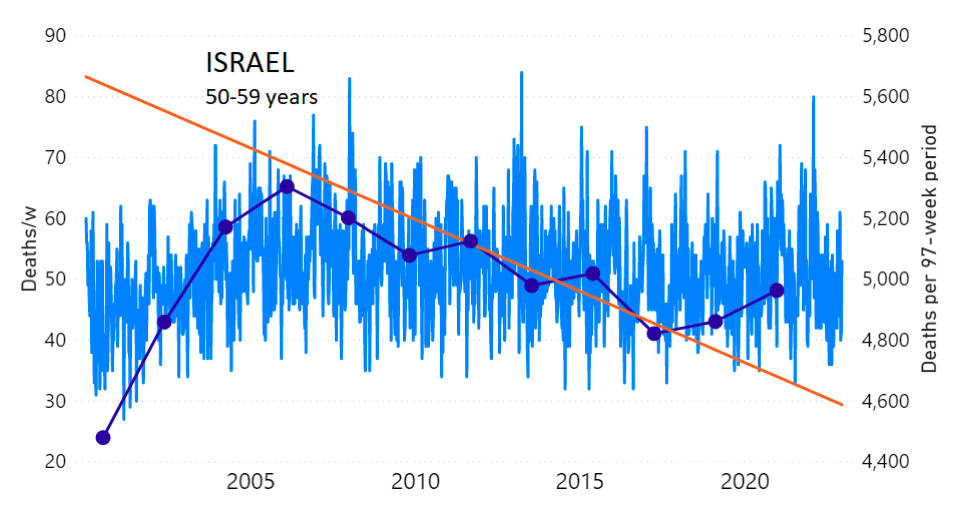
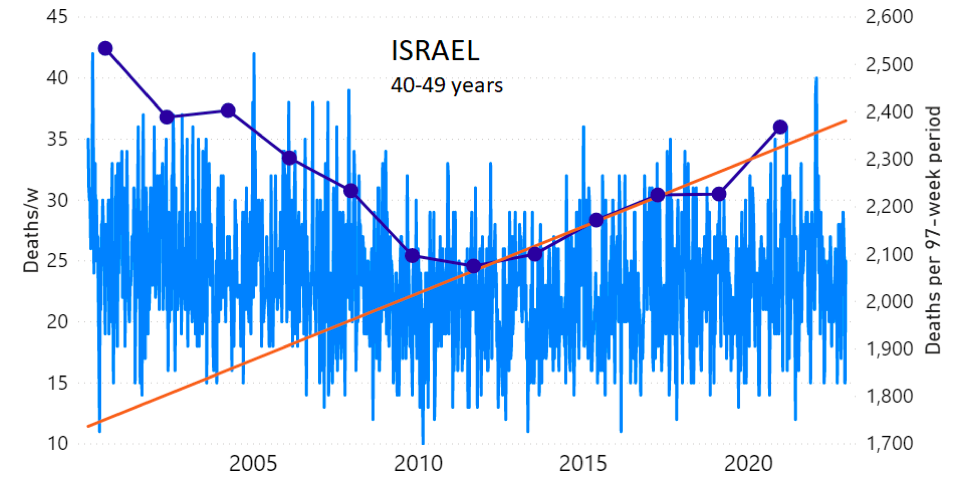
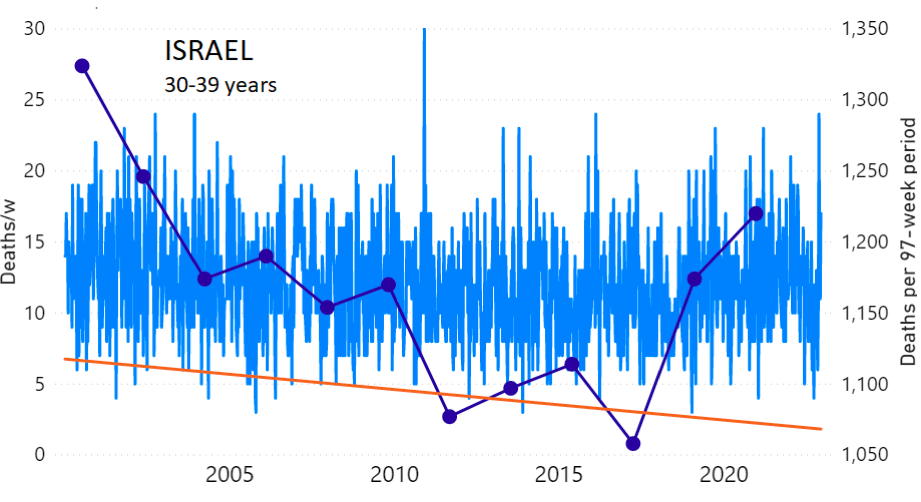
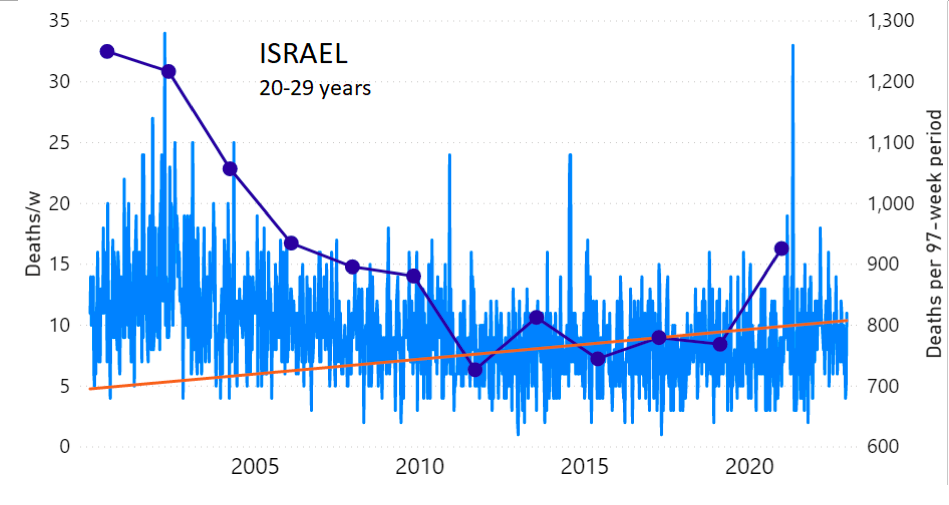
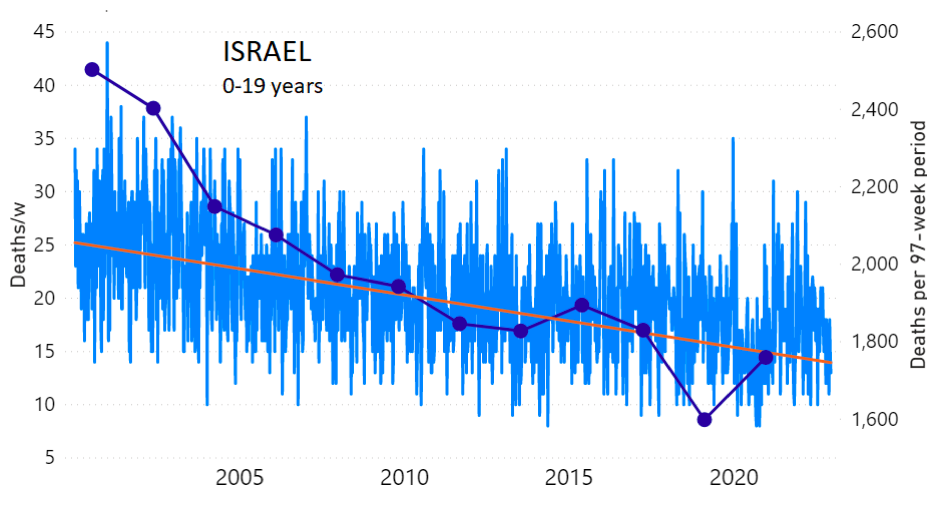
Figure 2: Israel, 2000-2022, by age group as indicated; and on expanded time axis 2015-2022 for all-population, as indicated. ACM by week (light blue); integrated ACM by 97-week vaccination-period integration window (dark blue, points), the last point being for the actual vaccination period itself; extrapolation line used to calculate the excess ACM in the vaccination period (orange). See the text for a description of the method, and Appendix 1 for details.
For Israel (Figure 2), although there is necessarily a degree of arbitrariness in the choice of the points to include in the linear regression, this does not significantly affect the results since:
- The effect (age-stratified excess ACM in the vaccination period) is large enough not to be sensitive to the said arbitrariness.
- The integrated ACM for the vaccination period is generally significantly and anomalously greater than its value for the immediately preceding integration period.
- Essentially the same result (age-stratified excess ACM in the vaccination period) occurs if we use the simplest possible method of taking the extrapolated vaccination-period ACM to be equal to the value for the immediately preceding point, which amounts to removing mortality occurring pre-vaccination in the pandemic period while assuming a locally constant trend in integrated ACM.
Tables 1 and 2 give the resulting age-stratified (and all-population) vDFR values for Australia and Israel, respectively. See Appendix 1 for details.
The results from Tables 1 and 2 are plotted in Figure 3, with exponential fits, both on linear and logarithmic scales for vDFR.
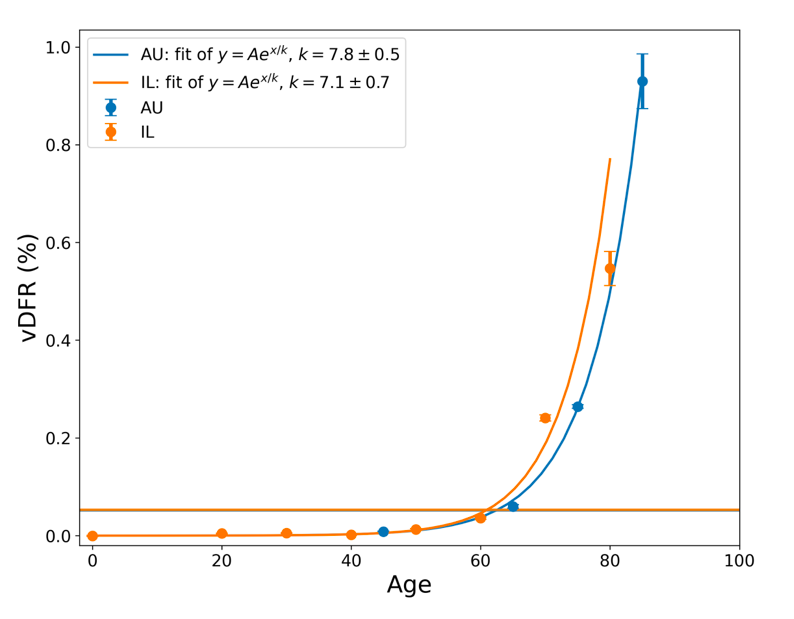
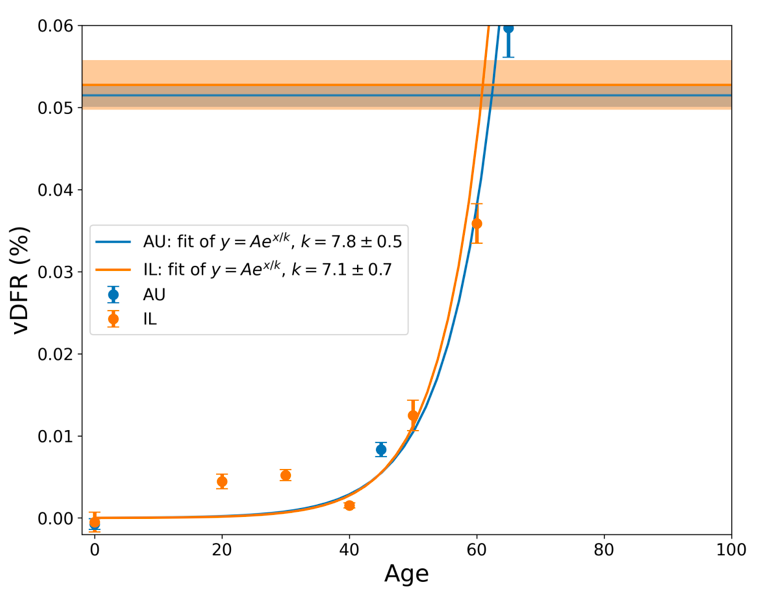
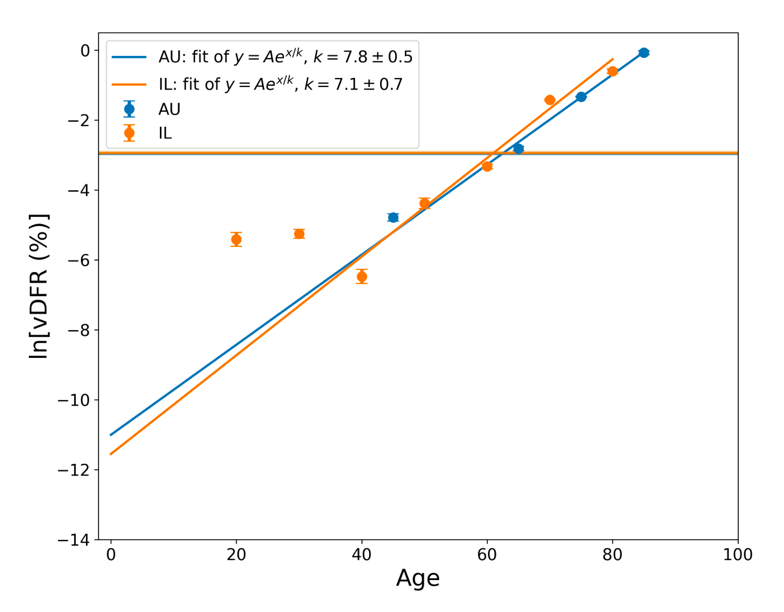
Figure 3: vDFR, which is the ratio of vaccine-induced deaths to vaccine doses delivered in the population of the specified age group, versus age for Israel (orange) and Australia (blue), on full (top) and expanded (middle) linear scales, and with semi-log scale (bottom). Horizontal bands are for the all‑population values of vDFR. The age (X-axis value, years) assigned to a given age group is the starting age of the window of ages for the age group.
In Figure 3, the age (X-axis value, in years) assigned to a given age group is the starting age of the window of ages for the age group. This particular choice makes little difference because translating the x values by any constant number, for example, does not affect the doubling time obtained by fitting an exponential function, and only slightly affects the y intercept at x = 0 (the prefactor in the exponential).
The fitted exponentials (Figure 3) are of the form:
y = A exp( x / k ) or
vDFR = A exp( Age / k )
where A is the prefactor.
The doubling time (T2) is related to k as:
T2 = k ln(2).
The fitted values of k (and T2) are:
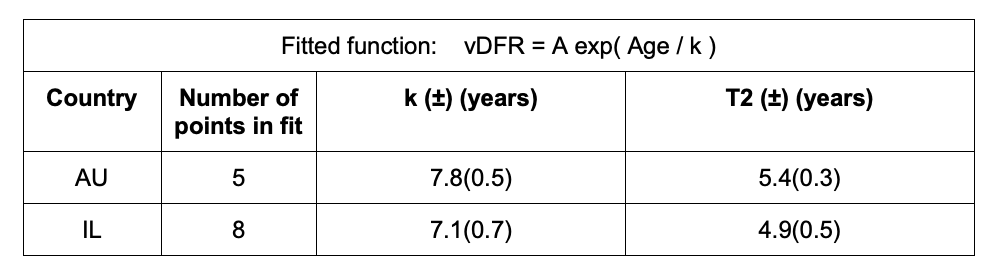
This doubling time by age of approximately 5 years for risk of dying per injection of the COVID-19 vaccines is approximately half of the doubling time by age of 10 years for risk of dying per year of all causes in a modern human population, and of the main old-age diseases cancer, pneumonia and heart disease (Strekler and Mildvan, 1960). This implies a toxicity effect rather than simply inducing death by old age.
Furthermore, there is a non-exponential constant vDFR for young adults (vDFR ≈ 0.005 %, 20-40 years, Figure 3, Table 2). This suggests an accidental mechanism of death with a constant probability for these ages. One might postulate, for example, that vDFR is a product of a constant (age-independent) probability of accidental intra-vascular injection and a constant probability of death given intra-vascular injection. One might further postulate that one or both of these probabilities is larger in athletes with highly developed vascular systems and rapid circulatory rates (Cadegiani, 2022; Klein et al., 2022).
Our all-population value of vDFR of approximately 0.05 % (Figure 3, Tables 1 and 2) implies that in the USA, following the administration of approximately 670 million COVID-19 vaccine doses to date (669.60 million doses, up to 31 January 2023, Our World in Data),[2] approximately 330,000 USA residents would have died from the COVID-19 vaccines (1 in 1,000 on a population basis), assuming that elderly and vulnerable individuals are not more abundant or more aggressively targeted than in Australia or Israel. This number is comparable to the 278,000 fatalities found by Skidmore (2023) in his survey study for the USA. Our number of 330,000 is probably an underestimate, in light of the exponential dependence of vDFR with age that we have demonstrated and the known exceptionally large pools of highly vulnerable residents in the USA (Rancourt et al., 2022b).
Most importantly and concretely, our results establish a large vDFR in elderly people, as large as the 1 % measured for India when frail elderly people and patients with comorbidities were targeted (Rancourt, 2022), and when the same was presumably done in the high-poverty states of the USA, under the banner of vaccine equity programmes (Rancourt et al., 2022b).
The public health notion that elderly and vulnerable individuals must be prioritized for COVID-19 vaccination assumes:
- a constant age-independent vDFR
- a small value of the vDFR optimistically estimated from managed trials, funded by the pharmaceutical industry
Our research shows that both assumptions (i and ii) are false, and far from reality in the field, on the scale of nations.
The said public health notion has always been baseless since it was not anchored in any sufficient evaluation of age-stratified risk of fatality from the injection (e.g., Veronese et al., 2021; Abbatecola et al., 2022; Gao et al., 2022), and is now proven to be contrary to reality. Prioritizing elderly people for vaccination, in the absence of relevant data, was reckless. Norway may be the only jurisdiction that immediately and publicly recognized a problem and changed its policy regarding vaccinating the most elderly and frail (Reuters, 18 January 2021; Fortune, 15 January 2021).
Some readers will be tempted to compare our results (Figure 3) with published age‑stratified COVID-19 infection fatality rates (IFR) (e.g., COVID-19 Forecasting Team, 2022; Pezzullo et al., 2023). While in principle this is a correct approach of risk-benefit analysis, we believe that the IFR studies are not reliable, for the following reasons:
- The deaths in the numerator of IFR are “COVID-19 deaths”, and this cause of death assignation is susceptible to bias and is highly uncertain (e.g., Rancourt et al., 2022c; Rancourt et al., 2021).
- The number of infections, in the denominator of IFR, is reliant on molecular antibody tests, which are not specific and have not been sufficiently validated (e.g., Rancourt, 2021).
- If the IFR evaluations were valid, then it would be virtually impossible for jurisdictions like India and Australia to have no detectable excess ACM in the pre‑vaccination period of the declared pandemic.
- We do not detect any excess ACM that can be attributed to COVID-19 in the jurisdictions that we have studied in detail (USA and all its states; Canada and its provinces; France and its departments and regions; Australia and its states).
The COVID-19 vaccines did not only not save lives but they are highly toxic.
On the global scale, given the 3.7 million fatalities in India alone, having vDFR = 1 % (Rancourt, 2022), and given the age-stratified vDFR results presented in this work, it is not unreasonable to assume an all-population global value of vDFR = 0.1 %. Based on the global number of COVID-19 vaccine doses administered to date (13.25 billion doses, up to 24 January 2023, Our World in Data),[3] this would correspond to 13 million deaths from the COVID-19 vaccines worldwide. By comparison, the official World Health Organization (WHO) number of COVID-19 deaths to date is 6.8 million (6,817,478 deaths, reported to WHO, as 3 February 2023),[4] which are not detected as COVID-19 assignable deaths in ACM studies.
We are continuing our research on ACM, extending it to many national and sub-national jurisdictions. We hope that the present report will help put an end to the misguided and baseless public health policy that elderly people should be prioritized for vaccination.
*
Note to readers: Please click the share buttons above. Follow us on Instagram and Twitter and subscribe to our Telegram Channel. Feel free to repost and share widely Global Research articles.
Sources
Abbatecola et al. (2022): Angela Marie Abbatecola, Raffaele Antonelli Incalzi, Alba Malara, Annapina Palmieri, Anna Di Lonardo, Giorgio Fedele, Paola Stefanelli, Gilda Borselli, Marcello Russo, Marianna Noale, Stefano Fumagalli, Pietro Gareri, Enrico Mossello, Caterina Trevisan, Stefano Volpato, Fabio Monzani, Alessandra Coin, Giuseppe Bellelli, Chukwuma Okoye, Susanna Del Signore, Gianluca Zia, Elisa Bottoni, Carmine Cafariello, Graziano Onder. /// Monitoring COVID-19 vaccine use in Italian long term care centers: The GeroCovid VAX study. /// Vaccine, Volume 40, Issue 15, 2022, Pages 2324-2330, ISSN 0264-410X, https://doi.org/10.1016/j.vaccine.2022.02.064.
Cadegiani (2022): Cadegiani FA. /// Catecholamines Are the Key Trigger of COVID-19 mRNA Vaccine-Induced Myocarditis: A Compelling Hypothesis Supported by Epidemiological, Anatomopathological, Molecular, and Physiological Findings. /// Cureus. 2022 Aug 11;14(8):e27883. doi: 10.7759/cureus.27883. PMID: 35971401; PMCID: PMC9372380. https://doi.org/10.7759%2Fcureus.27883
Choi et al. (2021): Sangjoon Choi, SangHan Lee, Jeong-Wook Seo, Min-ju Kim, Yo Han Jeon, Ji Hyun Park, Jong Kyu Lee, Nam Seok Yeo /// Myocarditis-induced Sudden Death after BNT162b2 mRNA COVID-19 Vaccination in Korea: Case Report Focusing on Histopathological Findings /// Journal of Korean Medical Science 2021; 36(40): e286. DOI: https://doi.org/10.3346/jkms.2021.36.e286
Corbett (6 September 2022): Neil Corbett /// Maple Ridge woman compensated for mother’s death from COVID-19 vaccine. /// Maple Ridge-Pitt Meadows News, 6 September 2022, https://www.mapleridgenews.com/news/maple-ridge-woman-compensated-for-mothers-death-from-covid-19-vaccine/ – archived here: https://archive.is/wNoYF
COVID-19 Forecasting Team (2022): COVID-19 Forecasting Team. /// Variation in the COVID-19 infection–fatality ratio by age, time, and geography during the pre-vaccine era: a systematic analysis. /// Lancet 399 (2022) 1469-1488, https://doi.org/10.1016/S0140-6736(21)02867-1.
Crum et al. (2021): Crum T, Mooney K, Tiwari BR. /// Current situation of vaccine injury compensation program and a future perspective in light of COVID-19 and emerging viral diseases. /// F1000Res. 2021 Dec 7; 10: 652. doi: 10.12688/f1000research.51160.2. PMCID: PMC8733825. https://doi.org/10.12688%2Ff1000research.51160.2
Edmonds et al. (2023): Edmonds, R, Schönborn, L, Habben, S, Paparoupa, M, Greinacher, A, Schuppert, F. /// Vaccine-induced immune thrombotic thrombocytopenia (VITT) after SARS-CoV-2 vaccination: Two cases from Germany with unusual presentation. /// Clin Case Rep. 2023; 00:e6883. doi:10.1002/ccr3.6883. https://doi.org/10.1002/ccr3.6883
Fortune (15 January 2021): LARS ERIK TARALDSEN , NAOMI KRESGE , AND BLOOMBERG /// Sick patients over 80 could be a COVID vaccine risk, Norwegian health officials warn: The country has conducted autopsies on 13 people who died shortly after receiving the first dose of the vaccine. /// Fortune (15 January 2021), https://fortune.com/2021/01/15/sick-elderly-covid-vaccine-risk-norway-warning/ – archived: https://archive.ph/LPhlt
Gao et al. (2022): Gao, J., Lun, P., Ding, Y.Y. et al. /// COVID-19 Vaccination for Frail Older Adults in Singapore — Rapid Evidence Summary and Delphi Consensus Statements. /// J Frailty Aging 11, 236–241 (2022). https://doi.org/10.14283/jfa.2022.12
Gill et al. (2022): James R. Gill, Randy Tashjian, Emily Duncanson /// Autopsy Histopathologic Cardiac Findings in 2 Adolescents Following the Second COVID-19 Vaccine Dose. /// Arch Pathol Lab Med 1 August 2022; 146 (8): 925–929. doi: https://doi.org/10.5858/arpa.2021-0435-SA
Goldman et al. (2021): Goldman Serge, Bron Dominique, Tousseyn Thomas, Vierasu Irina, Dewispelaere Laurent, Heimann Pierre, Cogan Elie, Goldman Michel. /// Rapid Progression of Angioimmunoblastic T Cell Lymphoma Following BNT162b2 mRNA Vaccine Booster Shot: A Case Report. /// Frontiers in Medicine, vol. 8, 2021, DOI: 10.3389/fmed.2021.798095, https://www.frontiersin.org/articles/10.3389/fmed.2021.798095
Hickey and Rancourt (2022): Hickey, J. and Rancourt, D.G. /// Nature of the toxicity of the COVID-19 vaccines in the USA /// ResearchGate [Preprint] (9 February 2022). Available at: https://www.researchgate.net/publication/358489777_Nature_of_the_toxicity_of_the_COVID-19_vaccines_in_the_USA /// Archived at: https://archive.ph/LZpRj
Ioannidis (2016): Ioannidis, J. P. A. /// Exposure-wide epidemiology: revisiting Bradford Hill. /// Statist. Med., 35: 2016, 1749– 1762. doi: 10.1002/sim.6825. https://doi.org/10.1002/sim.6825
Kamin-Friedman and Davidovitch (2021): Kamin-Friedman, S., Davidovitch, N. /// Vaccine injury compensation: the Israeli case. /// Israel Journal of Health Policy Research, 10, 54 (2021). https://doi.org/10.1186/s13584-021-00490-w
Klein et al. (2022): Klein BM, Dugan ES, LaCombe AD, Ruthmann NP, Roselli EE, Klein AL, Emery MS. /// Complex Management Decisions in a Professional Athlete With Recurrent Pericarditis. /// JACC Case Rep. 2022 Sep 7;4(17):1090-1093. doi: 10.1016/j.jaccas.2022.05.015. PMID: 36124145; PMCID: PMC9481902. https://doi.org/10.1016/j.jaccas.2022.05.015
Kuvandik et al. (2021): Anıl Kuvandık, Ecenur Özcan, Simay Serin, Hülya Sungurtekin. /// Creutzfeldt-Jakob Disease After the COVID-19 Vaccination. /// Turk J Intensive Care, DOI: 10.4274/tybd.galenos.2021.91885. https://cms.galenos.com.tr/Uploads/Article_50671/TYBD-0-0.pdf
Mörz (2022): Mörz, M. A /// Case Report: Multifocal Necrotizing Encephalitis and Myocarditis after BNT162b2 mRNA Vaccination against COVID-19. /// Vaccines 2022, 10, 1651. https://doi.org/10.3390/vaccines10101651
Mungwira et al. (2020): Mungwira RG, Guillard C, Saldaña A, Okabe N, Petousis-Harris H, Agbenu E, et al. /// Global landscape analysis of no-fault compensation programmes for vaccine injuries: A review and survey of implementing countries. /// PLoS ONE 15(5): e0233334. https://doi.org/10.1371/journal.pone.0233334
Onishi et al. (2023): Naoaki Onishi, Yuki Konishi, Toshiyuki Kaneko, Naohiro Maekawa, Akihira Suenaga, Shinnosuke Nomura, Takayasu Kobayashi, Shokan Kyo, Marie Okabayashi, Hirooki Higami, Maki Oi, Nobuya Higashitani, Sayaka Saijo, Fumiko Nakazeki, Naofumi Oyamada, Toshikazu Jinnai, Tomoko Okuno, Tomoyuki Shirase, Kazuaki Kaitani. /// Fulminant myocarditis with complete atrioventricular block after mRNA COVID-19 vaccination: A case report. /// Journal of Cardiology Cases, 2023, ISSN 1878-5409, https://doi.org/10.1016/j.jccase.2023.01.004
Pezzullo et al. (2023): Angelo Maria Pezzullo, Cathrine Axfors, Despina G. Contopoulos-Ioannidis, Alexandre Apostolatos, John P.A. Ioannidis. /// Age-stratified infection fatality rate of COVID-19 in the non-elderly population. /// Environmental Research, Volume 216, Part 3, 2023, 114655, ISSN 0013-9351, https://doi.org/10.1016/j.envres.2022.114655.
Rancourt (2021): Rancourt, DG /// Do Face Masks Reduce COVID-19 Spread in Bangladesh? Are the Abaluck et al. Results Reliable? /// denisrancourt.ca (20 September 2021) /// https://denisrancourt.ca/entries.php?id=106 – archived: https://archive.ph/yHbWO – republished: https://www.globalresearch.ca/do-face-masks-reduce-covid-19-spread-bangladesh-abaluck-et-al-results-reliable/5756323?pdf=5756323
Rancourt (2022): Rancourt, DG /// Probable causal association between India’s extraordinary April-July 2021 excess-mortality event and the vaccine rollout /// Correlation Research in the Public Interest, 5 December 2022 /// https://correlation-canada.org/report-probable-causal-association-between-indias-extraordinary-april-july-2021-excess-mortality-event-and-the-vaccine-rollout/
Rancourt et al. (2021): Rancourt, D.G., Baudin, M. and Mercier, J. /// Nature of the COVID-era public health disaster in the USA, from all-cause mortality and socio-geo-economic and climatic data. /// Research Gate (25 October 2021) /// http://dx.doi.org/10.13140/RG.2.2.11570.32962
Rancourt et al. (2022a): Rancourt, D.G., Baudin, M. and Mercier, J. /// Probable causal association between Australia’s new regime of high all-cause mortality and its COVID-19 vaccine rollout. /// Correlation Research in the Public Interest, 20 December 2022 /// https://correlation-canada.org/report-probable-causal-association-between-australias-new-regime-of-high-all-cause-mortality-and-its-covid-19-vaccine-rollout/
Rancourt et al. (2022b): Rancourt, D.G., Baudin, M. and Mercier, J. /// COVID-Period Mass Vaccination Campaign and Public Health Disaster in the USA: From age/state-resolved all-cause mortality by time, age-resolved vaccine delivery by time, and socio-geo-economic data /// Research Gate (2 August 2022) /// http://dx.doi.org/10.13140/RG.2.2.12688.28164 /// Also available at: https://vixra.org/abs/2208.0023
Rancourt et al. (2022c): Rancourt, D.G., Baudin, M. and Mercier, J. /// Proof that Canada’s COVID-19 mortality statistics are incorrect. /// Correlation Research in the Public Interest, 5 October 2022 /// https://correlation-canada.org/report-proof-that-canadas-covid-19-mortality-statistics-are-incorrect/
React 19 (2022): React 19. /// 1250+ COVID Vaccine Publications and Case Reports: Collection of peer reviewed case reports and studies citing adverse effects post COVID vaccination. /// 9 July 2022, https://react19.org/1250-covid-vaccine-reports/, archived here: https://archive.ph/T4hPV
Reuters (18 January 2021): REUTERS/Stephane Mahe /// Norway advises caution in use of Pfizer vaccine for the most frail /// Reuters (18 January 2021), https://www.reuters.com/business/healthcare-pharmaceuticals/norway-advises-caution-use-pfizer-vaccine-most-frail-2021-01-18/ – archived: https://archive.ph/Ze0Cv
Schneider et al. (2021): Schneider, J., Sottmann, L., Greinacher, A. et al. /// Postmortem investigation of fatalities following vaccination with COVID-19 vaccines. /// Int J Legal Med 135, 2335–2345 (2021). https://doi.org/10.1007/s00414-021-02706-9
Schwab et al. (2022): Schwab, C., Domke, L.M., Hartmann, L. et al. /// Autopsy-based histopathological characterization of myocarditis after anti-SARS-CoV-2-vaccination. /// Clin Res Cardiol (2022). https://doi.org/10.1007/s00392-022-02129-5
Sessa et al. (2021): Sessa, F.; Salerno, M.; Esposito, M.; Di Nunno, N.; Zamboni, P.; Pomara, C. /// Autopsy Findings and Causality Relationship between Death and COVID‑19 Vaccination: A Systematic Review. /// J. Clin. Med. 2021, 10, 5876. https://doi.org/10.3390/jcm10245876
Skidmore (2023): Skidmore, M. /// The role of social circle COVID-19 illness and vaccination experiences in COVID-19 vaccination decisions: an online survey of the United States population. /// BMC Infect Dis 23, 51 (2023). https://doi.org/10.1186/s12879-023-07998-3
Strekler and Mildvan (1960): STREHLER BL, MILDVAN AS. /// General theory of mortality and aging. /// Science. 1960 Jul 1;132(3418):14-21. doi: 10.1126/science.132.3418.14. PMID: 13835176. https://doi.org/10.1126/science.132.3418.14
Suzuki et al. (2022): Hideto Suzuki, Ayako Ro, Aya Takada, Kazuyuki Saito, Kino Hayashi. /// Autopsy findings of post-COVID-19 vaccination deaths in Tokyo Metropolis, Japan, 2021. /// Legal Medicine, Volume 59, 2022, 102134, ISSN 1344-6223, https://doi.org/10.1016/j.legalmed.2022.102134
Tan et al. (2022): Lii Jye Tan, Cai Ping Koh, Shau Kong Lai, Woon Cheng Poh, Mohammad Shafie Othman, Huzlinda Hussin. /// A systemic review and recommendation for an autopsy approach to death followed the COVID 19 vaccination. /// Forensic Science International, Volume 340, 2022, 111469, ISSN 0379-0738, https://doi.org/10.1016/j.forsciint.2022.111469.
The Japan Times (26 July 2022): Japan grants first payment for death related to COVID vaccination. /// https://www.japantimes.co.jp/news/2022/07/26/national/science-health/japan-first-covid-19-vaccine-compensation/ – archived here: https://archive.ph/OfUhm
Turni and Lefringhausen (2022): Conny Turni and Astrid Lefringhausen /// COVID-19 vaccines – An Australian Review. /// Journal of Clinical & Experimental Immunology. 7(3):491-508. https://www.opastpublishers.com/open-access-articles/covid19-vaccinesan-australian-review.pdf
Veronese et al. (2021): Nicola Veronese, Mirko Petrovic, Athanase Benetos, Michael Denkinger, Adalsteinn Gudmundsson, Wilma Knol, Christine Marking, George Soulis, Stefania Maggi, Antonio Cherubini. /// Underrepresentation of older adults in clinical trials on COVID-19 vaccines: A systematic review. /// Ageing Research Reviews, Volume 71, 2021, 101455, ISSN 1568-1637, https://doi.org/10.1016/j.arr.2021.101455.
Wise (2022): Wise J. /// Covid-19: UK makes first payments to compensate injury or death from vaccines. /// BMJ2022; 377 :o1565 doi:10.1136/bmj.o1565. https://www.bmj.com/content/377/bmj.o1565
Wong et al. (2023): Hui-Lee Wong, Ellen Tworkoski, Cindy Ke Zhou, Mao Hu, Deborah Thompson, Bradley Lufkin, Rose Do, Laurie Feinberg, Yoganand Chillarige, Rositsa Dimova, Patricia C. Lloyd, Thomas MaCurdy, Richard A. Forshee, Jeffrey A. Kelman, Azadeh Shoaibi, Steven A. Anderson. /// Surveillance of COVID-19 vaccine safety among elderly persons aged 65 years and older. /// Vaccine, Volume 41, Issue 2, 2023, Pages 532-539, ISSN 0264-410X, https://doi.org/10.1016/j.vaccine.2022.11.069.
Wood et al. (2020): Nicholas Wood, Kristine Macartney, Julie Leask, Peter McIntyre. /// Australia needs a vaccine injury compensation scheme: Upcoming COVID-19 vaccines make its introduction urgent. /// Australian Journal of General Practice (AGJP), doi: 10.31128/AJGP-COVID-36. https://doi.org/10.31128/ajgp-covid-36
Yoshimura et al. (2022): Yukihiro Yoshimura, Hiroaki Sasaki, Nobuyuki Miyata, Kazuhito Miyazaki, Koji Okudela, Yoko Tateishi, Hiroyuki Hayashi, Ai Kawana-Tachikawa, Hiromichi Iwashita, Kazuho Maeda, Yoko Ihama, Yasuyoshi Hatayama, Akihide Ryo, Natsuo Tachikawa /// An autopsy case of COVID-19-like acute respiratory distress syndrome after mRNA-1273 SARS-CoV-2 vaccination /// International Journal of Infectious Diseases 121 (2022) 98–101, https://doi.org/10.1016/j.ijid.2022.04.057
Notes
[1] The World Health Organization (WHO) declared a pandemic on 11 March 2020 (the “declared pandemic”). Vaccine rollouts typically did not start until late December 2020 and early January 2021, although several national jurisdictions had significantly later starts.
[2] https://ourworldindata.org/grapher/cumulative-covid-vaccinations?country=~USA, consulted on 6 February 2023.
[3] https://ourworldindata.org/covid-vaccinations, as archived on 30 January 2023 here: https://archive.ph/u2gEO
[4] https://covid19.who.int/, as archived on 6 February 2023 here: https://archive.ph/boboE
Featured image is from Children’s Health Defense
Appendix 1: Data and Methods
Data
Table A1 describes the data used in this work and the sources of the data.
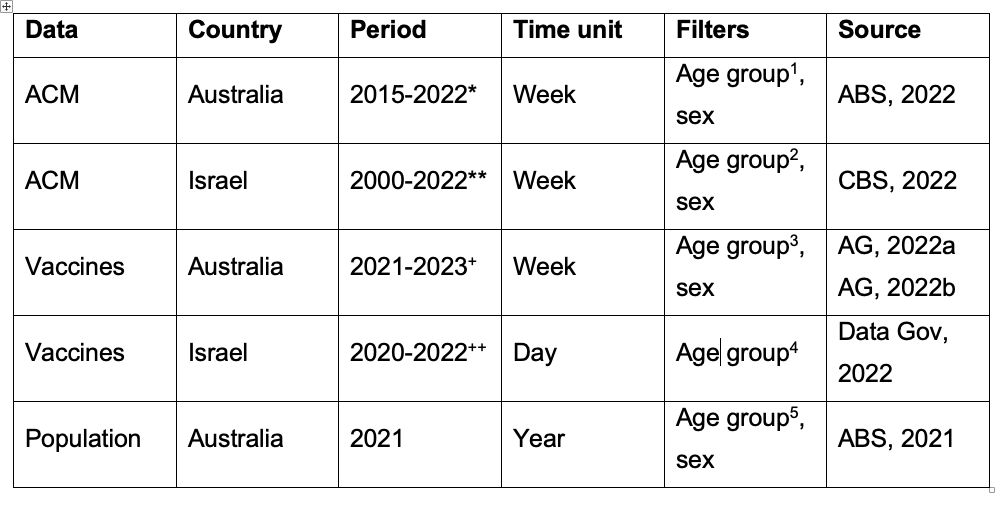
Table A1. Data retrieved. All-cause mortality (ACM), vaccine rollouts, population.
* At the date of access, data were available from week-1of 2015 (week finishing on January 4, 2015) to week-38 of 2022 (week finishing on September 25, 2022).
** At the date of access, data were available from week-1 of 2000 (week starting on January 3, 2000) to week-50 of 2022 (week starting on December 12, 2022).
+ The reports of September 16, 2022 have been used in this work, reporting data as at September 14, 2022.
++ At the date of access, data were available from Sunday December 20, 2020 to Tuesday October 25, 2022.
1 5 age groups: 0-44, 45-64, 65-74, 75-84, 85+
2 8 age groups: 0-19, 20-29, 30-39, 40-49, 50-59, 60-69, 70-79, 80+
3 19 age groups for vaccine doses 1 and 2: 5-11, 12-15, 16-19, 20-24, 25-29, 30-34, 35-39, 40-44, 45-49, 50-54, 55-59, 60-64, 65-69, 70-74, 75-79, 80-84, 85-89, 90-94, 95+ (Excel file report, AG 2022a) and 14 age groups for vaccine doses 3 and 4: 5-11, 12-15, 16-19, 20-24, 25-29, 30-34, 35-39, 40-44, 45-49, 50-54, 55-59, 60-64, 65-69, 70+ (PDF file report, AG 2022b)
4 9 age groups: 0-19, 20-29, 30-39, 40-49, 50-59, 60-69, 70-79, 80-89, 90+
5 18 age groups: 0-4, 5-9, 10-14, 15-19, 20-24, 25-29, 30-34, 35-39, 40-44, 45-49, 50-54, 55-59, 60-64, 65-69, 70-74, 75-79, 80-84, 85+
In addition to the data retrieved as per Table A1, we also examined cumulative vaccine dose by time data for Australia, as per our previous paper about Australia (Rancourt et al., 2022), from https://www.covid19data.com.au/vaccines.
In all the calculations and illustrations, both all-cause mortality (ACM, mortality from all causes of death) and numbers of vaccine doses administered are for the specific jurisdiction and age group.
Vaccine data for Australia are given as cumulative data (AG, 2022a and AG, 2022b). Vaccine data for Israel are given as incremental data (Data Gov, 2022).
In the vaccines data of Israel, when the number of doses administered in a day is between 1 and 15, inclusively, the data shows “<15” (Data Gov, 2022). In order to have a figure to work with, we replaced “<15” by 15, choosing the upper bound of this unknown value. The net effect of this approximation is negligible.
For the vaccine data in Australia, doses 1 and doses 2 are given for 19 age groups (AG, 2022a), which cover the age groups of the ACM by age data (ABS, 2022). However, for doses 3 and 4, 14 age groups are given (AG, 2022b), which do not match the same age groups as for the ACM by age data (ABS, 2022). For this reason, we proceeded as follows.
Figure A1 is the figure from the Australian Government, on page 7 of their report (AG, 2022b):
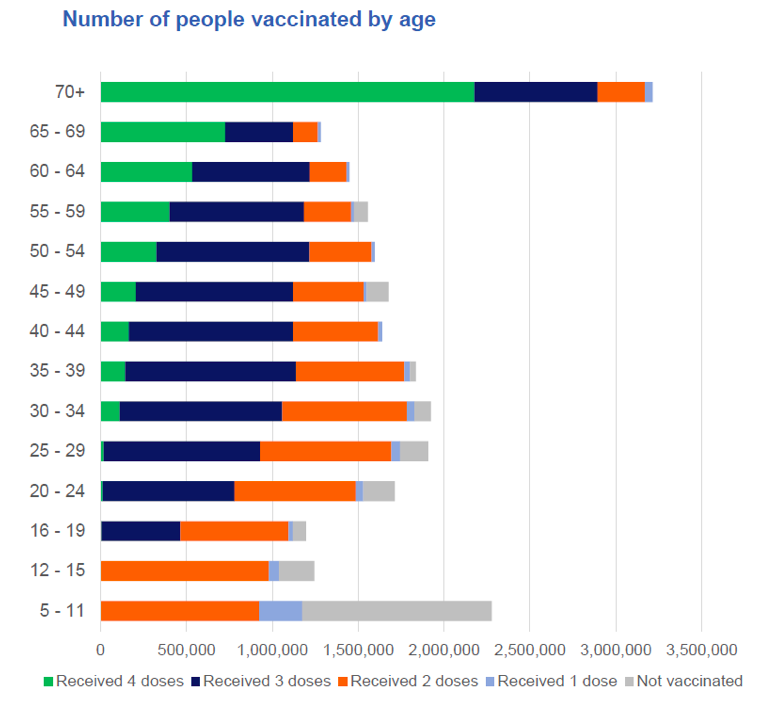
Figure A1. Vaccinations by age from the Australian Government, report of September 16, 2022, page 7 (AG, 2022b).
First, we estimate the number of doses 3+4 administered by age group from this figure (Figure A1). This is done in Table A2.
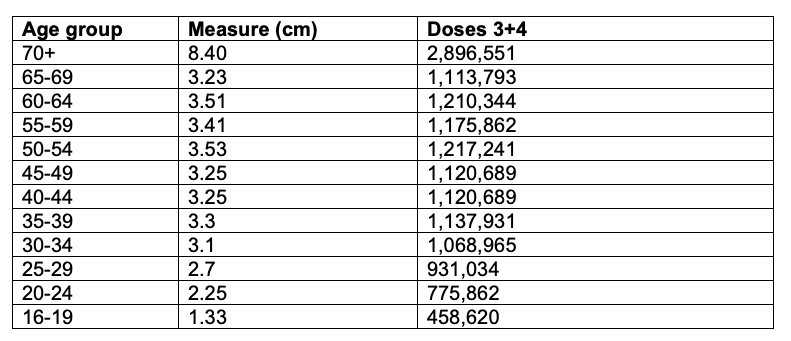
Table A2. Estimation of the number of doses 3+4 by age group from AG, 2022b. Scale used = 1,000,000 people for 2.9 cm.
Next, we estimate the number of doses 3+4 for the missing age groups: the 70‑74, 75‑84 and 85+ age groups. We assume and use a simple proportion of the population of those age groups (ABS, 2021). This is done in Table A3.
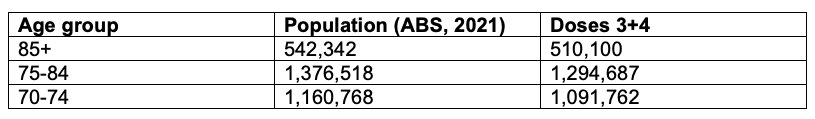
Table A3. Estimation of the number of doses 3+4 for the 70-74, 75-84 and 85+ age groups.
Finally, we sum the estimations from Table A2 and Table A3 into relevant age groups to get the final number of doses 3+4 by ACM age group for Australia. This is done in Table A4.
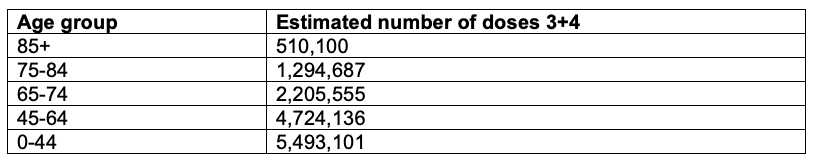
Table A4. Estimation of the number of doses 3+4 by age group in Australia.
These age groups (Table A4) match those of the mortality data for Australia. Note that for the age group 0-44, doses 3 and 4 are for ages 16-44 years. There is no data for doses 3 and 4 for ages 0-15 years in Figure A1 (AG, 2022b).
Vaccination periods
For Israel, we use the same start date (week) of the vaccination period for all age groups. The integration of number of vaccine doses over the vaccine period is inclusive of the first and last weeks defining the said period. The same holds for integrated ACM periods.
For Australia, we use the vaccine-period end-date cumulative value of number of administered vaccine doses.
Table A5 defines the vaccination periods used in this work.
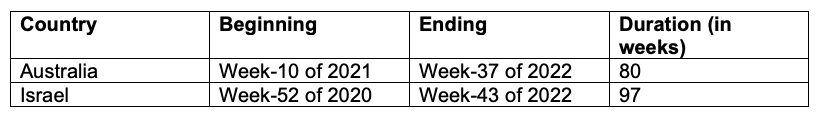
Table A5. Vaccination periods for Australia and Israel used in this work.
“The week number is based on the ISO (International Organization for Standardisation) week date system. In this system, weeks are defined as seven-day periods which start on a Monday. Week 1 of any given year is the week which starts on the Monday closest to 1 January, and for which the majority of its days fall in January (i.e. four days or more). Week 1 therefore always contains the 4th of January and always contains the first Thursday of the year. Using the ISO structure, some years (e.g. 2015 and 2020) contain 53 weeks.” (definition from ABS, 2022).
Trendlines
Table A6 describes the method used to calculate the trendlines fitted to ACM integrated over the periods of equal duration as the duration of the vaccination period. The said trendlines are used to calculate the baseline integrated mortality in the vaccination period, in order to obtain the excess ACM of the vaccination period.
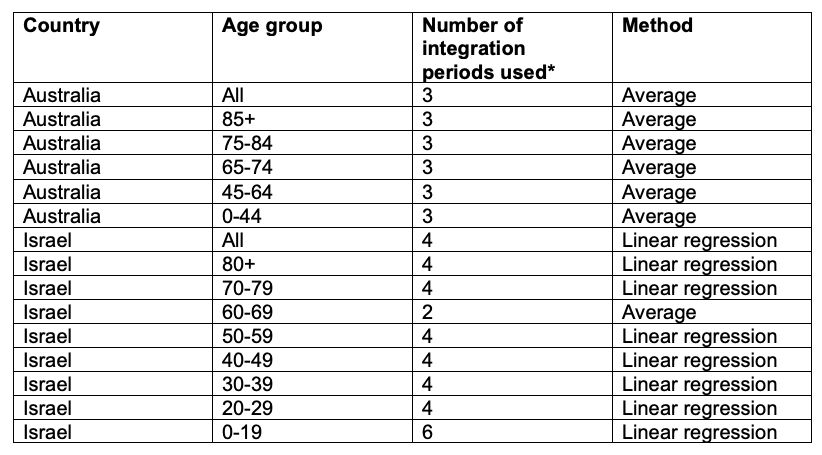
Table A6. Method to estimate the trendlines. For Australia, we use the integrated ACM of the 3 periods prior to the vaccination period, each period being of duration equal to that of the vaccination period (80 weeks) and consecutive to each other, and we calculate the average. For Israel, we use the integrated ACM of the number of periods indicated in the table, prior to the first period directly preceding the vaccination period, each period being of duration equal to the duration of the vaccination period (97 weeks) and consecutive to each other, and we fit a linear trend.
* This is the number of integrated ACM points (periods) used to calculate the trendlines.
The error in the calculated baseline value of integrated ACM over the vaccination period is estimated as the average of the absolute values of the residuals (fit to data) for the points (periods) used in the fit.
References for Appendix 1
ABS (2021): Australian Bureau of Statistics /// Population: Census – Information on sex and age /// accessed 30 January 2023 https://www.abs.gov.au/statistics/people/population/population-census/2021 — Note: The census that we used is for 2021, which was released in 2022.
ABS (2022): Australian Bureau of Statistics /// Provisional Mortality Statistics /// files “Provisional Mortality Statistics, Weekly Dashboard, Jan – Sep 2022” and “Deaths by week of occurrence, 2015-21” /// accessed 23 January 2023 https://www.abs.gov.au/statistics/health/causes-death/provisional-mortality-statistics/latest-release
AG (2022a): Australian Government /// COVID-19 vaccination – vaccination data – 16 September 2022 /// accessed 23 January 2023 https://www.health.gov.au/resources/publications/covid-19-vaccination-vaccination-data-16-september-2022?language=en
AG (2022b): Australian Government /// COVID-19 vaccine rollout update – 16 September 2022 /// accessed 30 January 2023 https://www.health.gov.au/resources/publications/covid-19-vaccine-rollout-update-16-september-2022?language=en
CBS (2022): Central Bureau of Statistics /// לוחות ותרשימים /// file “Death of Israeli residents, by week, gender, population group and age, 2000-2022” /// accessed 16 January 2023 https://www.cbs.gov.il/he/Pages/search/TableMaps.aspx?CbsSubject=%D7%AA%D7%9E%D7%95%D7%AA%D7%94%20%D7%95%D7%AA%D7%95%D7%97%D7%9C%D7%AA%20%D7%97%D7%99%D7%99%D7%9D
Data Gov (2022): Government databases /// גילאי המתחסנים /// accessed 29 December 2022 https://data.gov.il/dataset/covid-19/resource/57410611-936c-49a6-ac3c-838171055b1f
Rancourt et al. (2022): Rancourt, D.G., Baudin, M. and Mercier, J. /// Probable causal association between Australia’s new regime of high all-cause mortality and its COVID-19 vaccine rollout. /// Correlation Research in the Public Interest, 20 December 2022 /// https://correlation-canada.org/report-probable-causal-association-between-australias-new-regime-of-high-all-cause-mortality-and-its-covid-19-vaccine-rollout/
Appendix 2: ACM and Vaccine Rollout Coincidences, for Israel, by Age Group
We have previously illustrated synchronicity between anomalous all-cause mortality (ACM) peaks and vaccine rollouts for:
- Australia (and each of its states New South Wales, Victoria, and Queensland),
- the USA (and its high-poverty states),
- the USA state of Michigan, and
- the Canadian province of Ontario
(See: Rancourt, D.G., Baudin, M. and Mercier, J. /// Probable causal association between Australia’s new regime of high all-cause mortality and its COVID-19 vaccine rollout. /// Correlation Research in the Public Interest, 20 December 2022 /// https://correlation-canada.org/report-probable-causal-association-between-australias-new-regime-of-high-all-cause-mortality-and-its-covid-19-vaccine-rollout/)
Here, we examine this question for Israel and some of its age groups (as indicated), in the following Figure A2‑F1:
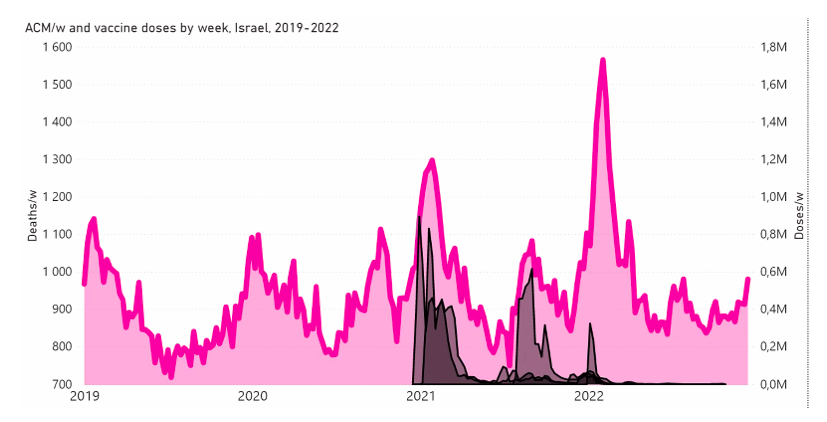
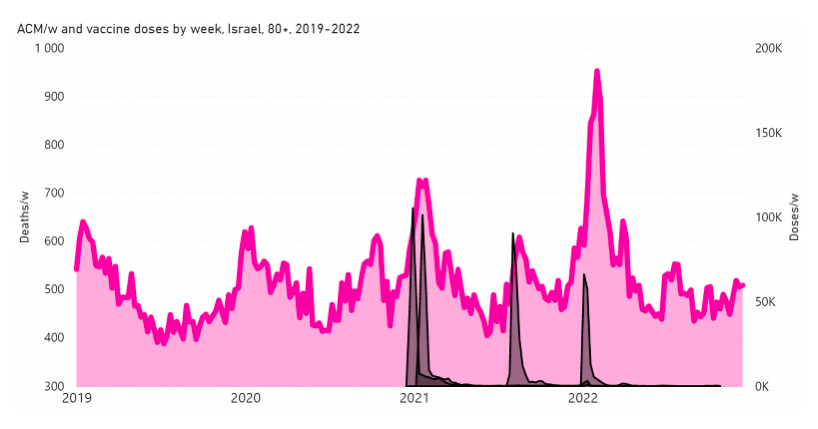
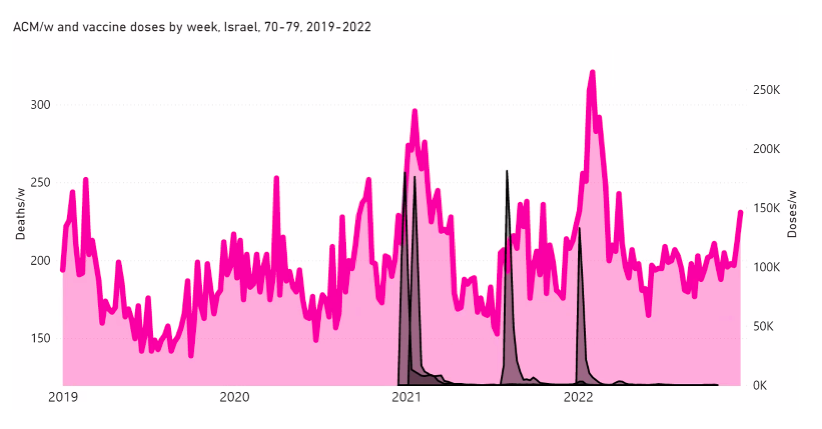
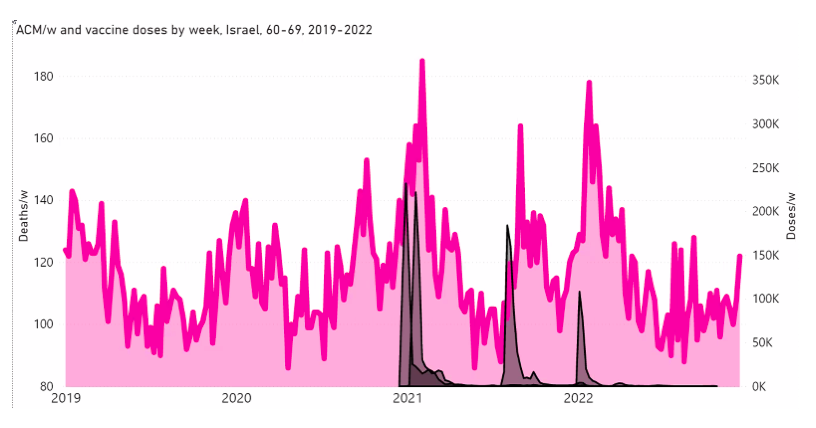
Figure A2 F1: Israel, 2019-2022, for (top to bottom, and as indicated) all ages, 80+ years, 70-79 years, 60-69 years, and 50-59 years. All-cause mortality (ACM) by week (pink, left y-scale); successive vaccine dose rollouts for doses 1, 2, 3 and 4, as numbers of doses administered by week (black and overlapping greys, right y-scale). The sources of all data are given in Appendix 1.