

New scientific discoveries are casting doubt on how much of the warming of the twentieth century was natural and how much was man-made, and governments around the world are beginning to confront the astronomical cost of reducing emissions. Economists, meanwhile, are calculating that the cost of slowing or stopping global warming exceeds the social benefits.”
So spoke Senator James Inhofe on the Senate floor on May 17th, reading into the record the mission statement of the climate conference he was scheduled to be speaking at that very moment. Rather than addressing the Monday lunch session of Heartland’s Fourth International Conference on Climate Change, the Ranking Member of the Senate Committee on Environment and Public Works remained in Washington, responding to the prior week’s Kerry-Lieberman “climate bill” proposal.
The Oklahoma Republican, who had assured attendees of last year’s ICCC on Capitol Hill that no cap-and-tax bill would ever pass the Senate, now stood before C-SPAN’s cameras doing what only one major news organization – Fox — had done before him: acknowledging the existence and significance of the 700-plus scientists, economists, policymakers, and concerned citizens gathering some 600 miles away in Chicago. And their collective objective to “build public awareness of the global warming ‘realism’ movement,” so that “sound science and economics, rather than exaggeration and hype” might “determine what actions, if any, are taken to address the problem of climate change.”
Had the mainstream media acted responsibly, then every word spoken at the first major post-Climategate climate colloquium would have indeed built public awareness of the implausibility of manmade global warming and, consequently, any job-killing legislation, treaties or regulations designed to “control” it. But ours is an agenda-driven MSM – brazenly toting water for a president and Hill Democrats shamelessly rolling out the Gulf-coast disaster crash-cart to reanimate their flat-lined “climate” bill.
Mine is the task of summarizing – to the best of my ability — the current state of climate reality, as espoused before me one month ago by no less than the greatest minds analyzing the subject today. And yours is the opportunity to quickly absorb the collective wisdom of over 75 experts speaking at 5 plenary and 20 breakout sessions, and countless marvelous conversations, all spread over 3 days. And to discover or affirm the myriad inconvenient truths behind the “global warming” hype.
Let’s begin with arguably the most significant but unquestionably the most conference-ubiquitous.
Currents and Current Cooling
For years now, alarmists have arrogantly ignored the cooling we’ve experienced worldwide since 1999, continuing their demands that we sacrifice everything – jobs, money, comfort, progress and ultimately, freedom — to halt fictitious “runaway global warming.” Such unfounded hysteria seems all the more inane after hearing the unvarnished truth from the experts at ICCC-4, beginning with their predictions that the global cooling will likely continue for the next few decades.
Geologist Don Easterbrook was one of many attending scientists attributing natural climate variations to solar irradiance and deep ocean currents. His ICCC-4 announced paper, The Looming Threat of Global Cooling, noted the undeniable link between the Pacific Decadal Oscillation (PDO) shifting to its warm mode in 1915 and 1977 and global warming resulting both times. Conversely, in 1945 and 1999 the PDO moved to its cool mode and the globe cooled right along, despite a rapid increase in atmospheric CO2 during the period. What’s more, climate changes in the geologic record show a regular pattern of alternate warming and cooling with a 25-30 year period for the past 500 years. Easterbrook thereby concludes that we should “expect global cooling for the next 2-3 decades that will be far more damaging than global warming would have been.”
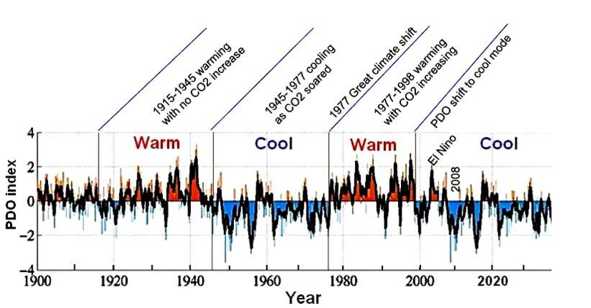
Fig. 1 – From Don Easterbrook. Since 1900, global temperatures have closely correlated with the PDO Index. This belies AGW and portends a coming big chill.
Easterbrook noted a strong correlation between PDO and solar activity, as did geophysicist Victor Manuel Velasco Herrara, who believes an even longer cold spell (60-80 years) has begun — triggered by a decrease in solar activity. Habibullo Abdussamatov agrees, and illustrated how the 18 Little Ice Ages that occurred in the past 7500 years can all be attributed to “natural bicentennial variations in the average annual values of the total solar irradiance (TSI)” and its secondary subsequent feedback effects (natural changes in the albedo, water vapor abundance, etc.). Abdussamatov demonstrated that each time the TSI reached a peak (up to 0.2%) a period of global warming began “with a time lag of 15±6 years defined by the thermal inertia of the Ocean (despite the absence of anthropogenic influence).” Contrarily, “each deep bicentennial descent in the TSI caused a Little Ice Age.” Based on the present cycle, the astrophysicist expects “the beginning of the new Little Ice Age epoch approximately in 2014.”
Hurricane specialist William Gray also brought along some mighty convincing charts proving that most of the warming experienced in the past thousand years can be attributed to deep ocean circulations, strengthened and weakened by century-scale salinity variations. While the relationship of Sea Surface Temperatures to evaporation, rainfall and wind patterns, albedo and, ultimately, air temperature is complex and beyond the scope of this article, suffice it to say that this translates to ocean – not carbon — driven global temperatures.
Gray believes the Medieval Warm Period (MWP) was a result of a multi-century slowdown of the Meridional Overturning Circulation (MOC), similar to that experienced in the 20th century and corresponded to similar warming. Conversely, the Little Ice Age (LIA) was a period of stronger than average MOC, as we are beginning to see today. Gray, too, predicts that strengthening ocean currents portend global cooling over the next few decades, even as carbon dioxide levels continue to climb.
So how is it that the National Oceanic and Atmospheric Administration’s (NOAA) National Climatic Data Center just declared this year’s January-May period the warmest on record?
“If we torture the data long enough, it will confess”
AT readers are no doubt well aware that, thanks in large part to the efforts of WUWT’s indefatigable Anthony Watts, we’ve known for years that over 90% of American stations misreport temperature data by between 1ºC and 5ºC. Furthermore, “smoothing” adjustments to “homogenize” station data to that of surrounding stations and dismissal of the biasing phenomenon known as the Urban Heat Island Effect have grossly exaggerated 20th-century warming.
Not coincidentally, Dr. Craig Loehle concluded that after subtracting UHIE and other measurement artifacts, a 59 year natural cycle of warming and cooling remains. And while that cycle matches that of the PDO to a tee, the MSM respond as though only “deniers” could possibly suggest a link.
But last November we learned just how far ideologues at England’s Climate Research Unit were willing to go when glaring evidence that its scientists had doctored climate data to remove previous warm periods from the history books while exaggerating modern warming and suppressing modern cooling surfaced.
And further investigation uncovered by a team lead by ICCC-4 presenter Joe D’Aleo revealed that the two primary U.S. sources of global temperature have also been manipulating land-based instrumental readings. NOAA has been strategically deleting cherry-picked, cooler-reporting weather observation stations from the temperature data and NASA has intentionally replaced the dropped NOAA readings with those of stations located in much warmer locales.
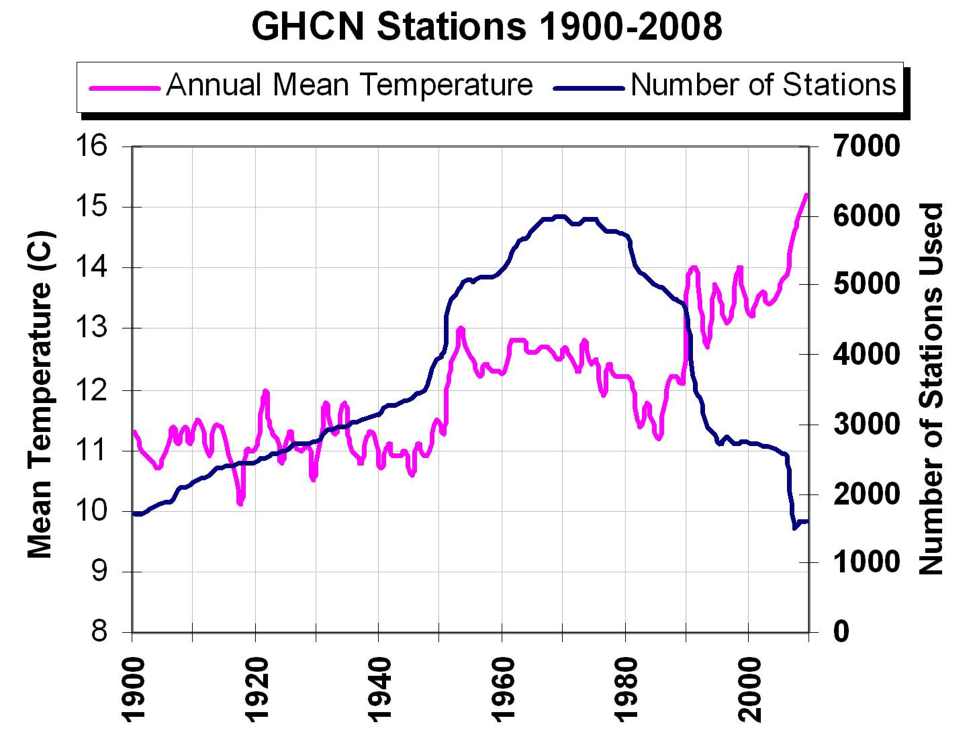
Fig 2. From ICECAP’S Joe D’Aleo. As NOAA’s Global Historical Climatology Network selectively dropped its US Station count from 5000 in 1990 to 1500 in 2007, reported temperatures rose inversely. Nothing to see here.
And that’s just the beginning. As D’Aleo explained, “homogenization and other adjustments blend the good with the bad, usually cooling off early warm periods, producing a warming where none existed.” For instance, NOAA removed UHIE adjustments from US Data in 2007, which “changed a cooling trend since 1940 to a warming trend.”
This section’s heading is a quote from Ronald Coase, fittingly cited by D’Aleo during his presentation. For more details on why Joe concludes that “the surface data and models should not have been used for decision making by the EPA or the congress,” and that any proclamations of “warmest months,” “warmest years,” or “warmest” anything are utterly meaningless, see my January report here.
Of course, the instrumental data manipulated by the US agencies is accepted as gospel by climate agencies worldwide.
Accordingly, atmospheric physicist S. Fred Singer believes that the decline Phil Jones wrote about using the “trick” to hide was not only the post-1979 temperature drop calculated by his proxy records, but also that in the actual CRU/NOAA/NASA instrumental readings, which he and his co-conspirators set out to manipulate before splicing them to the pre-1980 proxy series. In other words, there has been no actual warming since 1979. Singer – who presented much evidence against post-1979 warming, including satellite data — emailed Michael Mann and asked why the proxy data ended in 1979 and received a reply that there were “no suitable records.” Nonsense, declares Dr. Singer – “We need more proxy data for 1979-1997!”
At the event’s opening night dinner, realist-hero Steve McIntyre drew no small amount of ire from the crowd when he refused to call CRU’s trickery “fraud.” “Academic misconduct,” he labeled it, stating that in academic circles the level of non-disclosure of adverse data we saw was perhaps perfectly acceptable. Geologist and former astronaut Harrison Schmitt grabbed the mike to retort that “this is science, and if you want to play that game (tricks, non-disclosure, etc) then you can go somewhere else.” To which more than a few in attendance, including your humble correspondent, yelled loudly: “To Jail!”
Climate Depot’sMarc Morano sided with the astronaut. Not Use Term Fraud? Hell No!
It is so nice to have the light of day and stench of corruption coming from people like Michael Mann and Pachauri and Phil Jones and the upper echelon of U.N. scientists. We should be rejoicing that their entire careers are getting pissed on at the moment and justifiably so.
Lord Monckton agreed – “So when Steve McIntyre says we shouldn’t use words like fraud — Yes we should when it’s plain and evident.”
Monckton later called for the abolishment of the IPCC — “if only because of their appalling prose style.”
That line drew enormous laughter. But there’s nothing comical about the malfeasance of the U.N.’s climate panel, its complicit agencies both here and abroad, or the efforts afoot to whitewash their conspiracy to defraud.
Ugly Models + Inverted Feedback Loops = Inflated Climate Sensitivity
As Easterbrook noted, computer models are the only basis for claiming CO2 is causing global warming. But IPCC models predicted 1ºF warming from 2000 to 2010, yet there’s been no warming beyond the 1998 level. So the models have been proven wrong.
And ICCC-4 was teeming with scientists uniquely qualified to explain the errors of the modelers’ ways.
As you probably know, IPCC modelers have declared probable climate sensitivity (the amount of warming to be expected by a doubling of atmospheric CO2, a likelihood this century) to be 3ºC. But they attribute 2/3 of that figure to positive feedback from clouds. William Gray explained why he believes clouds actually provide 0.5ºC of negative feedback for a total climate sensitivity of 0.5ºC.
Indeed, the designation of clouds as negative rather than positive feedback has been a lesson taught by Dr. Roy Spencer and MIT’s Dr. Richard Lindzen for years. As Spencer explained, were warming due only to CO2, it would be a non-issue. The IPCC modelers derive their “catastrophic” warming predictions from algorithms whereby CO2-caused warming causes a decrease in clouds, which lets in more sunlight and leads to more warming. In truth, says Spencer, quite the opposite is true — weak warming increases clouds, letting in less sunlight and leading to less warming. In fact, Spencer believes that a full 75-80% of warming could be due to cloudiness changes due to PDO. In other words, most of past warming is likely natural and climate sensitivity is likely closer to 0.5ºC.
Lindzen fundamentally agrees with the 0.5ºC figure, noting that a doubling of CO2, by itself, contributes only about 1ºC to greenhouse warming:
We see that all the models are characterized by positive feedback factors (associated with amplifying the effect of changes in CO2), while the satellite data implies that the feedback should be negative. Only with positive feedbacks from water vapor and clouds does one get the large warmings that are associated with alarm. What the satellite data seems to show is that these positive feedbacks are model artifacts.
In a uniquely fascinating lecture, frequent WUWT contributor Willis Eschenbach outlined his hypothesis that temperatures are kept within a narrow and fixed range by a governing mechanism of clouds and thunderstorms set by the physics of the wind, the waves and the ocean – but not CO2 forcing. And past IPCC expert reviewer Tom V. Segalstad also insisted that clouds are the real thermostat, with far more temperature regulating power than CO2.
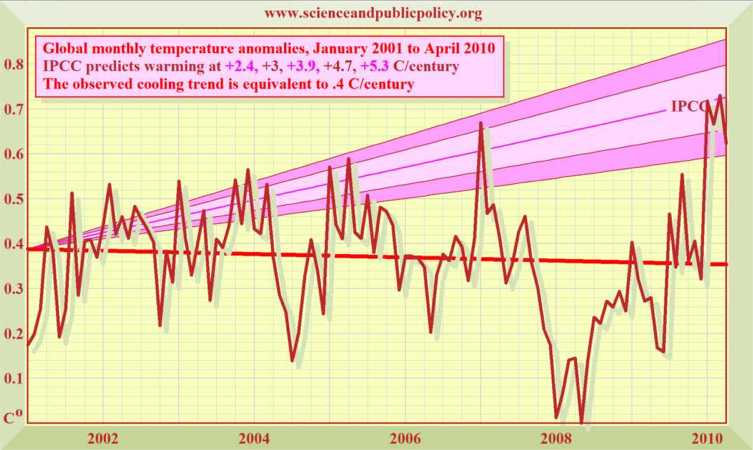
Fig 3. From SPPI. For almost nine years, the trend in global temperatures has been falling. The IPCC’s predicted equilibrium warming path (pink region) bears no relation to the global cooling that has been observed in the 21st century to date. Note the very sharp peak in global temperature in early 2010, caused by a strong El Niño Southern Oscillation. Source: SPPI global temperature index.
Geologist Ian Plimer exposed yet another problem with IPCC models — they completely ignore the role of volcanoes in their analysis. Both terrestrial, which expel heat, water vapor and CO2, and submarine, which add heat and gases to the oceans and also increase its CO2, play no part whatsoever in IPCC predictions.
And yet, the models are programmed to specifically predict the effects of atmospheric trace gases, focusing on one in particular — despite being wrong not only in theory, but also in practice. Put simply by Lindzen, who first noticed the discrepancy between the models’ predictions and the observed reality, “all models are exaggerating warming.”
Physicist David Douglass revealed his comparisons of actual tropical temperature trends with 22 Model Predictions from 1958-2004. The models did not fare well — only 2 of the 22 matched observations. He also cited his Geophysical Research Letters-published collaboration with Pearson and Singer in 2004 which challenged the a hot spot 7-8km over the tropics IPCC models predicted would develop between 1979-2004.
Environmental economist Ross McKitrick pointed out that it was on pages 764-765 of AR4 WG1 report that IPCC authors wrongly predicted a concentrated, rapid warming expected in the tropical troposphere: McKitrick allowed a quote from a 2005 paper [PDF] by Barnett et al put the IPCC’s error into perspective:
If the Christy et al. (2000) analysis is closer to the “true” tropospheric temperature change over the satellite era, then we do not understand the factors that influence observed lapse rate variability on multi-decadal timescales, and climate models cannot reproduce the “observed” differential warming.
Concludes McKitrick, “you have to decide whether you believe models or data – you can’t believe both.” Of course, given recent revelations, it’s becoming more and more difficult to believe either. So you may find Douglass’s take-away the more compelling — “how can you trust models to predict the future if they can’t explain the past?”
Great question — in any other science you most certainly would not. But, as Douglass indicated: “In climatology, if you come up with something that disagrees with the hypothesis, the models are always correct, and there’s something wrong with your data.”
And Lindzen certainly agreed:
More sophisticated data is being analyzed with the aim of supporting rather than testing models (validation rather than testing). The aim is to support rather than question the models. That certainly has been my experience during service with both the IPCC and the National Climate Assessment Program. It is also evident in the recent scandal concerning Himalayan glaciers [, which Marc will be addressing approximately 600 words from now.]
The MIT atmospheric guru concluded that:
Models cannot be tested by comparing models with models. Attribution cannot be based on the ability or lack thereof of faulty models to simulate a small portion of the record. Models are simply not basic physics.
Any wonder why J. Scott Armstrong found that of 89 relevant forecasting principles, the IPCC authors violated no less than 72 of them?
We Heart CO2
Armstrong also noted that when Svante Arrhenius first proposed the “CO2 causes warming” theory in the early-1900s, the Swedish Nobel Prize winner expected the effects to be beneficial. And many agree.
A century later in a Chicago hotel conference room, H. Leighton Steward inventoried many of the benefits of increased CO2, including a general greening of the planet, an enhanced capacity of ecosystems and habitats and an increase in productivity per farm acre. This in turn will help prevent conversion of pristine land to farm land and thereby lead to more food for an expanding population.
Robert Ferguson of SPPI also examined the alarmist-ignored physiological benefits rising atmospheric CO2 and unrelated higher temperatures afford plant-life, and that it “is essential for meeting future food needs and conserving land for nature.” But rather than being marked for distinction, as claimed by alarmists, animal life will actually thrive in warmer, CO2 enriched environments, through enhanced species proliferation and diversity.
During his lecture on solar activity, astrophysicist Willie Soon touched upon the impact of rising CO2 in the oceans and displayed the results of a study by Dr. Justin Ries of the University of North Carolina-Chapel Hill. It seems that increasing the CO2 in the habitats of the shellfish studied increased their growth sevenfold!
And yet, last year the EPA classified the essential trace gas as a pollutant in its incongruous endangerment finding.
The sheer senselessness of that declaration elicited separate unorchestrated yet identically preambled rebuttals from Soon, Steward, Singer, and Schmitt that “CO2 is not an air pollutant,” with Soon adding that “it is food for plants and marine life!” and Steward that “without CO2 there would be no life on Earth.”
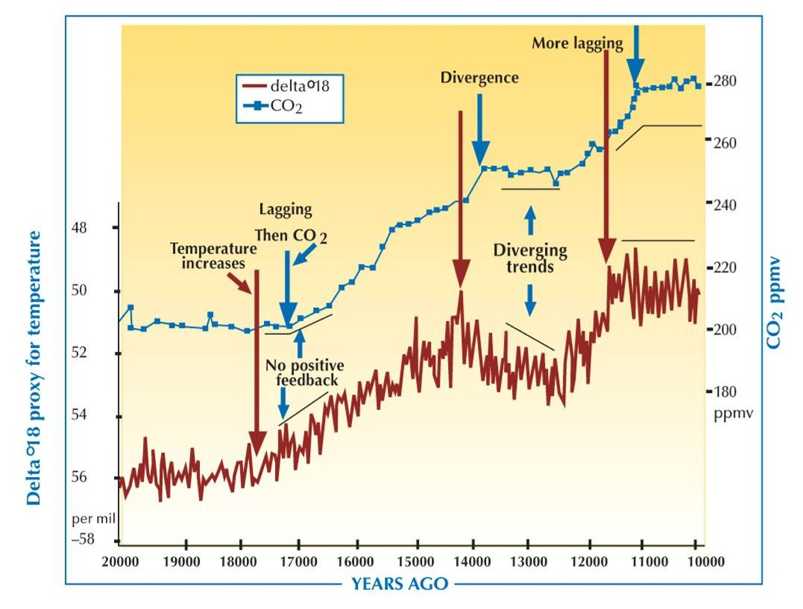
Fig 4. From H. Leighton Steward. In a reversal of alarmist hype, Antarctica Ice Core Analysis depicts CO2 levels rising in response to warmer temperatures.
Steward offered one of many reminders I heard that climate history indicates CO2 is a lagging indicator in climate change. In fact, an Antarctica Ice Core Analysis chart clearly showed the several hundred year lag of CO2’s response to prior temperature change.
Regarding those recent theoretical claims of impending marine species extinctions due to increases in the atmosphere’s CO2 concentration, Craig Idso analyzed the results of no less than 568 separate studies and concluded that such alarming predictions “have no basis in empirical reality.” Furthermore, “[t]hose who continue to portray CO2-induced ocean acidification as a megadisaster-in-the-making are not grounded in the real world data.”
Ian Plimer showed that we’ve had up to 30% CO2 in oceans in the past with no acidification due to the buffering power of rocks, adding that the evidence is written in stone.
Tom V. Segalstad agrees, asserting that all reported pH anomalies “are within natural variations.” Segalstad walked us through a number of formulae concluding that the oceans’ carbonate systems are one of many pH buffers maintaining equilibrium. And according to Stumm & Morgan, 1970: “Together these add up to almost an ‘infinite buffer capacity.’”
And, as we need the carbohydrates from the plants that need the gas, Segalstad declares CO2 to be “The gas of life.”
The Norwegian geophysicist concluded that: “Regulation, taxation and control of CO2, the basics of life, is betraying the Universal Declarations of Human Rights.”
Global Flooding – The Alarmists’ Paper Tiger
One of the most infamous post-climategate IPCC scandals was branded “Glaciergate.” The term refers to an AR4 warning that unchecked climate change will melt most of the Himalayan glaciers by 2035, which was found to be lifted from an erroneous World Wildlife Fund (WWF) report and misrepresented as peer-reviewed science. IPCC Chairman Rajendra Pachauri attempted to parry this “mistake” by accusing the accusers at the Indian environment ministry of “arrogance” and practicing “voodoo science” in issuing a report [PDF] disputing the IPCC. But one in his own ranks, Dr Murari Lal, the coordinating lead author of the chapter making the claim, later admitted he knew all along that it “did not rest on peer-reviewed scientific research.” As, apparently, had Pachauri (whom Monckton later referred to as “Casey Jones,” in recognition of his field of expertise — railroad engineering), who continued to lie about it for months so as not to sully the exalted AR4 immediately prior to Copenhagen.
Madhav Khandekar cited Glaciergate as “a clear example how IPCC’s lack of oversight and ineptness can lead to an alarmist science with NO merit.” Khandekar notes that in reality, Himalayan glaciers aren’t melting any faster than glaciers elsewhere, and the two major Himalayan glaciers, Gangotri and Siachen, appear quite stable at present. And he presented facts which suggest that, contrary to ubiquitous visuals of pacific islands and coastal cities under meters of water, glacier melt worldwide may contribute about 105 mm to sea level rise (SLR) over next 110 years. Add thermal expansion from even 1ºC over the next 100 years (remember — Lindzen, Spencer et al suggest 0.5C and others suggest continued cooling) for an additional 100 mm and we’re talking in the neighborhood of 22 cm over the next 100 years.
Not much to be alarmed about, particularly considering that, as emphasized by marine geologist Bob Carter, even that high-end figure represents no meaningful change over the 10-20 cm / century experienced over the past 150 years. Carter showed us a chart of IPCC predicted eustatic (worldwide) SLR from 1990-2100 which presents an over-the-top apex of 0.77 meters. But Carter sees little value in eustatic forecasts anyway. And he’s not alone. Quoting Singer et al., NIPCC, 2008, p. 51:
Even assuming that this statistic can be estimated accurately, it has little practical policy value. Local relative sea-level (LRSL) change is all that counts for purposes of coastal planning, and this is highly variable worldwide, depending upon the differing rates at which particular coasts are undergoing tectonic uplift or subsidence.
And it’s exactly these LRSLs the always engaging Dr. Carter addressed in his presentation.
Carter displayed a chart of eustatic SLR since the Last Glacial Maximum, showing the total rise since 18,000 years BP (before present) to be about 120 meters. The curve is quite steep as continental ice sheets melted (10,000 years BP the rate of rise was 2 m/century) and levels off to a nearly constant rate of rise in the past several millennia. Ian Plimer added that materials found from retreating ice show that we’ve had SL changes of at least 1.5km in the past.
Message to warmists: As with climate, SLR rates are in continual flux and are never cause for alarm, but rather adaptation.
But these global averages comprised many extreme local variations. Using his native Australia as an example, Bob showed many examples of areas where sea level was once (5000 ybp) many meters higher than it is today. Moving to Scandinavia, strandline deposits of mollusk shells signify that the shoreline was over 30 meters lower 5000 ypb due to icecap uplift.
So there are different LRSL curves all over the world, hence Bob’s closing words: In using IPCC advice to set their policies on SLR, national governments are negligent and fail utterly to fulfil their duties to care for their people. Bob added in an email he sent me days later: “It betrays frightening ignorance that many governments and local authorities are, nonetheless, introducing new coastal planning regulations that are exclusively predicated upon the IPCC’s eustatic sea-level forecasts.”
Of course, others conveniently exploit their local topography.

Fig. 5. From Nils-Axel Mörner. Maldavian cabinet underwater photo-op was all wet.
Perhaps the most famous hysterical response to SLR was this recent photo of the Maldivian president and ministers donning SCUBA gear to hold the world’s first underwater cabinet meeting as a “symbolic cry for help over rising sea levels that threaten the tropical archipelago’s existence.” A stirring visual indeed – but pure baloney says paleogeophysicist Dr. Nils-Axel Mörner, who reported the results of his highly detailed sea-level study of the area. It turns out that not only has SL been stable there over the past 30 years, but current levels are significantly lower than they were in the 17th century. Similar results were found in other IPCC “warning” areas like Bangladesh, Venice, and NW Europe – no significant SLR in as many as 50 years. What Mörner did find in all of these areas was a tendency for the IPCC to misrepresent coastal erosion as SLR.
Flooding is, after all, the ultimate weapon of the alarmists. Sure, there’s the AGW-hurricane canard, but as Steward reminded us — global hurricane activity is at a 30 year low and violent tornadoes (F3-F5) have been trending downward since 1975
As Mörner observes: “Without a flooding concept there is not much of a threat left in IPCC.”
The tiger has lost its teeth.
Social Justice – U.N. Style
Marc Morano fittingly declared carbon-based economies “one of the greatest liberators of mankind in the history of our planet,” and hailed carbon-based energy for “allow[ing] unprecedented 20th Century advances.” The same industrial age that warmists blame for all the planet’s ills actually advanced life on Earth from its previous state of “nasty, brutish and short.”
Appearing on Fox News last December, Morano referred to “a new form of colonialism,” where you have “the white wealthy western world telling 1.6 billion people in developing world — predominantly of color — that they have to have their economies managed, their energy managed all because of climate fears.”
Julian Morris foresees corollaries of a direr nature, fearing that greenie concerns over technology could affect the very thing they’re most concerned about – widespread starvation. But not for the reasons the greens advertise.
A little background is in order.
The U.N. is seeking what amounts to a wealthy-nations tax, asking developed countries to pony up 2% of their GDP for a U.N.-policed fund purported to help “developing” nations mitigate and adapt to climate change. The rationale? Developed nations owe a “climate debt” to the less fortunate “victims” of their greed. Of course, having come this far in this admittedly lengthy essay, you already know that progress has had no bearing on climate change, so spending billions to reduce CO2 emissions will reduce neither those emissions nor global temperatures. And that the ravages of climate change (SLR, hurricanes, etc) are hysterical hogwash.
For a detailed explanation of how climate change is the problem to the U.N.’s solution of international wealth redistribution, see my expose — IPCC: International Pack of Climate Crooks.
The problems driving Morris’ concern all stem from the unintended consequences of green “scare stories,” and he offered Rachel Carson’s bogus indictment of DDT in Silent Spring, responsible for the death of millions from malaria, as an example. The previous day, Indur Goklany had warned of a brewing crisis when he discussed his study that found death and disease from biofuel production more likely to be real than those estimated due to GW.
As we learned from Soon, Steward, Singer, Schmitt, Ferguson, Idso and Segalstad (to name a few), a warmer, carbon richer world would in fact be a better world. Carbon is not a threat to any nation, developed or otherwise.
On the other hand — malnutrition, diarrhea, AIDS, tuberculosis, malaria and lack of access to fresh water are real threats to third-world nations and it’s the very technology the warmists seek to impede that’s best suited to cure these diseases and bring these people out of poverty.
Concludes Morris – by imposing “climate control” remedies in the third-world, more people actually will therefore die from “climate related” problems.
Which Morris humanely labels as “twisted thinking and morally repugnant.”
Which brings us to ……
All the President’s Mendacity
In his disturbingly unfocused oil-spill response speech last Tuesday, in which he appeared more concerned with capping emissions than capping the black mud spewing into the Gulf, Obama referred to the House cap-and-tax bill as one “that finally makes clean energy the profitable kind of energy for America’s businesses.”
This is patently preposterous and betrays an egregious lack of executive grasp.
Obama would have learned much from CEI’s Chris Horner’s segment, in which he quoted a Center for Data Analysis (CDA) analysis that projects a nationwide renewable electricity standard would:
- Raise electricity prices by 36 percent for households and 60 percent for industry;
- Cut national income (GDP) by $5.2 trillion between 2012 and 2035;
- Cut household income by $2,400 per year for a family of four;
- Reduce employment by >1,000,000 jobs; and
- Add more than $10,000 to a family of four’s share of the national debt by 2035
The president mentioned “America’s addiction to oil” twice, a term borrowed from his Republican predecessor. But as Hon. George Allen of American Energy Freedom Center declared, “Americans are not addicted to oil, they’re addicted to freedom.” The former VA senator added that “a free, prosperous and sovereign country needs to be able to defend, feed, and fuel itself” and that “America has more energy sources than any other in the world (oil, coal, and natural gas), yet our government sees those resources as a curse (any other would see it as a blessing).”
Obama also claimed that “as we recover from this recession, the transition to clean energy has the potential to grow our economy and create millions of good, middle-class jobs – but only if we accelerate that transition.”
Any guesses why he neglected to suggest we “think of what’s happening in countries like Spain and Japan, where they are making real investments in renewable energy,” as he did in January of last year?
Dr. Gabriel Calzada returned to ICCC to explain that as bad as Spain’s “green economy” was when last we met in Washington, it’s actually decayed further since. The Spanish economist revealed that last year’s devastating 18 percent “green unemployment” had now exceeded an astounding 20 percent. That’s because the country spent 28.6 Billion Euros to create 50,200 green jobs (that’s over 570,000 euros per green job) and – get this – for every green job created 2.2 jobs were lost. And the majority of these “green” jobs are temporary in nature, further decimating the Spanish workforce as they sunset. And while the government continues to pump more money into inadequate power sources, energy prices skyrocket, driving industry to cheaper ground, and the job market to even lower levels.
In 2009, Spain’s public aid to renewables cost more than the whole national electricity production as the unitary cost of renewable energies reached 3 times the cost of other energies. That rate deficit reached 4.6 Billion Euros, which forced public aid to renewables to reach 6 Billion Euros.
Horner referred to this as an “unsustainable bubble” requiring “constant infusion,” pointing out that such subsidies directly and indirectly trade manufacturing jobs for primarily “temporary installation jobs.”
As Minnesota State Senator Mike Jungbauer noted, renewable energy standards are actually mandates which constrict access to efficient, inexpensive base-load power and pass all costs on to the consumer. And, as both the reductions and standards are hopelessly “unattainable,” they do nothing to help achieve “energy independence.”
And then there’s the matter of cap-and-tax itself, a subject of much chatter at ICCC-4.
Hans Labohm laid out the real numbers behind Obama’s ludicrous goal of “slashing US carbon dioxide emissions to 80% below 1990 levels by 2050.” Aided by the calculations of American economist Paul Driessen, the Dutch economist estimated that such a reduction would return the US to emission levels last seen in 1905 (a similar study [PDF] by the American Enterprise Institute puts the emissions number at a billion metric tons, last seen in 1910). But America’s 1905 population was 84 million, as compared to 308 million today, so per-capita emissions would need to be reduced to the levels of the horse-and-buggy days of 1862.
And in a futile attempt to achieve that insane goal, we’d need to endure additional layers of environmental regulation, higher energy prices (for business and consumers), loss of international competiveness, regular blackouts, walk out of (energy-intensive) industries to countries with less burdensome regulation, waves of lay-offs, energy poverty, and an overall decline of living standards. Of course, AT readers know damned well such suffering would be for naught.
Chip Knappenberger estimated that by century’s end, the plan will result in global temperatures being one-fifth of one degree Fahrenheit less than they would otherwise be — which is “a scientifically meaningless reduction.”
But here’s what’s truly amazing, says Labohm (my emphasis): “According to the models of the climate alarmists, the current proposals to reduce CO2 emissions will have no detectable effect on worldwide temperatures.”
In other words – All pain, no gain.
What a year it has been. We are the consensus now.
So began Lord Christopher Monckton’s conference-ender. Monckton’s masterful closing remarks have become an ICCC tradition, in which he movingly congeals the many truths learned in the prior sessions. Once again, he did not disappoint.
Monckton identified in Hadley data 3 recent and remarkably similar periods of rapid warming — 1860-1880, 1910-1940 and 1975-2001. The first two were obviously not CO2 related as average atmospheric CO2 (ACO2) for the periods were 290 and 310 ppmv, respectively. They both did, however, correspond to the PDO of the time (as noted above by Easterbrook.) The third, which as Monckton points out “accounts for almost all of the warming that has occurred since 1950 and we are told by the IPCC was chiefly caused by us – does have a rational explanation.”

Fig 6. From Christopher Monckton. Three post-LIA rapid-warming periods betray warming’s natural drivers.
It, too, corresponds with the PDO (Earth to GHG crazies – anything?). But Monckton found more. It’s a 2005 paper by Pinker et al. depicting a satellite-detected global brightening (an increase in the flux of solar radiation reaching the Earth’s surface) from 1983-2001 due to a decrease in clouds. What’s truly remarkable is that the brightening for that 18 year period (2.9 Watts per square meter) represented nearly twice the IPCC’s estimate of the total anthropogenic influence on the climate in the 256 years between 1750 and 2005 (1.6 Watts per square meter). Please read and consider the previous sentence until you hear an “aha” somewhere in your vicinity before proceeding.
Monckton was the final of many at this year’s conference to display Willie Soon’s 2009 graph of temperature v. solar irradiation (1880-2009) in China which appears to remove any doubt remaining of correlation.
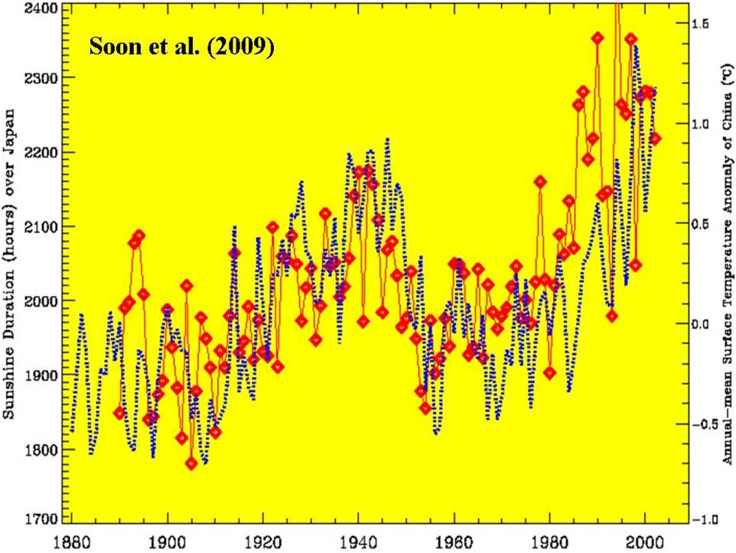
Fig 7. From Willie Soon. 130 years of Solar Irradiance (red) and mean surface temperature (blue). Alarmists: No link here.
To recap – the U.N.’s top-dollar experts are presented with the occurrence of three all-but-identical rapid warming bursts since the end of the LIA. The first 2 are obviously naturally occurring as they align perfectly with PDO and solar irradiance, but not with ACO2. The third DOES correspond to rising ACO2, but also to PDO and solar activity. So to what does the IPCC attribute the third burst?
Why, CO2, of course.
Fig 8. From Hans Labohm. World temperatures falling whilst CO2 keeps rising
Let’s consider the evidence.
The globe has been cooling for 12 (perhaps 31) years while atmospheric CO2 levels have risen 6 (perhaps 15) percent (Fig 8). Meanwhile, temperatures since the LIA ended align perfectly with PDO (Fig 1) and TSI (Fig 7). Over the past 20,000 years, increases in CO2 levels have followed periods of warming, not caused them (Fig 4). Any jury deliberating on such evidence would undoubtedly return a verdict of CO2 not guilty. But climate scientists in the UK and US tampered with the jury of public opinion when they (as compiled by Ian Plimer):
- Constructed a climate history that suppressed the MWP or the LIA, a major argument of CO2 advocates.
- Doctored climate data to show increase global warming and suppress global cooling.
- Hid or deleted data that didn’t support their beliefs.
- Took over journal editorial boards to suppress opposing views.
- Suppressed the research of scientists who didn’t agree with them
- Reviewed their own publications and claimed only “peer reviewed” papers were valid
Alarmists also got caught grossly exaggerating the effects of climate change. Contrary to the 20 feet once predicted by Al Gore, SLR is likely to remain at the same 18-22 cm per century average rate it’s been for eons and vary from location to location. Claims of impending marine species extinctions due to increases in the atmosphere’s CO2 concentration are utter nonsense, as are those of disappearing polar and glacial ice. As for the latest craze – killer storms — global hurricane activity is actually at a 30 year low and violent tornadoes have been trending downward for even longer than that.
Fossil Fuels (Coal, Natural Gas and Petroleum) provide 84% of the Nation’s energy, “Green” energy sources (Biomass, Geothermal, Wind, Solar, and Hydroelectric) account for just over 7% and nuclear almost 9%. There is no magic path to “Green jobs” or a “Green economy.” The ongoing disintegration of the EU should be proof enough of that.
Sounds like game, set and match to me.
And yet, left-leaning policy makers throughout the world would have us surrender all that mankind has achieved, “flinging us back to the Stone Age, but without even the right to light fires in our caves” as Monckton describes it. That even a small percentage of the population is willing to do so despite the overwhelming evidence that we are being conned by a well-organized and well-funded eco-socialist movement is nothing short of staggering.
That Obama and the Democrats plan to exploit public outrage over the entirely unrelated BP disaster to muster votes for this larceny of our freedom is downright vulgar.
Says Monckton: “At a time of grave economic hardship it is the height not only of folly but of cruelty to spend any more money whatsoever on trying to mitigate global bloody warming.” This was a rare moment of understatement from his Lordship. Given the new consensus — any time would be the wrong time to spend any money mitigating global warming.
New consensus? Granted, not yet the collective position of the vocal scientific majority, but Monckton hit it right on the head:
“In the end the truth is the center of every lasting consensus.”
And the truth has become glaringly obvious.